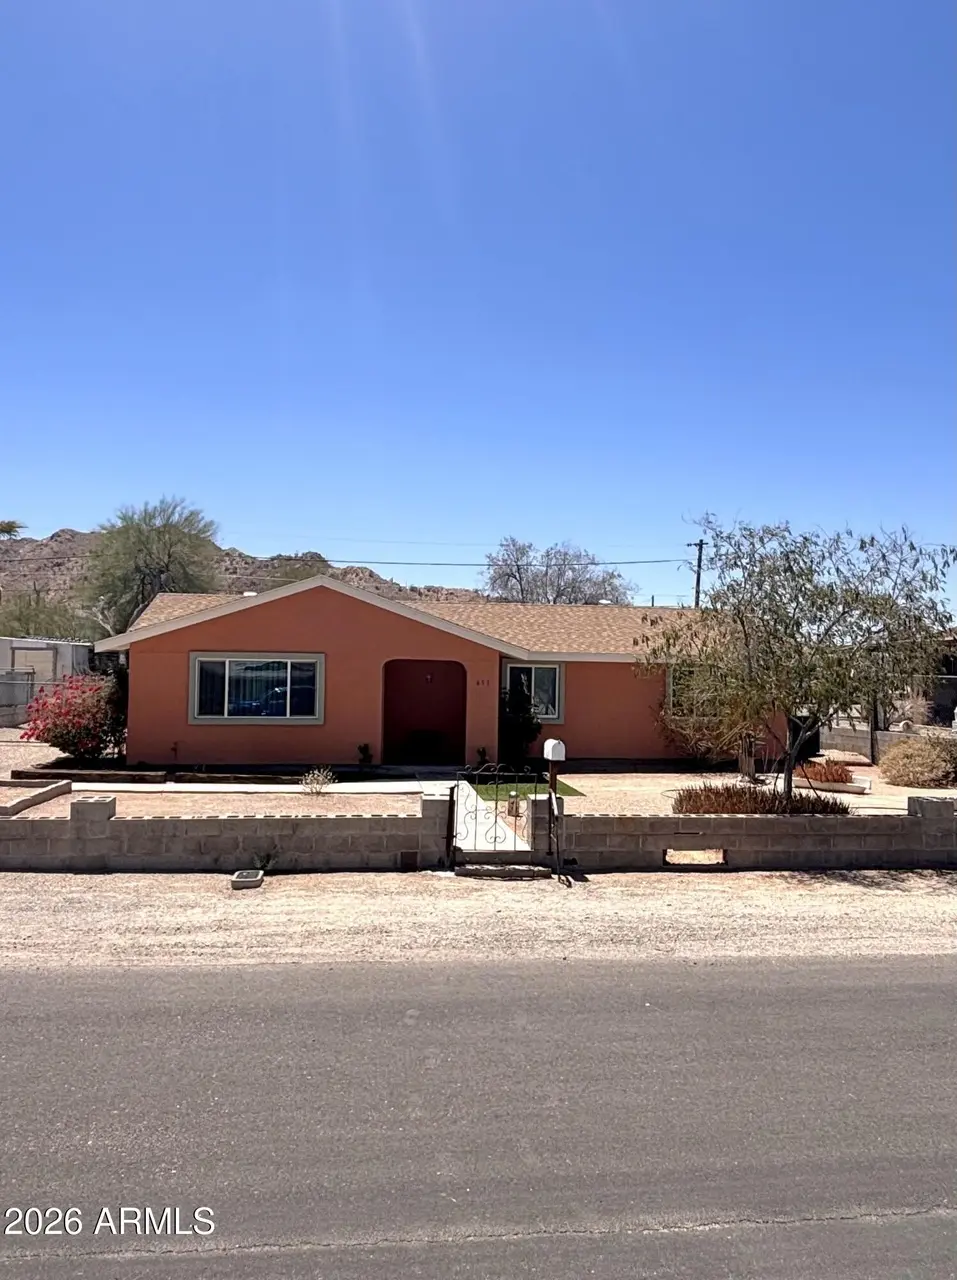
651 N Thompson Ave · Ajo, AZ
Flood risk 1/10 · Minimal
- FEMA flood zone
- X (unshaded)
- Chance of flooding over 30 yrs
- 0.0%
- Est. flood insurance / yr
- $507 – $1,088
Fire risk 4/10 · Minor
- Est. fire insurance / yr
- $610 – $1,132
Heat risk 9/10 · Severe
- Hot days now (above 111°F)
- 7 days/yr
- Hot days in 30 yrs
- 18 days/yr
Wind risk 1/10 · Minimal
- Chance of severe wind over 30 yrs
- —
Air-quality risk 2/10 · Minimal
- Unhealthy air days now
- 1 days/yr
- Unhealthy air days in 30 yrs
- 1 days/yr
Risk factors via First Street. Map © Google.
Why this score? — see what drove the F grade
The composite is a weighted blend of 9 inputs, each scored 0–100. Each bar is that input's sub-score; the figure is the points it added to the 100-point composite (weight × sub-score).
- Cash flow +15.6/30.0
- DSCR +4.8/10.0
- Livability +3.2/5.0
- 1% rule +3.1/10.0
- Rent growth +2.5/5.0
- Condition / age +2.5/5.0
- Schools +2.4/10.0
- ARV discount +0.0/15.0
- Appreciation +0.0/10.0
$185,000
🖨 Deal sheet (PDF) 📄 Offer letter ✓ Due diligence
Listing remarks
Professionally remodeled and ready for occupancy, This 3-bedroom, 2-bath home offers 1,328 sq. ft. of comfortable living space with a stucco exterior, new roof, laminate flooring, updated bathrooms, and vinyl windows throughout. The spacious living area flows into an open kitchen featuring a gas range, built-in microwave, and refrigerator. The primary suite boasts a custom tiled walk-in shower with designer accents. Washer and dryer convey. Outside, enjoy RV gate access, additional parking, a large backyard with mountain views, and a quiet street location. Situated in historic Ajo, known for its charming town plaza, desert beauty, and easy access to the beaches and fishing destinations of P
Key facts
- 8,969 sq ft lot
- 3 parking spots
- Built 1979
Property features AI
Finance
- HOA & community: No association fees
Exterior
- Parking: 3 open parking spaces
- Utilities: Private water company; Septic tank
- Home design: Single-family residence; Fee simple ownership
- Construction: Stucco and block exterior; Composition roof; Block foundation (construction type indicated)
- Exterior features: Stucco and block construction; Block and chain-link fencing; Composition roof; Desert front yard with gravel/stone front and back; County-maintained road; Asphalt road surface; Views of city, desert, and mountains
Interior
- Kitchen: Built-in microwave; Walk-in pantry; Refrigerator included
- Bedrooms: Up to 4 bedrooms (possible)
- Flooring: Laminate flooring
- Bathrooms: 2 full bathrooms
- Heating & cooling: Natural gas heating; Central air; Ceiling fans
- Interior features: High-speed internet available; Eat-in kitchen; Full bathroom in master bedroom; Dual-pane windows with vinyl frames
- Laundry & utility: Has heating and cooling systems
Neighborhood map
What this means for you Summary
Snapshot
- This is a 3-bed/2.0-bath single-family listed at $185k.
Deal economics
- At list price, monthly cash flow is $78 ($939/yr) — positive.
- The deal already cash-flows at list — no discount required.
- To meet the 1% rule (rent ≥ 1% of price), the offer needs to be $150k (18.7% below list).
- Recommended offer: $150k (18.7% below list) — sets the bar for 1% rule.
Location & tenants
- Location reads 63/100 on livability (#115 in AZ) — a middle-class / working-renter tenant base. Strengths: cost of living A+, housing A+, crime A-; Watch: amenities F, commute D-, employment D-.
- Ajo Unified District (4409) (town): math 25% / reading 25% proficiency, ranked #343 of 501 in AZ (top 68%) — low school quality limits family demand, transient renter base, plan for 1-2y turnover.
- Zoned schools: Ajo Elementary School (math 8% / reading 22%, grade F, #888 of 1,109 statewide, top 81%, 268 students, 75% FRL); Ajo High School (math 10% / reading 10%, grade F, #298 of 381 statewide, top 90%, 135 students, 68% FRL) — zoned schools average 71% FRL vs 56% district-wide (16 pts higher); higher-poverty schools than district average — tighter screening recommended.
- Zoned-school proficiency averages 12% at this address vs 25% district-wide (-13 pts) — the specific schools serving this property underperform the Ajo Unified District (4409) average; the district grade overstates school quality for this exact location.
- Market conditions: 37 active listings in the ZIP; 5,268 units permitted in Pima County in 2024 (996 in 5+ unit buildings).
Forward outlook
- Local home prices are declining (-3.0%/yr); year-one equity from $1k of loan paydown is wiped out by about $6k of value loss. Plan a longer hold.
- Pima County population projected at +8% by 2050 — modest demand growth; plan on rents tracking national, not racing it.
Negotiation context
- It's been on market 15 days — a 2% lower offer ($182k) is reasonable based on typical stale-listing flexibility.
- Current owner paid $53k; list at $185k implies a 249% gain — meaningful room to come down on a strong offer.
Risks & watch-outs
- Climate carrying-cost: extreme-heat days projected 7→18/yr by 2055 (HVAC capex compounding) — expect insurance premiums to compound above CPI over the hold.
Questions for the listing agent
- Built in 1979 — when were the roof, HVAC, electrical panel, plumbing, and water heater last replaced?
- Is there a deadline driving the sale (1031 exchange, divorce, estate, relocation)? That informs how much negotiation room exists.
- Schools are F-rated, which usually means shorter tenancies and higher turnover. Who's the typical renter profile here, and what's been the actual vacancy rate?
- The area grade is low — what's the realistic commute time and amenity access for the typical tenant pool here? Any planned neighborhood developments (good or bad) we should know about?
- What's the average days-on-market for RENTAL listings here right now (not sales)? A rising rental-DOM trend means longer vacancies and softer asking-rent achievability than the comps imply.
- What's the recent tenant-quality profile in this submarket — average credit score on applications, eviction rate, late-payment / NSF rate, and stable-employment percentage? A property-management company in the area should have these aggregated.
- How much new for-sale + rental construction is in the pipeline within 1–3 miles? Heavy new supply typically softens prices + rents 12–24 months out; constrained supply supports both.
Investment metrics
- 1% rule
- 0.81% ✗
- Cap rate
- 6.80%
- Cash-on-cash
- 1.81%
- DSCR
- 1.08
- GRM
- 10.2
CMA / ARV
- ARV (on-the-fly)
- $158,032
- Comps found
- 12
Show comp detail 12 sales within ~0.75 mi
| Address | Dist | Beds/Ba | Sqft | Sold | Price | $/sf | Match |
|---|---|---|---|---|---|---|---|
| 601 N Thompson Ave | 0.07mi | 3/2.0 | 1,370 (+3%) | 1mo | $157,000 | $115 | 91 |
| 600 N Thompson Ave | 0.08mi | 3/2.0 | 1,400 (+5%) | 12mo | $153,000 | $109 | 77 |
| 800 N Lyons Ave | 0.18mi | 3/2.0 | 1,330 (+0%) | 18mo | $145,000 | $109 | 76 |
| 901 N Sartillion Ave | 0.16mi | 2/2.0 (-1) | 1,188 (-10%) | 7mo | $147,000 | $124 | 64 |
| 520 W Rocalla Ave | 0.52mi | 3/2.0 | 1,217 (-8%) | 8mo | $145,000 | $119 | 55 |
| 920 N Thompson Ave | 0.18mi | 2/2.0 (-1) | 1,136 (-14%) | 11mo | $60,000 | $53 | 54 |
| 361 W Placer St | 0.66mi | 3/2.0 | 1,216 (-8%) | 5mo | $147,000 | $121 | 51 |
| 230 W 1st Ave | 0.66mi | 2/2.5 (-1) | 1,400 (+5%) | 3mo | $215,000 | $154 | 51 |
| 500 W Rocalla Ave | 0.54mi | 2/2.0 (-1) | 1,254 (-6%) | 12mo | $154,900 | $124 | 50 |
| 410 W 7th St | 0.73mi | 3/2.0 | 1,321 (-0%) | 21mo | $145,000 | $110 | 48 |
| 33 N Rosedale Ave | 0.50mi | 2/2.0 (-1) | 1,200 (-10%) | 15mo | $175,000 | $146 | 43 |
| 321 W 3rd Ave | 0.63mi | 2/2.0 (-1) | 1,426 (+7%) | 13mo | $140,000 | $98 | 42 |
Match score weights: distance 35% · size 25% · config 20% · recency 20%. Top-matched comps best support the ARV.
Projected returns pro-forma
-3.0% appreciation · 3.0% rent growth · sell at horizon
- IRR
- -13.5%
- Equity multiple
- 0.52×
- Total profit
- $-25,075
- Equity at exit
- $27,584
- IRR
- -4.6%
- Equity multiple
- 0.70×
- Total profit
- $-15,746
- Equity at exit
- $15,995
Cash invested: $51,800 (down + closing). Projections, not guarantees.
Landlord ↔ Tenant lean methodology
- Overall (STATE)
- 87 Strongly Landlord-Friendly
- State Arizona
- 87 Strongly Landlord-Friendly · R+3
- County
- — inherits STATE
- City
- — inherits STATE
ZIP-level market 85321
- Home prices YoY
- -5.6%
- Active inventory
- 37
- Price-to-rent
- 10.2×
Monthly cashflow live
- Estimated rent
- $1,505 medium interval (Pro) →
- Mortgage (P&I)
- −$970
- Tax from tax record
- −$63 /mo · $758/yr
- Insurance
- −$77
- HOA
- −$0
- Vacancy / Maint / Mgmt
- −$316
- Net cashflow
- $78
Break-even live
Sensitivity live
| Price | -10% $183 | -5% $131 | +0% $78 | +5% $26 | +10% $-26 |
|---|---|---|---|---|---|
| Rent | -10% $-41 | -5% $19 | +0% $78 | +5% $138 | +10% $197 |
| Rate | -1.0pp $171 | -0.5pp $125 | base $78 | +0.5pp $30 | +1.0pp $-18 |
UW: 25.0% down · 7.5% · 30yr · 1.5% tax · 5.0% vac · 8.0% maint · 8.0% mgmt
Financing live
Cash to close
- Down payment
- $46,250
- Closing costs
- $5,550
- Reserves months
- —
- Total cash needed
- —
Loan-product check · same deal, 3 products live
Conventional
25% down · 7.5% · 30yr
- Down + closing
- —
- Monthly P&I
- —
- Monthly cashflow
- —
- DSCR
- —
- Eligible?
- —
Personal DTI + credit; lowest rate.
DSCR
20% down · 8.5% · 30yr
- Down + closing
- —
- Monthly P&I
- —
- Monthly cashflow
- —
- DSCR
- —
- Eligible?
- —
No personal income docs; deal must DSCR.
Hard money
10% down · 12.0% · 12mo
- Down + closing
- —
- Monthly P&I
- —
- Monthly cashflow
- —
- DSCR
- —
- Eligible?
- —
Short-term bridge; refi at stabilization.
Listing history 12 events
-
2026-06-21days on market $185,000 Active 15 DOM
-
2026-06-19days on market $185,000 Active 13 DOM
-
2026-06-18days on market $185,000 Active 12 DOM
-
2026-06-17days on market $185,000 Active 11 DOM
-
2026-06-16days on market $185,000 Active 10 DOM
-
2026-06-15days on market $185,000 Active 9 DOM
-
2026-06-14days on market $185,000 Active 7 DOM
-
2026-06-12days on market $185,000 Active 6 DOM
-
2026-06-09days on market $185,000 Active 3 DOM
-
2026-06-08days on market $185,000 Active 2 DOM
-
2026-06-07remarks 699-char remark
-
2026-06-07$185,000 Active 1 DOM
ⓘ Source: listings_history table (triggers on properties + properties_extension) + one-shot
backfill from property_details.listing_events for pre-trigger history.
Tax reassessment forecast AZ · Resets to sale price
- Current annual tax
- $758 · $63/mo
- Projected year-2 tax
- $1,221 · $102/mo
- Expected delta
- +$463/yr (+$39/mo · 61.1%)
ⓘ Screening estimate from a state-policy table — verify with the county assessor before closing.
Climate risk First Street
- Flood 1/10 Low FEMA zone X (unshaded) · 0% chance over 30 yrs
- Wildfire 4/10 Moderate
- Heat 9/10 Extreme 7 d/yr ≥111°F today · 18 d/yr by 30 yrs out
- Wind 1/10 Low
- Air quality 2/10 Low 1 unhealthy d/yr today · 1 by 30 yrs out
Nearby sold comps map
Loading sold comps map…
Walkable amenities ~0.75 mi
Loading nearby amenities…
Taxation est. · year 1
- Rental income
- $18,055
- − Mortgage interest
- −$10,363
- − Property taxes
- −$758
- − Insurance
- −$925
- − Repairs & maintenance
- −$1,444
- − Management
- −$1,444
- − Depreciation
- −$5,382
- Taxable loss
- −$2,261
- Est. tax savings @ 24.0%
- +$543
- After-tax cash flow
- $1,482/yr
For passive investors: Depreciation is non-cash, so a rental often shows a tax loss while cash-flowing — sheltering income. Rental losses are passive: they offset passive income freely, and up to $25,000/yr can offset ordinary (W-2) income if you actively participate and your MAGI is under $100k (phasing out to $0 by $150k); unused losses carry forward. On sale, claimed depreciation is recaptured at up to 25%, and gains may owe capital-gains tax (a 1031 exchange can defer both). Figures are a year-1 estimate at your 24.0% rate — not tax advice; consult a CPA.
Schools (NCES district)
- District
- Ajo Unified District (4409)
- NCES district ID
- 0400520
- Math proficiency
- 25% ▼ -2.00%
- Reading proficiency
- 25% ▼ -3.00%
- Median HH income
- $34,237
- Composite
- 23.59/100
- National rank
- #13264
- State rank
- #343 of 501 in AZ
Livability — Ajo
- Score
- 63/100
- State rank
- #115
- US rank
- #15321
Category grades
Schools grade is shown separately in the Schools card above.
Census & demographics
- Census place
- Ajo, AZ
- Population (ZIP)
- 4,313
Population outlook (Pima County) Hauer SSP2
- Today (2025)
- 1,066,056 people
- By 2030
- 1,086,684 · +1.9%
- By 2040
- 1,117,160 · +4.8%
- By 2050
- 1,149,778 · +7.9%
- By 2075
- 1,271,480 · +19.3%
- By 2100
- 1,321,160 · +23.9%
Race, ethnicity, and origin ACS 2023
- Neighborhood character
- Diverse neighborhood (Simpson 0.62)
- Race & ethnicity
- White 56% Hispanic / Latino 25% Two or more races 19% Native American 15% Asian 1%
- Hispanic origin (detail)
- Mexican 20% Puerto Rican 5%
- Common ancestry
- Lithuanian 4% Slovak 1% Italian 1%
- Foreign-born
- 4% · Canada
- Languages at home
- 78% English-only · Spanish 15% Tagalog/Filipino 1%
Political lean MEDSL · Pima
- 2024 margin
- D (+15.2) · D 57.0% · R 41.8% · Other 1.2%
- 2008→2024 swing
- +9.1pp toward D · 2008: 6.1pp · 2024: 15.2pp
- All cycles
- 2024: D+15.2 2020: D+18.7 2016: D+13.5 2012: D+5.8 2008: D+6.1
Not yet ingested
- Civics
- —
Market trends
- HPI YoY
- ▼ -10.38%
- Current HPI
- 173.7704
- Rent YoY
- —
- Metro
- —
- State GDP YoY
- ▲ 4.54%
- F500 in state
- 20
Industry mix (Fortune 500 HQ in AZ)
| Industry | F500 HQs | Revenue |
|---|---|---|
| Technology | 2 | $13B |
|
||
| Mining / Metals | 1 | $23B |
|
||
| Environmental Services | 1 | $16B |
|
||
| Metals / Steel | 1 | $14B |
|
||
| Technology Distribution | 1 | $9B |
|
||
| Homebuilding | 1 | $8B |
|
||
Price history
+293.6% since first listed5 events — show timeline
- 2026-06-06 Listed $185,000 ARMLS
- 1996-12-11 Sold (Public Records) $53,000 Public Records
- 1988-09-14 Sold (Public Records) $42,835 Public Records
- 1988-09-01 Sold (Public Records) $42,835 Public Records
- 1983-08-01 Sold (Public Records) $47,000 Public Records
Property tax history
-0.1%/yrLatest (2025): $758 · +5.0% YoY. Source: county tax records.
Cash-flow waterfall
monthlySold comps — $/sqft
last 12 mo · ≤1 miLoading sold comps…