9331 S Honeysuckle Farm Trl · Three Points, AZ
Flood risk 4/10 · Minor
- FEMA flood zone
- X (unshaded)
- Chance of flooding over 30 yrs
- 0.2%
- Est. flood insurance / yr
- $507 – $1,088
Fire risk 6/10 · Moderate
- Est. fire insurance / yr
- $610 – $1,132
Heat risk 8/10 · Major
- Hot days now (above 106°F)
- 6 days/yr
- Hot days in 30 yrs
- 17 days/yr
Wind risk 1/10 · Minimal
- Chance of severe wind over 30 yrs
- —
Air-quality risk 1/10 · Minimal
- Unhealthy air days now
- 0 days/yr
- Unhealthy air days in 30 yrs
- 0 days/yr
Risk factors via First Street. Map © Google.
Why this score? — see what drove the B- grade
The composite is a weighted blend of 9 inputs, each scored 0–100. Each bar is that input's sub-score; the figure is the points it added to the 100-point composite (weight × sub-score).
- Cash flow +30.0/30.0
- 1% rule +10.0/10.0
- DSCR +10.0/10.0
- ARV discount +7.5/15.0
- Livability +2.7/5.0
- Rent growth +2.5/5.0
- Condition / age +2.5/5.0
- Schools +1.5/10.0
- Appreciation +0.0/10.0
$75,900
🖨 Deal sheet 📄 Offer letter ✓ Due diligence
Listing remarks
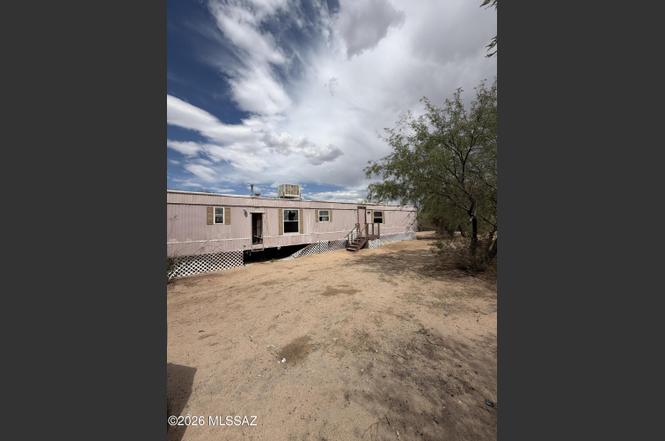
Fix-and-flip opportunity with tons of potential! Located on approximately 1 acre, this 1977 single-wide manufactured home features 3 bedrooms and 2 bathrooms and is ready for a complete transformation. The property requires cleanup, repairs, and renovation, making it an excellent opportunity for investors, flippers, contractors, or buyers looking for their next project. With a full acre of land, there is room to improve and maximize value. Property is being sold strictly AS-IS, WHERE-IS. CASH ONLY. Buyer to verify all facts and figures, including square footage, utilities, zoning, permits, and intended use. Information deemed reliable but not guaranteed.
Key facts
- Approximately 1 acre
- Full acre of land
- 1 acre lot
Tags
Property features AI
Finance
- Other: Zoning: Pima County - GR1; Lot approximately 43,560 sq ft (irregular shape)
Exterior
- Parking: Circular driveway
- Utilities: Water from local water company; Septic tank
- Home design: Mobile home; Single-story; Fixer condition
- Construction: Wood frame construction; Metal roof; Built as a frame structure
- Exterior features: Field and shared fencing; Dirt road access; Subdivided lot
Interior
- Flooring: Vinyl
- Bathrooms: 2 full bathrooms
- Heating & cooling: Zoned heating
- Interior features: Vinyl flooring; Laundry room
- Laundry & utility: Laundry room
Neighborhood map
What this means for you Summary
Snapshot
- This is a 3-bed/2.0-bath manufactured listed at $76k.
Deal economics
- At list price, monthly cash flow is $976 ($12k/yr) — positive.
- The deal already cash-flows at list — no discount required.
- Meets the 1% rule at list price ($2k rent vs $76k).
- Cap rate 21.7% vs local median 4.8% in Three Points — top-decile yield for the area; either an underpriced asset or a hidden risk that comps aren't pricing in. Stress-test before assuming the spread holds.
Location & tenants
- Location reads 53/100 on livability (#286 in AZ) — a working-class tenant base; expect higher turnover. Strengths: cost of living A+, housing A+; Watch: amenities F, commute F, employment D-.
- Altar Valley Elementary District (4418) (rural): math 15% / reading 19% proficiency, ranked #202 of 249 in AZ (top 81%) — low school quality limits family demand, transient renter base, plan for 1-2y turnover; 68% free/reduced lunch — lower-income household profile, screen leases tightly.
- Zoned schools: Robles Elementary School (math 17% / reading 17%, grade F, #814 of 1,109 statewide, top 76%, 389 students, 79% FRL); Altar Valley Middle School (math 14% / reading 19%, grade F, #151 of 218 statewide, top 70%, 196 students, 69% FRL).
- Market conditions: 83 active listings in the ZIP; 5,268 units permitted in Pima County in 2024 (996 in 5+ unit buildings).
Forward outlook
- Local home prices are declining (-3.0%/yr); year-one equity from $525 of loan paydown is wiped out by about $2k of value loss. Plan a longer hold.
- Pima County population projected at +8% by 2050 — modest demand growth; plan on rents tracking national, not racing it.
- At projected returns (-3.0% appreciation + 3.0% rent growth), your $21k cash investment doubles in ~3 years — after that, you're playing with house money.
Negotiation context
- Only 4 days on market — expect competitive offers; lowballing is unlikely to land.
- 2 sale attempts since 15y ago with the ask held roughly flat each time — persistent listings suggest the price (not the market) is what's stuck; bring a comps-based counter.
Risks & watch-outs
- Climate carrying-cost: major wildfire risk; extreme-heat days projected 6→17/yr by 2055 (HVAC capex compounding) — expect insurance premiums to compound above CPI over the hold.
Questions for the listing agent
- Built in 1977 — when were the roof, HVAC, electrical panel, plumbing, and water heater last replaced?
- Is there a deadline driving the sale (1031 exchange, divorce, estate, relocation)? That informs how much negotiation room exists.
- Schools are F-rated, which usually means shorter tenancies and higher turnover. Who's the typical renter profile here, and what's been the actual vacancy rate?
- What's the average days-on-market for RENTAL listings here right now (not sales)? A rising rental-DOM trend means longer vacancies and softer asking-rent achievability than the comps imply.
- What's the recent tenant-quality profile in this submarket — average credit score on applications, eviction rate, late-payment / NSF rate, and stable-employment percentage? A property-management company in the area should have these aggregated.
- How much new for-sale + rental construction is in the pipeline within 1–3 miles? Heavy new supply typically softens prices + rents 12–24 months out; constrained supply supports both.
Investment metrics
- 1% rule
- 2.41% ✓
- Cap rate
- 21.72%
- Cash-on-cash
- 55.10%
- DSCR
- 3.45
- GRM
- 3.5
CMA / ARV
No comps found within radius.
Projected returns pro-forma
-3.0% appreciation · 3.0% rent growth · sell at horizon
- IRR
- 53.3%
- Equity multiple
- 3.35×
- Total profit
- $49,840
- Equity at exit
- $11,317
- IRR
- 58.5%
- Equity multiple
- 6.81×
- Total profit
- $123,395
- Equity at exit
- $6,562
Cash invested: $21,252 (down + closing). Projections, not guarantees.
Landlord ↔ Tenant lean methodology
- Overall (STATE)
- 87 Strongly Landlord-Friendly
- State Arizona
- 87 Strongly Landlord-Friendly · R+3
- County
- — inherits STATE
- City
- — inherits STATE
ZIP-level market 85735
- Home prices YoY
- -16.4%
- Active inventory
- 83
- Price-to-rent
- 3.5×
Monthly cashflow live
- Estimated rent
- $1,828 medium interval (Pro) →
- Mortgage (P&I)
- −$398
- Tax from tax record
- −$39 /mo · $468/yr
- Insurance
- −$32
- HOA
- −$0
- Vacancy / Maint / Mgmt
- −$384
- Net cashflow
- $976
Break-even live
UW: 25.0% down · 7.5% · 30yr · 1.5% tax · 5.0% vac · 8.0% maint · 8.0% mgmt
Financing live
Cash to close
- Down payment
- $18,975
- Closing costs
- $2,277
- Reserves months
- —
- Total cash needed
- —
Loan-product check · same deal, 3 products live
Conventional
25% down · 7.5% · 30yr
- Down + closing
- —
- Monthly P&I
- —
- Monthly cashflow
- —
- DSCR
- —
- Eligible?
- —
Personal DTI + credit; lowest rate.
DSCR
20% down · 8.5% · 30yr
- Down + closing
- —
- Monthly P&I
- —
- Monthly cashflow
- —
- DSCR
- —
- Eligible?
- —
No personal income docs; deal must DSCR.
Hard money
10% down · 12.0% · 12mo
- Down + closing
- —
- Monthly P&I
- —
- Monthly cashflow
- —
- DSCR
- —
- Eligible?
- —
Short-term bridge; refi at stabilization.
Listing history 5 events
-
2026-06-18days on market $75,900 Active 4 DOM
-
2026-06-17days on market $75,900 Active 3 DOM
-
2026-06-16days on market $75,900 Active 2 DOM
-
2026-06-15remarks 662-char remark
-
2026-06-15$75,900 Active 1 DOM
ⓘ Source: listings_history table (triggers on properties + properties_extension) + one-shot
backfill from property_details.listing_events for pre-trigger history.
Tax reassessment forecast AZ · Resets to sale price
- Current annual tax
- $468 · $39/mo
- Projected year-2 tax
- $501 · $42/mo
- Expected delta
- +$33/yr (+$3/mo · 7.1%)
ⓘ Screening estimate from a state-policy table — verify with the county assessor before closing.
Climate risk First Street
- Flood 4/10 Moderate FEMA zone X (unshaded) · 20% chance over 30 yrs
- Wildfire 6/10 Major
- Heat 8/10 Severe 6 d/yr ≥106°F today · 17 d/yr by 30 yrs out
- Wind 1/10 Low
- Air quality 1/10 Low 0 unhealthy d/yr today · 0 by 30 yrs out
Nearby sold comps map
Loading sold comps map…
Walkable amenities ~0.75 mi
Loading nearby amenities…
Taxation est. · year 1
- Rental income
- $21,940
- − Mortgage interest
- −$4,252
- − Property taxes
- −$468
- − Insurance
- −$380
- − Repairs & maintenance
- −$1,755
- − Management
- −$1,755
- − Depreciation
- −$2,208
- Taxable income
- $11,123
- Est. tax owed @ 24.0%
- −$2,669
- After-tax cash flow
- $9,039/yr
For passive investors: Depreciation is non-cash, so a rental often shows a tax loss while cash-flowing — sheltering income. Rental losses are passive: they offset passive income freely, and up to $25,000/yr can offset ordinary (W-2) income if you actively participate and your MAGI is under $100k (phasing out to $0 by $150k); unused losses carry forward. On sale, claimed depreciation is recaptured at up to 25%, and gains may owe capital-gains tax (a 1031 exchange can defer both). Figures are a year-1 estimate at your 24.0% rate — not tax advice; consult a CPA.
Schools (NCES district)
- District
- Altar Valley Elementary District (4418)
- NCES district ID
- 0404770
- Math proficiency
- 15% ▼ -13.00%
- Reading proficiency
- 19% ▼ -9.00%
- Median HH income
- $40,645
- Composite
- 14.52/100
- National rank
- #9420
- State rank
- #202 of 249 in AZ
Livability — Three Points
- Score
- 53/100
- State rank
- #286
- US rank
- #24371
Category grades
Schools grade is shown separately in the Schools card above.
Census & demographics
- Census place
- Three Points, AZ
- City population
- 10,893
- Population (ZIP)
- 10,893
Population outlook (Pima County) Hauer SSP2
- Today (2025)
- 1,066,056 people
- By 2030
- 1,086,684 · +1.9%
- By 2040
- 1,117,160 · +4.8%
- By 2050
- 1,149,778 · +7.9%
- By 2075
- 1,271,480 · +19.3%
- By 2100
- 1,321,160 · +23.9%
Race, ethnicity, and origin ACS 2023
- Neighborhood character
- Diverse neighborhood (Simpson 0.59)
- Race & ethnicity
- Hispanic / Latino 50% White 41% Two or more races 19% Native American 6%
- Hispanic origin (detail)
- Mexican 47%
- Common ancestry
- Lithuanian 2% Slovak 1% Romanian 1%
- Foreign-born
- 9% · Canada
- Languages at home
- 74% English-only · Spanish 25%
Political lean MEDSL · Pima
- 2024 margin
- D (+15.2) · D 57.0% · R 41.8% · Other 1.2%
- 2008→2024 swing
- +9.1pp toward D · 2008: 6.1pp · 2024: 15.2pp
- All cycles
- 2024: D+15.2 2020: D+18.7 2016: D+13.5 2012: D+5.8 2008: D+6.1
Not yet ingested
- Civics
- —
Market trends
- HPI YoY
- ▼ -59.03%
- Current HPI
- 301.1413
- Rent YoY
- —
- Metro
- —
- State GDP YoY
- ▲ 4.54%
- F500 in state
- 20
Industry mix (Fortune 500 HQ in AZ)
| Industry | F500 HQs | Revenue |
|---|---|---|
| Technology | 2 | $13B |
|
||
| Mining / Metals | 1 | $23B |
|
||
| Environmental Services | 1 | $16B |
|
||
| Metals / Steel | 1 | $14B |
|
||
| Technology Distribution | 1 | $9B |
|
||
| Homebuilding | 1 | $8B |
|
||
Price history
+442.1% since first listed3 events — show timeline
- 2026-06-14 Listed $75,900 MLSSAZ
- 2011-12-15 Listing Removed — MLSSAZ
- 2011-09-27 Listed $14,000 MLSSAZ
Property tax history
-0.7%/yrLatest (2025): $468 · +4.1% YoY. Source: county tax records.
Cash-flow waterfall
monthlySold comps — $/sqft
last 12 mo · ≤1 miLoading sold comps…