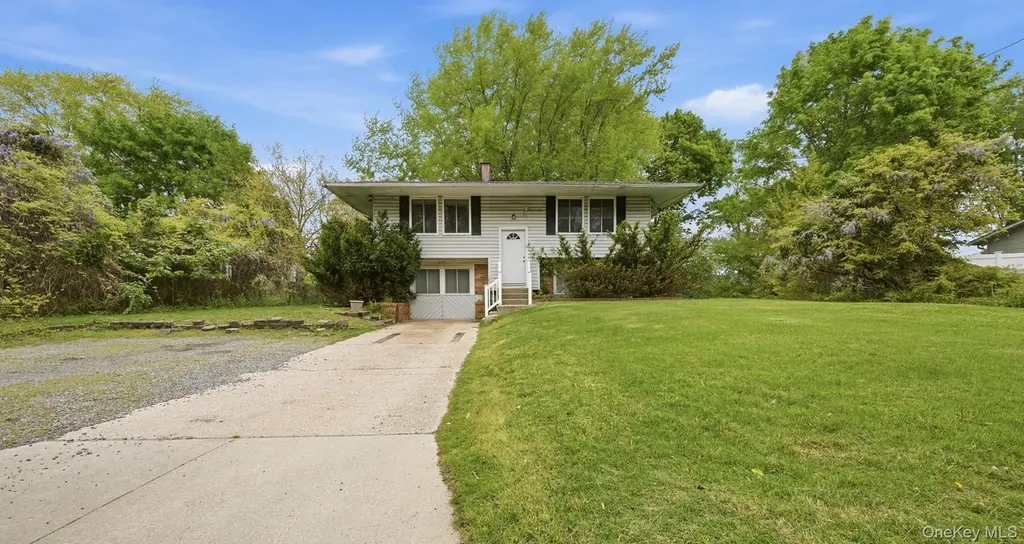
285 Sheep Pasture Rd · East Setauket, NY
Flood risk 1/10 · Minimal
- FEMA flood zone
- X (unshaded)
- Chance of flooding over 30 yrs
- 0.0%
- Est. flood insurance / yr
- $507 – $1,088
Fire risk 2/10 · Minimal
- Est. fire insurance / yr
- $691 – $1,283
Heat risk 5/10 · Moderate
- Hot days now (above 95°F)
- 7 days/yr
- Hot days in 30 yrs
- 16 days/yr
Wind risk 8/10 · Major
- Chance of severe wind over 30 yrs
- 80.0%
Air-quality risk 4/10 · Minor
- Unhealthy air days now
- 4 days/yr
- Unhealthy air days in 30 yrs
- 5 days/yr
Risk factors via First Street. Map © Google.
Why this score? — see what drove the D grade
The composite is a weighted blend of 9 inputs, each scored 0–100. Each bar is that input's sub-score; the figure is the points it added to the 100-point composite (weight × sub-score).
- ARV discount +10.2/15.0
- Cash flow +9.7/30.0
- Schools +7.6/10.0
- 1% rule +3.2/10.0
- DSCR +2.7/10.0
- Rent growth +2.5/5.0
- Livability +2.5/5.0
- Condition / age +2.5/5.0
- Appreciation +0.0/10.0
$650,000
🖨 Deal sheet 📄 Offer letter ✓ Due diligence
Listing remarks MLS
This High Ranch located in Three village school district. Close to Stonybrook University. There're five separate heating and cool units in this house, which was equipped two years ago. All the kitchen appliance was updated two years ago.
Key facts
- Updated bathrooms
- High ranch
- 0.35 acre lot
Tags
Property features AI
Exterior
- Parking: Driveway
- Utilities: Cesspool sewer; Electricity connected; Natural gas connected
- Home design: Single family residence; Living area reported from other source
- Construction: Frame construction
- Exterior features: Frame construction; Not waterfront
Interior
- Kitchen: Gas oven; Gas range; Refrigerator
- Bedrooms: 6 total rooms (bedroom count not specified)
- Bathrooms: 2 full bathrooms
- Heating & cooling: Natural gas heating; Ductless cooling
- Interior features: Eat-in kitchen; Granite counters
- Laundry & utility: Washer; Dryer
Neighborhood map
What this means for you Summary
Snapshot
- This is a 4-bed/2.0-bath single-family listed at $650k.
Deal economics
- At list price, monthly cash flow is $-426 ($-5k/yr) — negative.
- To cash-flow at today's rent, offer at most $575k (11.6% below list).
- To meet the 1% rule (rent ≥ 1% of price), the offer needs to be $531k (18.3% below list).
- Recommended offer: $531k (18.3% below list) — sets the bar for 1% rule.
- Cap rate 5.5% vs local median 2.9% in East Setauket — top-decile yield for the area; either an underpriced asset or a hidden risk that comps aren't pricing in. Stress-test before assuming the spread holds.
Location & tenants
- Location reads: area grade D — affects rentability + tenant quality, not the cash-flow math above.
- Three Village Central School District (suburban): math 81% / reading 83% proficiency, ranked #31 of 590 in NY (top 5%) — strong family-tenant draw, lease renewals of 3-5y typical; only 5% free/reduced lunch — higher-income household profile.
- Zoned schools: Minnesauke Elementary School (math 82% / reading 82%, grade A+, #138 of 2,108 statewide, top 8%, 642 students, 12% FRL); Paul J Gelinas Junior High School (math 82% / reading 87%, grade A+, #13 of 729 statewide, top 2%, 647 students, 9% FRL); Ward Melville Senior High School (math 97% / reading 92%, grade A+, #117 of 1,100 statewide, top 11%, 1,507 students, 15% FRL).
- Market conditions: 122 active listings in the ZIP; 3 comparable units currently listed for rent nearby; rentals at typical pace (median 24d on market — plan ~3-4 weeks tenant-placement turnaround); high-income renter base; 1,366 units permitted in Suffolk County in 2024 (216 in 5+ unit buildings).
- This rent runs 37% of the median local income ($173k/yr) — at the standard rent-burdened threshold; future hikes will face affordability resistance.
Forward outlook
- Local home prices are declining (-3.0%/yr); year-one equity from $4k of loan paydown is wiped out by about $20k of value loss. Plan a longer hold.
- Suffolk County population projected to shrink 5% by 2050 — rents likely to lag national; underwrite the cash flow, not the appreciation.
Negotiation context
- It's been on market 39 days — a 3% lower offer ($630k) is reasonable based on typical stale-listing flexibility.
- 7 sale attempts since 14y ago with the ask held roughly flat each time — persistent listings suggest the price (not the market) is what's stuck; bring a comps-based counter.
- Current owner paid $450k; 44% above their basis — modest negotiation headroom, anchor on the comps not their cost.
Risks & watch-outs
- Climate carrying-cost: severe wind risk, 80% chance of damaging wind over 30y; extreme-heat days projected 7→16/yr by 2055 (HVAC capex compounding) — expect insurance premiums to compound above CPI over the hold.
Questions for the listing agent
- What do current leases actually rent for vs. the listed asking? Can we see a recent rent roll and the last 12 months of T-12 income?
- It's been on market 39 days. Have you received any prior offers? Is the seller open to a 18% concession, seller financing, or rate buy-down credit?
- Built in 1965 — when were the roof, HVAC, electrical panel, plumbing, and water heater last replaced?
- Is there a deadline driving the sale (1031 exchange, divorce, estate, relocation)? That informs how much negotiation room exists.
- The area grade is low — what's the realistic commute time and amenity access for the typical tenant pool here? Any planned neighborhood developments (good or bad) we should know about?
- What's the average days-on-market for RENTAL listings here right now (not sales)? A rising rental-DOM trend means longer vacancies and softer asking-rent achievability than the comps imply.
- What's the recent tenant-quality profile in this submarket — average credit score on applications, eviction rate, late-payment / NSF rate, and stable-employment percentage? A property-management company in the area should have these aggregated.
- How much new for-sale + rental construction is in the pipeline within 1–3 miles? Heavy new supply typically softens prices + rents 12–24 months out; constrained supply supports both.
Investment metrics
- 1% rule
- 0.82% ✗
- Cap rate
- 5.51%
- Cash-on-cash
- -2.81%
- DSCR
- 0.87
- GRM
- 10.2
CMA / ARV
- ARV (median comp)
- $690,676
- List price
- $650,000
- Delta
- -5.89%
- Verdict
- FAIR
- Comps
- 20 within 1.0 mi
Show comp detail 8 sales within ~0.75 mi
| Address | Dist | Beds/Ba | Sqft | Sold | Price | $/sf | Match |
|---|---|---|---|---|---|---|---|
| 4 Badger Ln | 0.39mi | 3/2.0 (-1) | 1,488 (-1%) | 1mo | $550,000 | $370 | 75 |
| 325 Old Town Rd | 0.20mi | 3/1.5 (-1) | 1,488 (-1%) | 14mo | $525,000 | $353 | 71 |
| 19 Partridge Ln | 0.07mi | 3/1.5 (-1) | 1,300 (-13%) | 6mo | $615,000 | $473 | 63 |
| 30 Bunny Ln | 0.61mi | 3/2.0 (-1) | 1,500 (0%) | 5mo | $689,000 | $459 | 62 |
| 22 Woodchuck Ln | 0.40mi | 3/1.5 (-1) | 1,610 (+7%) | 10mo | $650,000 | $404 | 54 |
| 4 Rosewood Ct | 0.26mi | 3/2.0 (-1) | 1,712 (+14%) | 12mo | $820,000 | $479 | 49 |
| 49 Bobcat Ln | 0.55mi | 3/1.5 (-1) | 1,360 (-9%) | 10mo | $680,000 | $500 | 44 |
| 17 Lillian St | 0.64mi | 3/2.0 (-1) | 1,635 (+9%) | 9mo | $613,000 | $375 | 43 |
Match score weights: distance 35% · size 25% · config 20% · recency 20%. Top-matched comps best support the ARV.
Projected returns pro-forma
-3.0% appreciation · 3.0% rent growth · sell at horizon
- IRR
- -21.0%
- Equity multiple
- 0.27×
- Total profit
- $-132,323
- Equity at exit
- $96,917
- IRR
- -14.3%
- Equity multiple
- 0.18×
- Total profit
- $-149,547
- Equity at exit
- $56,200
Cash invested: $182,000 (down + closing). Projections, not guarantees.
Landlord ↔ Tenant lean methodology
- Overall (STATE)
- 15 Strongly Tenant-Friendly
- State New York
- 15 Strongly Tenant-Friendly · D+10
- County
- — inherits STATE
- City
- — inherits STATE
ZIP-level market 11733
- Active inventory
- 122
- Price-to-rent
- 10.2×
Monthly cashflow live
- Estimated rent
- $5,307 medium interval (Pro) →
- Mortgage (P&I)
- −$3,409
- Tax from tax record
- −$940 /mo · $11,276/yr
- Insurance
- −$271
- HOA
- −$0
- Vacancy / Maint / Mgmt
- −$1,115
- Net cashflow
- $-426
Break-even live
UW: 25.0% down · 7.5% · 30yr · 1.5% tax · 5.0% vac · 8.0% maint · 8.0% mgmt
Financing live
Cash to close
- Down payment
- $162,500
- Closing costs
- $19,500
- Reserves months
- —
- Total cash needed
- —
Loan-product check · same deal, 3 products live
Conventional
25% down · 7.5% · 30yr
- Down + closing
- —
- Monthly P&I
- —
- Monthly cashflow
- —
- DSCR
- —
- Eligible?
- —
Personal DTI + credit; lowest rate.
DSCR
20% down · 8.5% · 30yr
- Down + closing
- —
- Monthly P&I
- —
- Monthly cashflow
- —
- DSCR
- —
- Eligible?
- —
No personal income docs; deal must DSCR.
Hard money
10% down · 12.0% · 12mo
- Down + closing
- —
- Monthly P&I
- —
- Monthly cashflow
- —
- DSCR
- —
- Eligible?
- —
Short-term bridge; refi at stabilization.
Rent comps 3 comps
| Address | Beds | Baths | Sqft | Rent | $/sqft | DOM | Units | Dist |
|---|---|---|---|---|---|---|---|---|
| 30 Clematis St Port Jefferson Station, NY | 4.0 | 2.0 | 2200 | $4,750 | $2.16 | 24d | 1 | 0.99mi |
| 364 Broadway Port Jefferson Station, NY | 5.0 | 2.0 | 1582 | $4,500 | $2.84 | 15d | 1 | 1.31mi |
| 34 Village Green Dr Unit 34 Port Jefferson Station, NY | 3.0 | 2.5 | 1871 | $40,000 | $21.38 | 24d | 1 | 1.43mi |
Listing history 31 events
-
2026-06-07statusdays on market $650,000 Pending 39 DOM
-
2026-06-04days on market $650,000 Active 38 DOM
-
2026-06-03days on market $650,000 Active 37 DOM
-
2026-06-02days on market $650,000 Active 36 DOM
-
2026-06-01days on market $650,000 Active 35 DOM
-
2026-05-31days on market $650,000 Active 34 DOM
-
2026-04-27$650,000 Active 726-char remark
-
2021-12-13soldstatus $450,000
-
2021-10-14historical 237-char remark
Show marketing remark (237 chars)
This High Ranch located in Three village school district. Close to Stonybrook University. There're five separate heating and cool units in this house, which was equipped two years ago. All the kitchen appliance was updated two years ago.
-
2021-10-13soldstatus $450,000 Closed 237-char remark
Show marketing remark (237 chars)
This High Ranch located in Three village school district. Close to Stonybrook University. There're five separate heating and cool units in this house, which was equipped two years ago. All the kitchen appliance was updated two years ago.
-
2021-06-24status Pending 237-char remark
Show marketing remark (237 chars)
This High Ranch located in Three village school district. Close to Stonybrook University. There're five separate heating and cool units in this house, which was equipped two years ago. All the kitchen appliance was updated two years ago.
-
2021-05-25status Active 237-char remark
Show marketing remark (237 chars)
This High Ranch located in Three village school district. Close to Stonybrook University. There're five separate heating and cool units in this house, which was equipped two years ago. All the kitchen appliance was updated two years ago.
-
2021-05-24historical 237-char remark
Show marketing remark (237 chars)
This High Ranch located in Three village school district. Close to Stonybrook University. There're five separate heating and cool units in this house, which was equipped two years ago. All the kitchen appliance was updated two years ago.
-
2021-03-16price $459,900 237-char remark
Show marketing remark (237 chars)
This High Ranch located in Three village school district. Close to Stonybrook University. There're five separate heating and cool units in this house, which was equipped two years ago. All the kitchen appliance was updated two years ago.
-
2021-03-05$469,900 Active 237-char remark
Show marketing remark (237 chars)
This High Ranch located in Three village school district. Close to Stonybrook University. There're five separate heating and cool units in this house, which was equipped two years ago. All the kitchen appliance was updated two years ago.
-
2020-04-03soldstatus $315,000
-
2020-03-27status Pending
Show marketing remark (173 chars)
.The best deal in town! location location ... hi -ranch in a prime location. this HI-RANCH future: living room, den kitchen w/ eitk ,4 bed, 2 baths, on a large property.
-
2020-02-12soldstatus $315,000 Closed
Show marketing remark (173 chars)
.The best deal in town! location location ... hi -ranch in a prime location. this HI-RANCH future: living room, den kitchen w/ eitk ,4 bed, 2 baths, on a large property.
-
2019-12-11status Under Contract
Show marketing remark (173 chars)
.The best deal in town! location location ... hi -ranch in a prime location. this HI-RANCH future: living room, den kitchen w/ eitk ,4 bed, 2 baths, on a large property.
-
2019-10-24price $332,000
Show marketing remark (173 chars)
.The best deal in town! location location ... hi -ranch in a prime location. this HI-RANCH future: living room, den kitchen w/ eitk ,4 bed, 2 baths, on a large property.
-
2019-10-18price $332,500
Show marketing remark (173 chars)
.The best deal in town! location location ... hi -ranch in a prime location. this HI-RANCH future: living room, den kitchen w/ eitk ,4 bed, 2 baths, on a large property.
-
2019-09-23$334,990 New
Show marketing remark (173 chars)
.The best deal in town! location location ... hi -ranch in a prime location. this HI-RANCH future: living room, den kitchen w/ eitk ,4 bed, 2 baths, on a large property.
-
2019-08-05historical
-
2018-10-15price $335,000
-
2018-07-29historical
-
2018-04-27price $342,000
-
2017-08-04$349,000 New
-
2017-08-04$339,000 New
-
2012-10-24soldstatus $259,000
-
2012-10-09soldstatus $259,000
-
2012-07-25$259,990
ⓘ Source: listings_history table (triggers on properties + properties_extension) + one-shot
backfill from property_details.listing_events for pre-trigger history.
Tax reassessment forecast NY · Partial reset (capped growth)
- Current annual tax
- $11,276 · $940/mo
- Projected year-2 tax
- $11,276 · $940/mo
- Expected delta
- $0/yr ($0/mo · 0.0%)
ⓘ Screening estimate from a state-policy table — verify with the county assessor before closing.
Climate risk First Street
- Flood 1/10 Low FEMA zone X (unshaded) · 0% chance over 30 yrs
- Wildfire 2/10 Low
- Heat 5/10 Major 7 d/yr ≥95°F today · 16 d/yr by 30 yrs out
- Wind 8/10 Severe 80% chance of damaging wind over 30 yrs
- Air quality 4/10 Moderate 4 unhealthy d/yr today · 5 by 30 yrs out
Nearby sold comps map
Loading sold comps map…
Walkable amenities ~0.75 mi
Loading nearby amenities…
Taxation est. · year 1
- Rental income
- $63,689
- − Mortgage interest
- −$36,410
- − Property taxes
- −$11,276
- − Insurance
- −$3,250
- − Repairs & maintenance
- −$5,095
- − Management
- −$5,095
- − Depreciation
- −$18,909
- Taxable loss
- −$16,347
- Est. tax savings @ 24.0%
- +$3,923
- After-tax cash flow
- $-1,193/yr
For passive investors: Depreciation is non-cash, so a rental often shows a tax loss while cash-flowing — sheltering income. Rental losses are passive: they offset passive income freely, and up to $25,000/yr can offset ordinary (W-2) income if you actively participate and your MAGI is under $100k (phasing out to $0 by $150k); unused losses carry forward. On sale, claimed depreciation is recaptured at up to 25%, and gains may owe capital-gains tax (a 1031 exchange can defer both). Figures are a year-1 estimate at your 24.0% rate — not tax advice; consult a CPA.
Schools (NCES district)
- District
- Three Village Central School District
- NCES district ID
- 3628200
- Math proficiency
- 81% ▼ -6.00%
- Reading proficiency
- 83% ▲ 2.00%
- Median HH income
- $121,671
- Composite
- 76.17/100
- National rank
- #113
- State rank
- #31 of 590 in NY
Livability — East Setauket
No livability data for this city. (Only ~50 U.S. cities are tracked.)
Census & demographics
- Census place
- East Setauket, NY
- County
- Suffolk County · 679,920 people
- Metro
- New York-Newark-Jersey City, NY-NJ-PA
- Population (ZIP)
- 17,752
- Household income
- $173,281
- Rent vs Own
- Severe rent burden
- 307.0
Population outlook (Suffolk County) Hauer SSP2
- Today (2025)
- 1,505,262 people
- By 2030
- 1,498,318 · -0.5%
- By 2040
- 1,471,101 · -2.3%
- By 2050
- 1,424,848 · -5.3%
- By 2075
- 1,337,157 · -11.2%
- By 2100
- 1,217,720 · -19.1%
Race, ethnicity, and origin ACS 2023
- Neighborhood character
- Predominantly White (77%)
- Race & ethnicity
- White 77% Asian 8% Hispanic / Latino 8% Two or more races 7% Black 2%
- Hispanic origin (detail)
- Puerto Rican 2%
- Common ancestry
- Romanian 5% Scotch-Irish 4% Lithuanian 2%
- Foreign-born
- 12% · Canada, China, South Korea
- Languages at home
- 87% English-only · Spanish 3% Chinese 2% Russian/Polish/Slavic 2%
Political lean MEDSL · Suffolk
- 2024 margin
- Lean R (+10.0) · D 45.0% · R 55.0%
- 2008→2024 swing
- -16.0pp toward R · 2008: 6.0pp · 2024: -10.0pp
- All cycles
- 2024: R+10.0 2020: R+0.0 2016: R+8.2 2012: D+2.9 2008: D+6.0
Not yet ingested
- Civics
- —
Market trends
- HPI YoY
- ▼ -529.06%
- Current HPI
- 287.8728
- Rent YoY
- —
- Metro
- New York-Newark-Jersey City, NY-NJ-PA
- State GDP YoY
- ▲ 2.60%
- F500 in state
- 92
Industry mix (Fortune 500 HQ in NY)
| Industry | F500 HQs | Revenue |
|---|---|---|
| Financial Services | 10 | $950B |
|
||
| Consumer Goods | 9 | $162B |
|
||
| Insurance | 4 | $225B |
|
||
| Telecommunications | 2 | $144B |
|
||
| Pharmaceuticals | 2 | $112B |
|
||
| Media / Entertainment | 2 | $69B |
|
||
Price history
+150.0% since first listed26 events — show timeline
- 2026-06-05 Pending — OneKey® MLS as Distributed by MLS Grid
- 2026-04-27 Listed $650,000 OneKey® MLS as Distributed by MLS Grid
- 2021-12-13 Sold (Public Records) $450,000 Public Records
- 2021-10-14 Listing Removed — OneKey® MLS as Distributed by MLS Grid
- 2021-10-13 Sold (MLS) $450,000 OneKey® MLS as Distributed by MLS Grid
- 2021-06-24 Pending — OneKey® MLS as Distributed by MLS Grid
- 2021-05-25 Relisted — OneKey® MLS as Distributed by MLS Grid
- 2021-05-24 Listing Removed — OneKey® MLS as Distributed by MLS Grid
- 2021-03-16 Price Changed $459,900 OneKey® MLS as Distributed by MLS Grid
- 2021-03-05 Listed $469,900 OneKey® MLS as Distributed by MLS Grid
- 2020-04-03 Sold (Public Records) $315,000 Public Records
- 2020-03-27 Pending — OneKey® MLS as Distributed by MLS Grid
- 2020-02-12 Sold (MLS) $315,000 OneKey® MLS as Distributed by MLS Grid
- 2019-12-11 Pending — OneKey® MLS as Distributed by MLS Grid
- 2019-10-24 Price Changed $332,000 OneKey® MLS as Distributed by MLS Grid
- 2019-10-18 Price Changed $332,500 OneKey® MLS as Distributed by MLS Grid
- 2019-09-23 Listed $334,990 OneKey® MLS as Distributed by MLS Grid
- 2019-08-05 Listing Removed — OneKey® MLS as Distributed by MLS Grid
- 2018-10-15 Price Changed $335,000 OneKey® MLS as Distributed by MLS Grid
- 2018-07-29 Listing Removed — OneKey® MLS as Distributed by MLS Grid
- 2018-04-27 Price Changed $342,000 OneKey® MLS as Distributed by MLS Grid
- 2017-08-04 Listed $349,000 OneKey® MLS as Distributed by MLS Grid
- 2017-08-04 Listed $339,000 OneKey® MLS as Distributed by MLS Grid
- 2012-10-24 Sold (Public Records) $259,000 Public Records
- 2012-10-09 Sold (MLS) $259,000 OneKey® MLS as Distributed by MLS Grid
- 2012-07-25 Listed $259,990 OneKey® MLS as Distributed by MLS Grid
Property tax history
+2.6%/yrLatest (2025): $11,276 · +0.0% YoY. Source: county tax records.
Cash-flow waterfall
monthlySold comps — $/sqft
last 12 mo · ≤1 miLoading sold comps…