 Multi-family
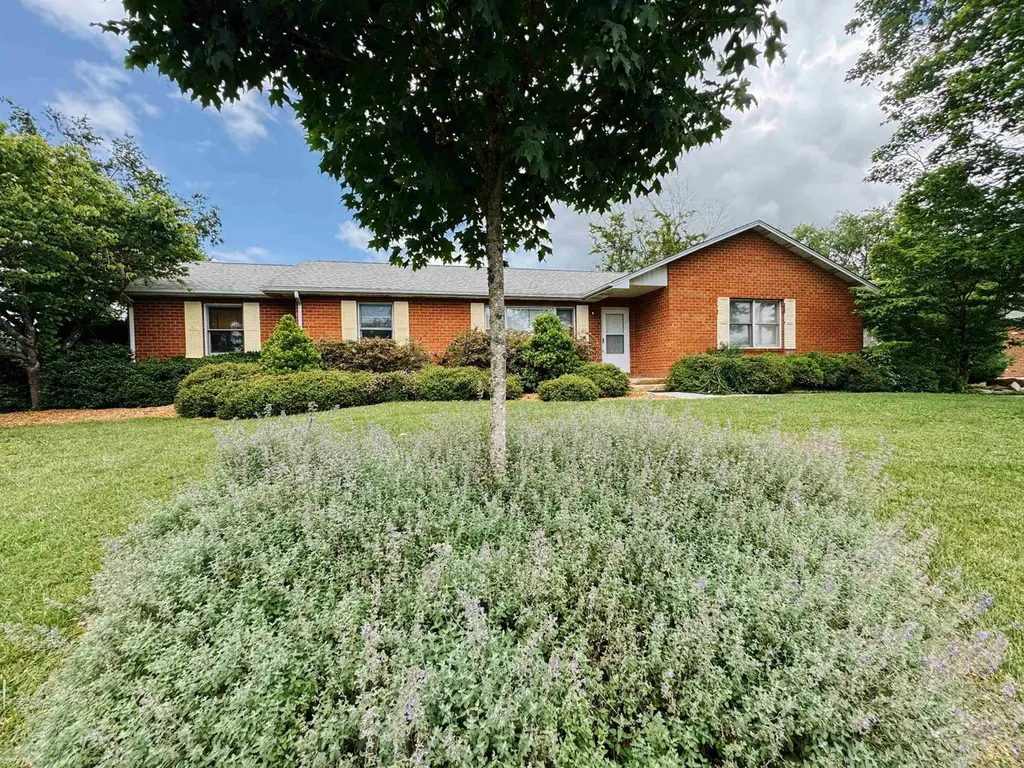
1450 & 1452 Sandy Cir · Prices Fork, VA
Flood risk 1/10 · Minimal
- FEMA flood zone
- X (unshaded)
- Chance of flooding over 30 yrs
- 0.0%
- Est. flood insurance / yr
- $507 – $1,088
Fire risk 5/10 · Moderate
- Est. fire insurance / yr
- $666 – $1,236
Heat risk 3/10 · Minor
- Hot days now (above 94°F)
- 7 days/yr
- Hot days in 30 yrs
- 21 days/yr
Wind risk 2/10 · Minimal
- Chance of severe wind over 30 yrs
- 1.0%
Air-quality risk 1/10 · Minimal
- Unhealthy air days now
- 0 days/yr
- Unhealthy air days in 30 yrs
- 0 days/yr
Risk factors via First Street. Map © Google.
Why this score? — see what drove the C+ grade
The composite is a weighted blend of 9 inputs, each scored 0–100. Each bar is that input's sub-score; the figure is the points it added to the 100-point composite (weight × sub-score).
- Cash flow +20.1/30.0
- ARV discount +15.0/15.0
- DSCR +6.4/10.0
- Schools +5.4/10.0
- 1% rule +4.3/10.0
- Livability +4.2/5.0
- Rent growth +3.5/5.0
- Condition / age +2.5/5.0
- Appreciation +0.0/10.0
$389,000
🖨 Deal sheet 📄 Offer letter ✓ Due diligence
Multi-family units
County records classify this as Multi-Family (2-4 Unit). Listing-text estimate: 1 unit. estimate disagrees with records
Listing remarks MLS
Discover a fantastic investment opportunity in desirable Montgomery Farms! This brick ranch duplex offers over 2,100 sq ft on one level, featuring two well-maintained units with a combined 5 bedrooms and 2 full baths. Each side includes a spacious living area, full kitchen, in-unit laundry, and a private back patio—ideal for comfortable everyday living. With a prime Blacksburg location near Prices Fork, local schools, shopping, and VT amenities, this property is perfect for investors or an owner-occupant seeking supplemental rental income. A solid, income-producing property you won’t want to miss! Both sides rented but a sublease will be available come February 2026 on the 2-bedroom unit.
Key facts
- Large living area
- Full kitchen
- In-unit laundry
Tags
Neighborhood map
What this means for you Summary
Snapshot
- This is a 4-bed/2.0-bath multifamily listed at $389k.
Deal economics
- At list price, monthly cash flow is $485 ($6k/yr) — positive.
- The deal already cash-flows at list — no discount required.
- To meet the 1% rule (rent ≥ 1% of price), the offer needs to be $363k (6.7% below list).
- Recommended offer: $342k (12.0% below list) — sets the bar for market timing.
- Cap rate 7.8% vs local median 3.1% in Prices Fork — top-decile yield for the area; either an underpriced asset or a hidden risk that comps aren't pricing in. Stress-test before assuming the spread holds.
Location & tenants
- Location reads 83/100 on livability (#42 in VA, #1,003 nationally) — a professional / high-income tenant draw. Strengths: commute A+, health & safety A+, housing A; Watch: amenities F.
- Montgomery County Public School District (urban): math 57% / reading 70% proficiency, ranked #47 of 131 in VA (top 36%) — acceptable for families but not a draw, mixed tenant base, ~2y average lease.
- Market conditions: Rents rising (+4.0%/yr); 313 active listings in the ZIP; 6 comparable units currently listed for rent nearby; rentals lingering (median 44d on market — plan ~5-8 weeks vacancy on turnover, expect pricing pressure); 100% of comp listings sitting > 30 days — soft ceiling on asking rent; 323 units permitted in Montgomery County in 2024 (0 in 5+ unit buildings).
- At $3,629/mo this rent would consume 64% of the median local household income ($68k/yr) (locally 3694% of renters already pay >50% of income on rent) — very limited rent-growth headroom before tenants either downsize or default.
Forward outlook
- Local home prices are declining (-3.0%/yr); year-one equity from $3k of loan paydown is wiped out by about $12k of value loss. Plan a longer hold.
- Montgomery County population projected at +13% by 2050 — modest demand growth; plan on rents tracking national, not racing it.
Negotiation context
- It's been on market 336 days — a 12% lower offer ($342k) is reasonable based on typical stale-listing flexibility.
- 2 sale attempts with the ask held roughly flat each time — persistent listings suggest the price (not the market) is what's stuck; bring a comps-based counter.
Risks & watch-outs
- Climate carrying-cost: moderate wildfire risk — expect insurance premiums to compound above CPI over the hold.
Questions for the listing agent
- It's been on market 336 days. Have you received any prior offers? Is the seller open to a 12% concession, seller financing, or rate buy-down credit?
- Why hasn't it sold? Are there any deal-killer items the seller is aware of (foundation, flood, title, zoning, code violations)?
- Is there a deadline driving the sale (1031 exchange, divorce, estate, relocation)? That informs how much negotiation room exists.
- Schools are B-rated — typically a magnet for longer-tenancy family renters. What's the average tenant stay here, and is there a school-zone premium baked into asking?
- What's the average days-on-market for RENTAL listings here right now (not sales)? A rising rental-DOM trend means longer vacancies and softer asking-rent achievability than the comps imply.
- What's the recent tenant-quality profile in this submarket — average credit score on applications, eviction rate, late-payment / NSF rate, and stable-employment percentage? A property-management company in the area should have these aggregated.
- How much new apartment / multifamily construction is in the pipeline within 1–3 miles? Heavy new supply (>2% of stock underway) typically softens rents 12–24 months out; light construction supports rent growth.
Investment metrics
- 1% rule
- 0.93% ✗
- Cap rate
- 7.79%
- Cash-on-cash
- 5.35%
- DSCR
- 1.24
- GRM
- 8.9
CMA / ARV
- ARV (median comp)
- $612,912
- List price
- $389,000
- Delta
- -36.53%
- Verdict
- UNDERPRICED
- Comps
- 20 within 1.0 mi
Projected returns pro-forma
-3.0% appreciation · 3.95% rent growth · sell at horizon
- IRR
- -7.1%
- Equity multiple
- 0.74×
- Total profit
- $-28,753
- Equity at exit
- $58,001
- IRR
- 3.5%
- Equity multiple
- 1.27×
- Total profit
- $28,875
- Equity at exit
- $33,634
Cash invested: $108,920 (down + closing). Projections, not guarantees.
Landlord ↔ Tenant lean methodology
- Overall (STATE)
- 55 Moderately Landlord-Leaning
- State Virginia
- 55 Moderately Landlord-Leaning · D+2
- County
- — inherits STATE
- City
- — inherits STATE
ZIP-level market 24060
- Rents YoY
- 4.0%
- Active inventory
- 313
- Price-to-rent
- 17.9×
Monthly cashflow live
- Estimated rent
- $3,629 high interval (Pro) →
- Mortgage (P&I)
- −$2,040
- Tax from tax record
- −$179 /mo · $2,154/yr
- Insurance
- −$162
- HOA
- −$0
- Vacancy / Maint / Mgmt
- −$762
- Net cashflow
- $485
Break-even live
2-unit breakdown (identical units grouped — click to expand)
| Units | Beds | Baths | Est. rent |
|---|---|---|---|
| 2× units | 2 | 1 | $3,628 |
| #1 | 2 | 1 | $1,814 |
| #2 | 2 | 1 | $1,814 |
| Total (2 units) | $3,629 | ||
UW: 25.0% down · 7.5% · 30yr · 1.5% tax · 5.0% vac · 8.0% maint · 8.0% mgmt
Financing live
Cash to close
- Down payment
- $97,250
- Closing costs
- $11,670
- Reserves months
- —
- Total cash needed
- —
Loan-product check · same deal, 3 products live
Conventional
25% down · 7.5% · 30yr
- Down + closing
- —
- Monthly P&I
- —
- Monthly cashflow
- —
- DSCR
- —
- Eligible?
- —
Personal DTI + credit; lowest rate.
DSCR
20% down · 8.5% · 30yr
- Down + closing
- —
- Monthly P&I
- —
- Monthly cashflow
- —
- DSCR
- —
- Eligible?
- —
No personal income docs; deal must DSCR.
Hard money
10% down · 12.0% · 12mo
- Down + closing
- —
- Monthly P&I
- —
- Monthly cashflow
- —
- DSCR
- —
- Eligible?
- —
Short-term bridge; refi at stabilization.
Rent comps 6 comps
| Address | Beds | Baths | Sqft | Rent | $/sqft | DOM | Units | Dist |
|---|---|---|---|---|---|---|---|---|
| 3016 Deptford St Blacksburg, VA | 3.0 | 3.5 | 2082 | $2,800 | $1.34 | 43d | 1 | 0.35mi |
| 1071 Balsam Ln Unit 301 Blacksburg, VA | 3.0 | 3.5 | 2096 | $2,500 | $1.19 | 43d | 1 | 0.42mi |
| 1085 Balsam Ln Unit WHT304 Blacksburg, VA | 3.0 | 3.5 | 2096 | $2,600 | $1.24 | 43d | 1 | 0.49mi |
| 1063 Balsam Ln Blacksburg, VA | 3.0 | 2.5 | 2100 | $2,700 | $1.29 | 43d | 1 | 0.51mi |
| 2005 Kyles Way Blacksburg, VA | 3.0 | 2.5 | 1658 | $2,200 | $1.33 | 43d | 1 | 0.94mi |
| 2016 Kyles Way Blacksburg, VA | 3.0 | 3.0 | 1617 | $2,375 | $1.47 | 43d | 1 | 0.98mi |
Listing history 3 events
-
2026-02-05status Active 709-char remark
Show marketing remark (709 chars)
Discover a fantastic investment opportunity in desirable Montgomery Farms! This brick ranch duplex offers over 2,100 sq ft on one level, featuring two well-maintained units with a combined 5 bedrooms and 2 full baths. Each side includes a spacious living area, full kitchen, in-unit laundry, and a private back patio—ideal for comfortable everyday living. With a prime Blacksburg location near Prices Fork, local schools, shopping, and VT amenities, this property is perfect for investors or an owner-occupant seeking supplemental rental income. A solid, income-producing property you won’t want to miss! Both sides rented but a sublease will be available come February 2026 on the 2-bedroom unit.
-
2025-11-21price $389,000 709-char remark
Show marketing remark (709 chars)
Discover a fantastic investment opportunity in desirable Montgomery Farms! This brick ranch duplex offers over 2,100 sq ft on one level, featuring two well-maintained units with a combined 5 bedrooms and 2 full baths. Each side includes a spacious living area, full kitchen, in-unit laundry, and a private back patio—ideal for comfortable everyday living. With a prime Blacksburg location near Prices Fork, local schools, shopping, and VT amenities, this property is perfect for investors or an owner-occupant seeking supplemental rental income. A solid, income-producing property you won’t want to miss! Both sides rented but a sublease will be available come February 2026 on the 2-bedroom unit.
-
2025-06-26$399,000 Active 709-char remark
Show marketing remark (709 chars)
Discover a fantastic investment opportunity in desirable Montgomery Farms! This brick ranch duplex offers over 2,100 sq ft on one level, featuring two well-maintained units with a combined 5 bedrooms and 2 full baths. Each side includes a spacious living area, full kitchen, in-unit laundry, and a private back patio—ideal for comfortable everyday living. With a prime Blacksburg location near Prices Fork, local schools, shopping, and VT amenities, this property is perfect for investors or an owner-occupant seeking supplemental rental income. A solid, income-producing property you won’t want to miss! Both sides rented but a sublease will be available come February 2026 on the 2-bedroom unit.
ⓘ Source: listings_history table (triggers on properties + properties_extension) + one-shot
backfill from property_details.listing_events for pre-trigger history.
Tax reassessment forecast VA · Resets to sale price
- Current annual tax
- $2,154 · $179/mo
- Projected year-2 tax
- $3,190 · $266/mo
- Expected delta
- +$1,036/yr (+$86/mo · 48.1%)
ⓘ Screening estimate from a state-policy table — verify with the county assessor before closing.
Climate risk First Street
- Flood 1/10 Low FEMA zone X (unshaded) · 0% chance over 30 yrs
- Wildfire 5/10 Major
- Heat 3/10 Moderate 7 d/yr ≥94°F today · 21 d/yr by 30 yrs out
- Wind 2/10 Low 100% chance of damaging wind over 30 yrs
- Air quality 1/10 Low 0 unhealthy d/yr today · 0 by 30 yrs out
Nearby sold comps map
Loading sold comps map…
Walkable amenities ~0.75 mi
Loading nearby amenities…
Taxation est. · year 1
- Rental income
- $43,548
- − Mortgage interest
- −$21,790
- − Property taxes
- −$2,154
- − Insurance
- −$1,945
- − Repairs & maintenance
- −$3,484
- − Management
- −$3,484
- − Depreciation
- −$11,316
- Taxable loss
- −$625
- Est. tax savings @ 24.0%
- +$150
- After-tax cash flow
- $5,975/yr
For passive investors: Depreciation is non-cash, so a rental often shows a tax loss while cash-flowing — sheltering income. Rental losses are passive: they offset passive income freely, and up to $25,000/yr can offset ordinary (W-2) income if you actively participate and your MAGI is under $100k (phasing out to $0 by $150k); unused losses carry forward. On sale, claimed depreciation is recaptured at up to 25%, and gains may owe capital-gains tax (a 1031 exchange can defer both). Figures are a year-1 estimate at your 24.0% rate — not tax advice; consult a CPA.
Schools (NCES district)
- District
- Montgomery County Public School District
- NCES district ID
- 5102520
- Math proficiency
- 57% ▼ -29.00%
- Reading proficiency
- 70% ▼ -11.00%
- Median HH income
- $46,618
- Composite
- 53.6/100
- National rank
- #1440
- State rank
- #47 of 131 in VA
Livability — Prices Fork
- Score
- 83/100
- State rank
- #42
- US rank
- #1003
Category grades
Schools grade is shown separately in the Schools card above.
Census & demographics
- Census place
- Prices Fork, VA
- County
- Montgomery County · 78,218 people
- Metro
- Blacksburg-Christiansburg, VA
- Population (ZIP)
- 48,541
- Household income
- $67,675
- Rent vs Own
- Severe rent burden
- 3694.0
Population outlook (Montgomery County) Hauer SSP2
- Today (2025)
- 105,748 people
- By 2030
- 110,301 · +4.3%
- By 2040
- 115,652 · +9.4%
- By 2050
- 119,651 · +13.1%
- By 2075
- 126,005 · +19.2%
- By 2100
- 129,771 · +22.7%
Race, ethnicity, and origin ACS 2023
- Neighborhood character
- Predominantly White (80%)
- Race & ethnicity
- White 80% Asian 8% Two or more races 4% Hispanic / Latino 4% Black 3%
- Common ancestry
- Romanian 3% Italian 3% Slovak 2%
- Foreign-born
- 14% · China, Canada, South Korea
- Languages at home
- 86% English-only · Other Indo-European 4% Chinese 3% Spanish 3%
Political lean MEDSL · Montgomery
- 2024 margin
- Toss-up / Even · D 50.9% · R 47.4% · Other 1.7%
- 2008→2024 swing
- -1.4pp toward R · 2008: 4.9pp · 2024: 3.5pp
- All cycles
- 2024: D+3.5 2020: D+5.8 2016: D+1.3 2012: R+0.2 2008: D+4.9
Not yet ingested
- Civics
- —
Market trends
- HPI YoY
- ▼ -176.54%
- Current HPI
- 289.8166
- Rent YoY
- ▲ 3.95%
- Metro
- Blacksburg-Christiansburg, VA
- State GDP YoY
- ▲ 2.40%
- F500 in state
- 50
Industry mix (Fortune 500 HQ in VA)
| Industry | F500 HQs | Revenue |
|---|---|---|
| Aerospace / Defense | 4 | $236B |
|
||
| Technology / Defense | 3 | $32B |
|
||
| Financial Services | 2 | $176B |
|
||
| Utilities | 2 | $27B |
|
||
| Insurance | 2 | $25B |
|
||
| Technology | 2 | $15B |
|
||
Price history
-2.5% since first listed3 events — show timeline
- 2026-02-05 Relisted — NRVMLS
- 2025-11-21 Price Changed $389,000 NRVMLS
- 2025-06-26 Listed $399,000 NRVMLS
Property tax history
+2.7%/yrLatest (2025): $2,154 · +1.3% YoY. Source: county tax records.
Cash-flow waterfall
monthlySold comps — $/sqft
last 12 mo · ≤1 miLoading sold comps…