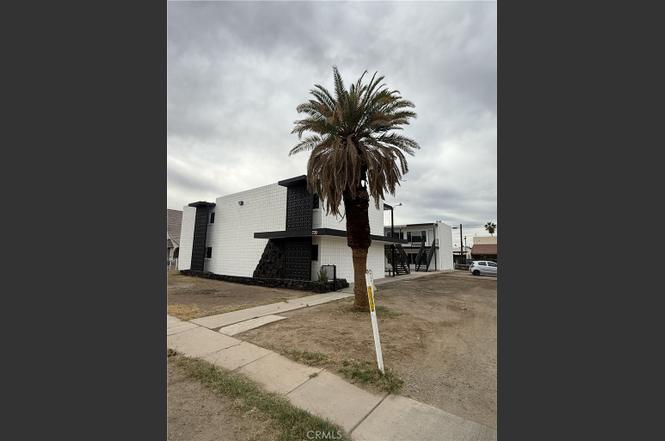
 12-Plex
730 W Olive · El Centro, CA
Flood risk 1/10 · Minimal
- FEMA flood zone
- X (unshaded)
- Chance of flooding over 30 yrs
- 0.0%
- Est. flood insurance / yr
- $507 – $1,088
Fire risk 4/10 · Minor
- Est. fire insurance / yr
- $659 – $1,223
Heat risk 10/10 · Severe
- Hot days now (above 114°F)
- 7 days/yr
- Hot days in 30 yrs
- 20 days/yr
Wind risk 1/10 · Minimal
- Chance of severe wind over 30 yrs
- —
Air-quality risk 3/10 · Minor
- Unhealthy air days now
- 2 days/yr
- Unhealthy air days in 30 yrs
- 3 days/yr
Risk factors via First Street. Map © Google.
Why this score? — see what drove the C- grade
The composite is a weighted blend of 9 inputs, each scored 0–100. Each bar is that input's sub-score; the figure is the points it added to the 100-point composite (weight × sub-score).
- Cash flow +21.5/30.0
- ARV discount +7.5/15.0
- DSCR +6.9/10.0
- 1% rule +4.5/10.0
- Livability +3.6/5.0
- Schools +3.5/10.0
- Rent growth +2.5/5.0
- Condition / age +2.5/5.0
- Appreciation +0.0/10.0
$1,499,000
🖨 Deal sheet (PDF) 📄 Offer letter ✓ Due diligence
Multi-family units
County records classify this as Multi-Family (5+ Unit). Listing-text estimate: 12 units. confirmed
5+ unit building — per-unit beds/baths from public records are typically unavailable; the breakdown below (if shown) is an estimate from the listing text.
Listing remarks MLS
Prime Investment Opportunity in El Centro! Unlock the potential of these 12 income-generating units located in the heart of El Centro. This property features a mix of 10 one-bedroom, one-bath units and 2 studio apartments, all with excellent rental income potential. While the units require some work, they offer an exciting opportunity to increase their value and attract long-term tenants. With a desirable location and proximity to local amenities, this property is perfect for investors looking to make their mark in a vibrant community. Don't miss out on this opportunity to enhance your real estate portfolio.
Key facts
- Upgraded plumbing
- New kitchen cabinets
- New appliances
Tags
Property features AI
Finance
- Other: Lot described as 0–1 unit per acre; Lot size source: public records; Elevation measured in feet; Property has no common walls between units
- Financial info: Total of 12 units; Gross scheduled income approximately $172,800; Gross income approximately $172,800; Net operating income approximately $172,800; One building; One separate water meter, one separate gas meter, one separate electric meter; Total building area approximately 7,149
- HOA & community: Suburban neighborhood
Exterior
- Parking:
- Security:
- Utilities: Public sewer; District/public water
- Home design: Two-story building; No accessory dwelling unit (ADU)
- Construction: Built year from public records
- Exterior features: No pool
Interior
- Kitchen:
- Bedrooms: Multiple 1-bedroom units (unit counts listed below)
- Flooring:
- Bathrooms: All units have one full bathroom
- Heating & cooling: Ductless cooling
- Interior features: Two-level layout; Entry on level 1
- Laundry & utility: On-site community laundry
Neighborhood map
What this means for you Summary
Snapshot
- This is a 10×1bd/1.0ba + 2×?bd/1.0ba units multifamily listed at $1.50M.
Deal economics
- At list price, monthly cash flow is $2k ($27k/yr) — positive. Per door: $189/mo.
- The deal already cash-flows at list — no discount required.
- To meet the 1% rule (rent ≥ 1% of price), the offer needs to be $1.42M (5.4% below list).
- Recommended offer: $1.41M (6.0% below list) — sets the bar for market timing.
- Cap rate 8.1% vs local median 3.1% in El Centro — top-decile yield for the area; either an underpriced asset or a hidden risk that comps aren't pricing in. Stress-test before assuming the spread holds.
Location & tenants
- Location reads 71/100 on livability (#214 in CA) — a middle-class / working-renter tenant base. Strengths: amenities A+, commute A+, housing A+; Watch: cost of living D+, employment F.
- El Centro Elementary (urban): math 33% / reading 45% proficiency, ranked #803 of 1,400 in CA (top 57%) — families likely to look elsewhere, expect single-tenant / working-renter base with shorter leases; 69% free/reduced lunch — lower-income household profile, screen leases tightly.
- Zoned schools: Lincoln Elementary (421 students, 86% FRL); Kennedy Middle (459 students, 88% FRL); Central Union High (math 21% / reading 63%, grade F, #472 of 1,170 statewide, top 42%, 1,957 students, 77% FRL).
- Market conditions: 122 active listings in the ZIP; 271 units permitted in Imperial County in 2024 (112 in 5+ unit buildings).
- At $14,186/mo this rent would consume 309% of the median local household income ($55k/yr) (locally 1683% of renters already pay >50% of income on rent) — very limited rent-growth headroom before tenants either downsize or default.
Forward outlook
- Local home prices are declining (-3.0%/yr); year-one equity from $10k of loan paydown is wiped out by about $45k of value loss. Plan a longer hold.
- Imperial County population projected at +7% by 2050 — modest demand growth; plan on rents tracking national, not racing it.
Negotiation context
- It's been on market 89 days — a 6% lower offer ($1.41M) is reasonable based on typical stale-listing flexibility.
- 2 sale attempts with the ask held roughly flat each time — persistent listings suggest the price (not the market) is what's stuck; bring a comps-based counter.
- Current owner paid $850k; list at $1.50M implies a 76% gain — meaningful room to come down on a strong offer.
Risks & watch-outs
- Climate carrying-cost: extreme-heat days projected 7→20/yr by 2055 (HVAC capex compounding) — expect insurance premiums to compound above CPI over the hold.
Questions for the listing agent
- It's been on market 89 days. Have you received any prior offers? Is the seller open to a 6% concession, seller financing, or rate buy-down credit?
- Can we see the unit-by-unit rent roll, current vacancy, and any below-market leases? What's the average tenancy length?
- What capital expenditures (roof, boiler, parking lot, exteriors) have been made in the last 5 years, and what's planned in the next 2?
- Built in 1963 — when were the roof, HVAC, electrical panel, plumbing, and water heater last replaced?
- Why hasn't it sold? Are there any deal-killer items the seller is aware of (foundation, flood, title, zoning, code violations)?
- Is there a deadline driving the sale (1031 exchange, divorce, estate, relocation)? That informs how much negotiation room exists.
- Schools are D-rated, which usually means shorter tenancies and higher turnover. Who's the typical renter profile here, and what's been the actual vacancy rate?
- What's the average days-on-market for RENTAL listings here right now (not sales)? A rising rental-DOM trend means longer vacancies and softer asking-rent achievability than the comps imply.
- What's the recent tenant-quality profile in this submarket — average credit score on applications, eviction rate, late-payment / NSF rate, and stable-employment percentage? A property-management company in the area should have these aggregated.
- How much new apartment / multifamily construction is in the pipeline within 1–3 miles? Heavy new supply (>2% of stock underway) typically softens rents 12–24 months out; light construction supports rent growth.
Investment metrics
- 1% rule
- 0.95% ✗
- Cap rate
- 8.10%
- Cash-on-cash
- 6.47%
- DSCR
- 1.29
- GRM
- 8.8
CMA / ARV
No comps found within radius.
Projected returns pro-forma
-3.0% appreciation · 3.0% rent growth · sell at horizon
- IRR
- -6.4%
- Equity multiple
- 0.76×
- Total profit
- $-99,484
- Equity at exit
- $223,506
- IRR
- 3.2%
- Equity multiple
- 1.23×
- Total profit
- $96,227
- Equity at exit
- $129,606
Cash invested: $419,720 (down + closing). Projections, not guarantees.
Landlord ↔ Tenant lean methodology
- Overall (STATE)
- 18 Strongly Tenant-Friendly
- State California
- 18 Strongly Tenant-Friendly · D+13
- County
- — inherits STATE
- City
- — inherits STATE
ZIP-level market 92243
- Home prices YoY
- -30.1%
- Active inventory
- 122
- Price-to-rent
- 105.7×
Monthly cashflow live
- Estimated rent
- $14,186 high interval (Pro) →
- Mortgage (P&I)
- −$7,861
- Tax from tax record
- −$459 /mo · $5,512/yr
- Insurance
- −$625
- HOA
- −$0
- Vacancy / Maint / Mgmt
- −$2,979
- Net cashflow
- $2,262
Break-even live
Sensitivity live
| Price | -10% $3,111 | -5% $2,686 | +0% $2,262 | +5% $1,838 | +10% $1,414 |
|---|---|---|---|---|---|
| Rent | -10% $1,141 | -5% $1,702 | +0% $2,262 | +5% $2,822 | +10% $3,383 |
| Rate | -1.0pp $3,017 | -0.5pp $2,643 | base $2,262 | +0.5pp $1,874 | +1.0pp $1,478 |
12-unit breakdown (identical units grouped — click to expand)
| Units | Beds | Baths | Est. rent |
|---|---|---|---|
| 10× units | 1 | 1 | $11,820 |
| #1 | 1 | 1 | $1,182 |
| #2 | 1 | 1 | $1,182 |
| #3 | 1 | 1 | $1,182 |
| #4 | 1 | 1 | $1,182 |
| #5 | 1 | 1 | $1,182 |
| #6 | 1 | 1 | $1,182 |
| #7 | 1 | 1 | $1,182 |
| #8 | 1 | 1 | $1,182 |
| #9 | 1 | 1 | $1,182 |
| #10 | 1 | 1 | $1,182 |
| 2× units | 0 | 1 | $2,364 |
| #11 | 0 | 1 | $1,182 |
| #12 | 0 | 1 | $1,182 |
| Total (12 units) | $14,186 | ||
UW: 25.0% down · 7.5% · 30yr · 1.5% tax · 5.0% vac · 8.0% maint · 8.0% mgmt
Financing live
Cash to close
- Down payment
- $374,750
- Closing costs
- $44,970
- Reserves months
- —
- Total cash needed
- —
Loan-product check · same deal, 3 products live
Conventional
25% down · 7.5% · 30yr
- Down + closing
- —
- Monthly P&I
- —
- Monthly cashflow
- —
- DSCR
- —
- Eligible?
- —
Personal DTI + credit; lowest rate.
DSCR
20% down · 8.5% · 30yr
- Down + closing
- —
- Monthly P&I
- —
- Monthly cashflow
- —
- DSCR
- —
- Eligible?
- —
No personal income docs; deal must DSCR.
Hard money
10% down · 12.0% · 12mo
- Down + closing
- —
- Monthly P&I
- —
- Monthly cashflow
- —
- DSCR
- —
- Eligible?
- —
Short-term bridge; refi at stabilization.
Listing history 11 events
-
2026-06-03days on market $1,499,000 Active 89 DOM
-
2026-06-02days on market $1,499,000 Active 88 DOM
-
2026-06-01days on market $1,499,000 Active 87 DOM
-
2026-05-31days on market $1,499,000 Active 86 DOM
-
2026-05-30days on market $1,499,000 Active 85 DOM
-
2026-03-06$1,499,000 Active
-
2025-08-05soldstatus $850,000 Closed 615-char remark
Show marketing remark (615 chars)
Prime Investment Opportunity in El Centro! Unlock the potential of these 12 income-generating units located in the heart of El Centro. This property features a mix of 10 one-bedroom, one-bath units and 2 studio apartments, all with excellent rental income potential. While the units require some work, they offer an exciting opportunity to increase their value and attract long-term tenants. With a desirable location and proximity to local amenities, this property is perfect for investors looking to make their mark in a vibrant community. Don't miss out on this opportunity to enhance your real estate portfolio.
-
2025-08-05soldstatus $850,000
Show marketing remark (615 chars)
Prime Investment Opportunity in El Centro! Unlock the potential of these 12 income-generating units located in the heart of El Centro. This property features a mix of 10 one-bedroom, one-bath units and 2 studio apartments, all with excellent rental income potential. While the units require some work, they offer an exciting opportunity to increase their value and attract long-term tenants. With a desirable location and proximity to local amenities, this property is perfect for investors looking to make their mark in a vibrant community. Don't miss out on this opportunity to enhance your real estate portfolio.
-
2025-06-16historical Active Under Contract 615-char remark
Show marketing remark (615 chars)
Prime Investment Opportunity in El Centro! Unlock the potential of these 12 income-generating units located in the heart of El Centro. This property features a mix of 10 one-bedroom, one-bath units and 2 studio apartments, all with excellent rental income potential. While the units require some work, they offer an exciting opportunity to increase their value and attract long-term tenants. With a desirable location and proximity to local amenities, this property is perfect for investors looking to make their mark in a vibrant community. Don't miss out on this opportunity to enhance your real estate portfolio.
-
2025-06-08$749,900 Active 615-char remark
Show marketing remark (615 chars)
Prime Investment Opportunity in El Centro! Unlock the potential of these 12 income-generating units located in the heart of El Centro. This property features a mix of 10 one-bedroom, one-bath units and 2 studio apartments, all with excellent rental income potential. While the units require some work, they offer an exciting opportunity to increase their value and attract long-term tenants. With a desirable location and proximity to local amenities, this property is perfect for investors looking to make their mark in a vibrant community. Don't miss out on this opportunity to enhance your real estate portfolio.
-
2004-01-05soldstatus $330,000
ⓘ Source: listings_history table (triggers on properties + properties_extension) + one-shot
backfill from property_details.listing_events for pre-trigger history.
Tax reassessment forecast CA · Resets to sale price
- Current annual tax
- $5,512 · $459/mo
- Projected year-2 tax
- $11,392 · $949/mo
- Expected delta
- +$5,880/yr (+$490/mo · 106.7%)
ⓘ Screening estimate from a state-policy table — verify with the county assessor before closing.
Climate risk First Street
- Flood 1/10 Low FEMA zone X (unshaded) · 0% chance over 30 yrs
- Wildfire 4/10 Moderate
- Heat 10/10 Extreme 7 d/yr ≥114°F today · 20 d/yr by 30 yrs out
- Wind 1/10 Low
- Air quality 3/10 Moderate 2 unhealthy d/yr today · 3 by 30 yrs out
Nearby sold comps map
Loading sold comps map…
Walkable amenities ~0.75 mi
Loading nearby amenities…
Taxation est. · year 1
- Rental income
- $170,232
- − Mortgage interest
- −$83,967
- − Property taxes
- −$5,512
- − Insurance
- −$7,495
- − Repairs & maintenance
- −$13,619
- − Management
- −$13,619
- − Depreciation
- −$43,607
- Taxable income
- $2,413
- Est. tax owed @ 24.0%
- −$579
- After-tax cash flow
- $26,566/yr
For passive investors: Depreciation is non-cash, so a rental often shows a tax loss while cash-flowing — sheltering income. Rental losses are passive: they offset passive income freely, and up to $25,000/yr can offset ordinary (W-2) income if you actively participate and your MAGI is under $100k (phasing out to $0 by $150k); unused losses carry forward. On sale, claimed depreciation is recaptured at up to 25%, and gains may owe capital-gains tax (a 1031 exchange can defer both). Figures are a year-1 estimate at your 24.0% rate — not tax advice; consult a CPA.
Schools (NCES district)
- District
- El Centro Elementary
- NCES district ID
- 0612030
- Math proficiency
- 33% ▲ 3.00%
- Reading proficiency
- 45% ▲ 2.00%
- Median HH income
- $37,357
- Composite
- 34.9/100
- National rank
- #9987
- State rank
- #803 of 1400 in CA
Livability — El Centro
- Score
- 71/100
- State rank
- #214
- US rank
- #6804
Category grades
Schools grade is shown separately in the Schools card above.
Census & demographics
- Census place
- El Centro, CA
- County
- Imperial County · 104,838 people
- City population
- 49,069
- Metro
- El Centro, CA
- Population (ZIP)
- 49,069
- Household income
- $55,057
- Rent vs Own
- Severe rent burden
- 1683.0
Population outlook (Imperial County) Hauer SSP2
- Today (2025)
- 186,713 people
- By 2030
- 190,022 · +1.8%
- By 2040
- 195,993 · +5.0%
- By 2050
- 199,534 · +6.9%
- By 2075
- 216,878 · +16.2%
- By 2100
- 352,705 · +88.9%
Race, ethnicity, and origin ACS 2023
- Neighborhood character
- Predominantly Hispanic (85%)
- Race & ethnicity
- Hispanic / Latino 85% Two or more races 24% White 9% Black 4%
- Hispanic origin (detail)
- Mexican 81%
- Common ancestry
- Lithuanian 1%
- Foreign-born
- 29% · Canada
- Languages at home
- 25% English-only · Spanish 74%
Political lean MEDSL · Imperial
- 2024 margin
- Toss-up / Even · D 48.3% · R 49.1% · Other 2.6%
- 2008→2024 swing
- -27.0pp toward R · 2008: 26.2pp · 2024: -0.9pp
- All cycles
- 2024: R+0.9 2020: D+24.4 2016: D+41.1 2012: D+28.8 2008: D+26.2
Not yet ingested
- Civics
- —
Market trends
- HPI YoY
- ▼ -156.41%
- Current HPI
- 362.4044
- Rent YoY
- —
- Metro
- El Centro, CA
- State GDP YoY
- ▲ 3.21%
- F500 in state
- 116
Industry mix (Fortune 500 HQ in CA)
| Industry | F500 HQs | Revenue |
|---|---|---|
| Technology | 27 | $1,492B |
|
||
| Financial Services | 3 | $174B |
|
||
| Retail | 3 | $44B |
|
||
| Insurance | 3 | $26B |
|
||
| Media / Entertainment | 2 | $115B |
|
||
| Pharmaceuticals / Biotech | 2 | $62B |
|
||
Price history
+354.2% since first listed6 events — show timeline
- 2026-03-06 Listed $1,499,000 CRMLS
- 2025-08-05 Sold (Public Records) $850,000 Public Records
- 2025-08-05 Sold (MLS) $850,000 ICAOR
- 2025-06-16 Contingent — ICAOR
- 2025-06-08 Listed $749,900 ICAOR
- 2004-01-05 Sold (Public Records) $330,000 Public Records
Property tax history
+1.9%/yrLatest (2025): $5,512 · +5.0% YoY. Source: county tax records.
Cash-flow waterfall
monthlySold comps — $/sqft
last 12 mo · ≤1 miLoading sold comps…