 Multi-family
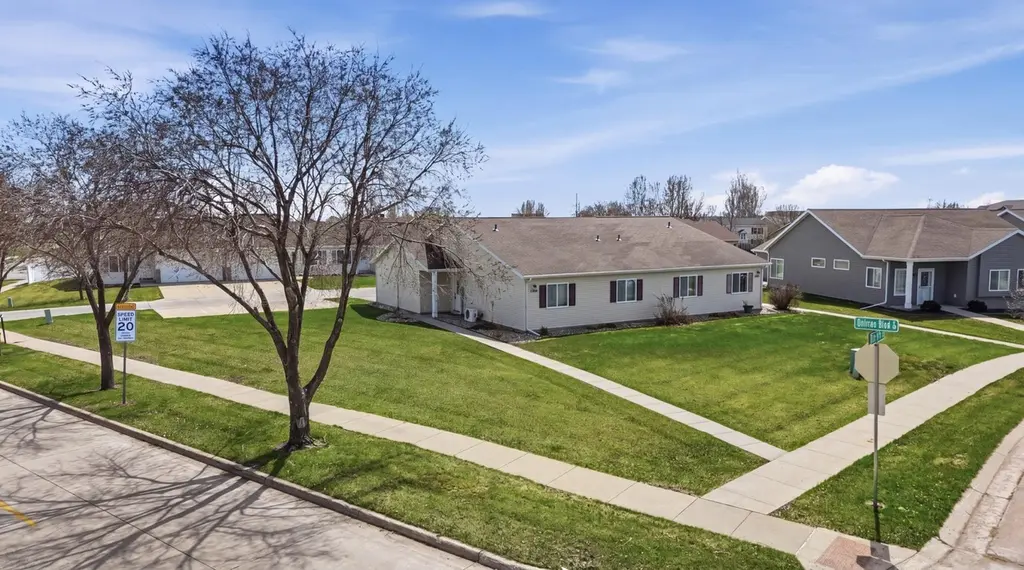
2108 57th Ave S · Fargo, ND
Flood risk 1/10 · Minimal
- FEMA flood zone
- X (shaded)
- Chance of flooding over 30 yrs
- 0.0%
- Est. flood insurance / yr
- $473 – $860
Fire risk 1/10 · Minimal
- Est. fire insurance / yr
- $1,289 – $2,393
Heat risk 2/10 · Minimal
- Hot days now (above 98°F)
- 7 days/yr
- Hot days in 30 yrs
- 12 days/yr
Wind risk 2/10 · Minimal
- Chance of severe wind over 30 yrs
- —
Air-quality risk 3/10 · Minor
- Unhealthy air days now
- 3 days/yr
- Unhealthy air days in 30 yrs
- 3 days/yr
Risk factors via First Street. Map © Google.
Why this score? — see what drove the D grade
The composite is a weighted blend of 9 inputs, each scored 0–100. Each bar is that input's sub-score; the figure is the points it added to the 100-point composite (weight × sub-score).
- Cash flow +12.3/30.0
- ARV discount +7.5/15.0
- Livability +4.2/5.0
- Rent growth +3.8/5.0
- DSCR +3.6/10.0
- Schools +3.6/10.0
- 1% rule +3.2/10.0
- Condition / age +2.5/5.0
- Appreciation +0.0/10.0
$255,000
🖨 Deal sheet (PDF) 📄 Offer letter ✓ Due diligence
Multi-family units
County records classify this as Multi-Family (2-4 Unit). Listing-text estimate: 1 unit. estimate disagrees with records
Listing remarks MLS
One level living in south Fargo. Open floor plan with a spacious living room and eat in kitchen. 2 bedrooms, 1 bathroom, and laundry with no step living. 2 car garage with a work shop. HOA covers snow and lawn.
Key facts
- Ample cabinetry
- Updated flooring
- Open-concept layout
Tags
Property features AI
Finance
- Financial info: Conventional financing available
- HOA & community: Homeowner association managed by Personal Touch Property Management; Monthly association fee of $140; HOA covers lawn care and snow removal; Association amenities include patio
Exterior
- Parking: Attached garage with 2 parking spaces (garage approx. 17.5 x 16.5, includes additional shop area)
- Utilities: City water (connected); City sewer (connected); Electric fuel
- Home design: Residential attached property; One story; Entry and all main living areas on main level
- Construction: 980 above-grade finished area; Foundation: Other
- Exterior features: Vinyl exterior; Patio; Lot approximately 0.215 acres (dimensions 45 x 101)
Interior
- Kitchen: Dishwasher; Range; Microwave; Refrigerator
- Bedrooms: 2 bedrooms (both on main level)
- Bathrooms: 1 full bathroom (main level)
- Heating & cooling: Baseboard heating; Ductless mini-split heating and cooling
- Interior features: Vaulted ceiling(s); Eat-in kitchen; Patio
- Laundry & utility: Washer; Dryer; Laundry room on main level
Neighborhood map
What this means for you Summary
Snapshot
- This is a 2-bed/1.0-bath multifamily listed at $255k.
Deal economics
- At list price, monthly cash flow is $-49 ($-582/yr) — negative.
- To cash-flow at today's rent, offer at most $246k (3.4% below list).
- To meet the 1% rule (rent ≥ 1% of price), the offer needs to be $209k (18.0% below list).
- Recommended offer: $209k (18.0% below list) — sets the bar for 1% rule.
- Cap rate 6.1% vs local median 2.5% in Fargo — top-decile yield for the area; either an underpriced asset or a hidden risk that comps aren't pricing in. Stress-test before assuming the spread holds.
Location & tenants
- Location reads 85/100 on livability (#1 in ND, #605 nationally) — a professional / high-income tenant draw. Strengths: amenities A+, commute A+, cost of living A+; Watch: crime F.
- Fargo 1 (urban): math 41% / reading 44% proficiency, ranked #28 of 53 in ND (top 53%) — families likely to look elsewhere, expect single-tenant / working-renter base with shorter leases.
- Zoned schools: Bennett Elementary School (math 64% / reading 59%, grade B, #18 of 236 statewide, top 7%, 666 students, 21% FRL); Discovery Middle School (math 49% / reading 55%, grade C+, #3 of 35 statewide, top 12%, 975 students, 26% FRL); Fargo Davies High School (math 34% / reading 45%, grade F, #57 of 144 statewide, top 48%, 1,363 students, 19% FRL) — zoned schools at 22% FRL track the district average.
- Market conditions: Rents rising fast (+5.1%/yr); 369 active listings in the ZIP; 12 comparable units currently listed for rent nearby; rentals at typical pace (median 23d on market — plan ~3-4 weeks tenant-placement turnaround); solid renter incomes; 1,218 units permitted in Cass County in 2024 (410 in 5+ unit buildings).
Forward outlook
- Local home prices are declining (-3.0%/yr); year-one equity from $2k of loan paydown is wiped out by about $8k of value loss. Plan a longer hold.
- Cass County population projected at +69% by 2050 — long-run rental-demand tailwind backs the buy-and-hold thesis.
Negotiation context
- Only 12 days on market — expect competitive offers; lowballing is unlikely to land.
- 3 sale attempts since 4y ago with the ask held roughly flat each time — persistent listings suggest the price (not the market) is what's stuck; bring a comps-based counter.
- Current owner paid $175k; 46% above their basis — modest negotiation headroom, anchor on the comps not their cost.
Questions for the listing agent
- What do current leases actually rent for vs. the listed asking? Can we see a recent rent roll and the last 12 months of T-12 income?
- What does the HOA fee cover, when was the last increase, and are there any pending special assessments or reserve-fund shortfalls?
- Is there a deadline driving the sale (1031 exchange, divorce, estate, relocation)? That informs how much negotiation room exists.
- Crime grade is F in this area — have there been break-ins, vandalism, or insurance claims at this property in the last 3 years? What carrier currently insures it and at what premium?
- The area grade is low — what's the realistic commute time and amenity access for the typical tenant pool here? Any planned neighborhood developments (good or bad) we should know about?
- What's the average days-on-market for RENTAL listings here right now (not sales)? A rising rental-DOM trend means longer vacancies and softer asking-rent achievability than the comps imply.
- What's the recent tenant-quality profile in this submarket — average credit score on applications, eviction rate, late-payment / NSF rate, and stable-employment percentage? A property-management company in the area should have these aggregated.
- How much new apartment / multifamily construction is in the pipeline within 1–3 miles? Heavy new supply (>2% of stock underway) typically softens rents 12–24 months out; light construction supports rent growth.
Investment metrics
- 1% rule
- 0.82% ✗
- Cap rate
- 6.06%
- Cash-on-cash
- -0.82%
- DSCR
- 0.96
- GRM
- 10.2
CMA / ARV
No comps found within radius.
Projected returns pro-forma
-3.0% appreciation · 5.13% rent growth · sell at horizon
- IRR
- -15.4%
- Equity multiple
- 0.44×
- Total profit
- $-39,844
- Equity at exit
- $38,021
- IRR
- -3.7%
- Equity multiple
- 0.73×
- Total profit
- $-19,096
- Equity at exit
- $22,048
Cash invested: $71,400 (down + closing). Projections, not guarantees.
Landlord ↔ Tenant lean methodology
- Overall (STATE)
- 82 Strongly Landlord-Friendly
- State North Dakota
- 82 Strongly Landlord-Friendly · R+20
- County
- — inherits STATE
- City
- — inherits STATE
ZIP-level market 58104
- Home prices YoY
- -29.6%
- Rents YoY
- 5.1%
- Active inventory
- 369
- Price-to-rent
- 20.3×
Monthly cashflow live
- Estimated rent
- $2,090 medium interval (Pro) →
- Mortgage (P&I)
- −$1,337
- Tax from tax record
- −$116 /mo · $1,393/yr
- Insurance
- −$106
- HOA
- −$140
- Vacancy / Maint / Mgmt
- −$439
- Net cashflow
- $-49
Break-even live
Sensitivity live
| Price | -10% $96 | -5% $24 | +0% $-49 | +5% $-121 | +10% $-193 |
|---|---|---|---|---|---|
| Rent | -10% $-214 | -5% $-131 | +0% $-49 | +5% $34 | +10% $117 |
| Rate | -1.0pp $80 | -0.5pp $16 | base $-49 | +0.5pp $-115 | +1.0pp $-182 |
2-unit breakdown (identical units grouped — click to expand)
| Units | Beds | Baths | Est. rent |
|---|---|---|---|
| 2× units | 2 | 1 | $2,090 |
| #1 | 2 | 1 | $1,045 |
| #2 | 2 | 1 | $1,045 |
| Total (2 units) | $2,090 | ||
UW: 25.0% down · 7.5% · 30yr · 1.5% tax · 5.0% vac · 8.0% maint · 8.0% mgmt
Financing live
Cash to close
- Down payment
- $63,750
- Closing costs
- $7,650
- Reserves months
- —
- Total cash needed
- —
Loan-product check · same deal, 3 products live
Conventional
25% down · 7.5% · 30yr
- Down + closing
- —
- Monthly P&I
- —
- Monthly cashflow
- —
- DSCR
- —
- Eligible?
- —
Personal DTI + credit; lowest rate.
DSCR
20% down · 8.5% · 30yr
- Down + closing
- —
- Monthly P&I
- —
- Monthly cashflow
- —
- DSCR
- —
- Eligible?
- —
No personal income docs; deal must DSCR.
Hard money
10% down · 12.0% · 12mo
- Down + closing
- —
- Monthly P&I
- —
- Monthly cashflow
- —
- DSCR
- —
- Eligible?
- —
Short-term bridge; refi at stabilization.
Rent comps 12 comps
| Address | Beds | Baths | Sqft | Rent | $/sqft | DOM | Units | Dist |
|---|---|---|---|---|---|---|---|---|
| 5450 26th St S Fargo, ND | 1.0–3.0 | 1.0–2.0 | 1111 | $1,325 | $1.19 | 15d | 10 | 0.33mi |
| 2465 62nd Ave S Unit 100 Fargo, ND | 2.0 | 2.0 | 1038 | $1,700 | $1.64 | 23d | 1 | 0.36mi |
| 2465 62nd Ave S Unit 105 Fargo, ND | 2.0 | 2.0 | 1087 | $1,665 | $1.53 | 23d | 1 | 0.36mi |
| 2465 62nd Ave S Unit 314 Fargo, ND | 1.0 | 1.0 | 710 | $1,365 | $1.92 | 23d | 1 | 0.36mi |
| 2465 62nd Ave S Unit 109 Fargo, ND | 1.0 | 1.0 | 748 | $1,340 | $1.79 | 23d | 1 | 0.36mi |
| 2465 62nd Ave S Unit 300 Fargo, ND | 2.0 | 2.0 | 1038 | $1,725 | $1.66 | 23d | 1 | 0.36mi |
| 5354 26th St S Unit 5354-318 Fargo, ND | 1.0 | 1.0 | 950 | $1,600 | $1.68 | 23d | 1 | 0.41mi |
| 2400 65th Ave S Fargo, ND | 1.0–2.0 | 1.0–2.0 | 863 | $1,295 | $1.50 | 15d | 13 | 0.65mi |
| 3243 67th Ave S Fargo, ND | 1.0–4.0 | 1.0–2.0 | 1239 | $1,995 | $1.61 | 15d | 35 | 0.93mi |
| 3760 55th Ave S Fargo, ND | 3.0 | 1.0–2.0 | 910 | $1,613 | $1.77 | 15d | 37 | 1.35mi |
| 5800 38th St S Fargo, ND | 3.0 | 1.0–2.0 | 1005 | $1,695 | $1.69 | 15d | 40 | 1.35mi |
| 5624 Tillstone Dr S Fargo, ND | 2.0 | 1.0–2.0 | 797 | $1,810 | $2.27 | 15d | 18 | 1.38mi |
HOA detail
- Monthly dues
- $140 · $1,680/yr
Listing history 8 events
-
2026-05-07status Pending
-
2026-04-30historical Contingent - Inspection
-
2026-04-25$255,000 Active
-
2026-04-25historical
-
2026-04-24$255,000 Active
-
2022-04-19soldstatus $175,000
-
2022-04-15soldstatus $175,000 211-char remark
Show marketing remark (211 chars)
One level living in south Fargo. Open floor plan with a spacious living room and eat in kitchen. 2 bedrooms, 1 bathroom, and laundry with no step living. 2 car garage with a work shop. HOA covers snow and lawn.
-
2022-02-25$175,000 211-char remark
Show marketing remark (211 chars)
One level living in south Fargo. Open floor plan with a spacious living room and eat in kitchen. 2 bedrooms, 1 bathroom, and laundry with no step living. 2 car garage with a work shop. HOA covers snow and lawn.
ⓘ Source: listings_history table (triggers on properties + properties_extension) + one-shot
backfill from property_details.listing_events for pre-trigger history.
Tax reassessment forecast ND · Resets to sale price
- Current annual tax
- $1,393 · $116/mo
- Projected year-2 tax
- $2,499 · $208/mo
- Expected delta
- +$1,106/yr (+$92/mo · 79.3%)
ⓘ Screening estimate from a state-policy table — verify with the county assessor before closing.
Climate risk First Street
- Flood 1/10 Low FEMA zone X (shaded) · 0% chance over 30 yrs
- Wildfire 1/10 Low
- Heat 2/10 Low 7 d/yr ≥98°F today · 12 d/yr by 30 yrs out
- Wind 2/10 Low
- Air quality 3/10 Moderate 3 unhealthy d/yr today · 3 by 30 yrs out
Nearby sold comps map
Loading sold comps map…
Walkable amenities ~0.75 mi
Loading nearby amenities…
Taxation est. · year 1
- Rental income
- $25,080
- − Mortgage interest
- −$14,284
- − Property taxes
- −$1,393
- − Insurance
- −$1,275
- − Repairs & maintenance
- −$2,006
- − Management
- −$2,006
- − HOA
- −$1,680
- − Depreciation
- −$7,418
- Taxable loss
- −$4,983
- Est. tax savings @ 24.0%
- +$1,196
- After-tax cash flow
- $614/yr
For passive investors: Depreciation is non-cash, so a rental often shows a tax loss while cash-flowing — sheltering income. Rental losses are passive: they offset passive income freely, and up to $25,000/yr can offset ordinary (W-2) income if you actively participate and your MAGI is under $100k (phasing out to $0 by $150k); unused losses carry forward. On sale, claimed depreciation is recaptured at up to 25%, and gains may owe capital-gains tax (a 1031 exchange can defer both). Figures are a year-1 estimate at your 24.0% rate — not tax advice; consult a CPA.
Schools (NCES district)
- District
- Fargo 1
- NCES district ID
- 3806780
- Math proficiency
- 41% ▼ -7.00%
- Reading proficiency
- 44% ▼ -7.00%
- Median HH income
- $46,524
- Composite
- 36.23/100
- National rank
- #4721
- State rank
- #28 of 53 in ND
Livability — Fargo
- Score
- 85/100
- State rank
- #1
- US rank
- #605
Category grades
Schools grade is shown separately in the Schools card above.
Census & demographics
- Census place
- Fargo, ND
- County
- Cass County · 177,143 people
- City population
- 130,876
- Metro
- Fargo, ND-MN
- Population (ZIP)
- 49,168
- Household income
- $85,747
- Rent vs Own
- Severe rent burden
- 2039.0
Population outlook (Cass County) Hauer SSP2
- Today (2025)
- 223,771 people
- By 2030
- 251,835 · +12.5%
- By 2040
- 311,816 · +39.3%
- By 2050
- 378,694 · +69.2%
- By 2075
- 571,386 · +155.3%
- By 2100
- 769,727 · +244.0%
Race, ethnicity, and origin ACS 2023
- Neighborhood character
- Predominantly White (83%)
- Race & ethnicity
- White 83% Black 7% Two or more races 5% Asian 4% Hispanic / Latino 2%
- Common ancestry
- Portuguese 27% Lithuanian 4% Romanian 2%
- Foreign-born
- 9% · Canada, China
- Languages at home
- 92% English-only · Korean 1% Spanish 1% Russian/Polish/Slavic 1%
Political lean MEDSL · Cass
- 2024 margin
- Lean R (+8.4) · D 44.9% · R 53.3% · Other 1.9%
- 2008→2024 swing
- -15.5pp toward R · 2008: 7.1pp · 2024: -8.4pp
- All cycles
- 2024: R+8.4 2020: R+2.7 2016: R+10.7 2012: R+3.0 2008: D+7.1
Not yet ingested
- Civics
- —
Market trends
- HPI YoY
- ▼ -78.58%
- Current HPI
- 187.1707
- Rent YoY
- ▲ 5.13%
- Metro
- Fargo, ND-MN
- State GDP YoY
- ▲ 2.09%
- F500 in state
- 2
Industry mix (Fortune 500 HQ in ND)
| Industry | F500 HQs | Revenue |
|---|---|---|
| Utilities / Construction | 1 | $6B |
|
||
Price history
+45.7% since first listed8 events — show timeline
- 2026-05-07 Pending — NORTHSTARMLS as Distributed by MLS Grid
- 2026-04-30 Contingent — NORTHSTARMLS as Distributed by MLS Grid
- 2026-04-25 Listing Removed — NORTHSTARMLS as Distributed by MLS Grid
- 2026-04-25 Listed $255,000 NORTHSTARMLS as Distributed by MLS Grid
- 2026-04-24 Listed $255,000 NORTHSTARMLS as Distributed by MLS Grid
- 2022-04-19 Sold (Public Records) $175,000 Public Records
- 2022-04-15 Sold (MLS) $175,000 NORTHSTARMLS as Distributed by MLS Grid
- 2022-02-25 Listed $175,000 NORTHSTARMLS as Distributed by MLS Grid
Property tax history
+10.2%/yrLatest (2025): $1,393 · -39.8% YoY. Source: county tax records.
Cash-flow waterfall
monthlySold comps — $/sqft
last 12 mo · ≤1 miLoading sold comps…