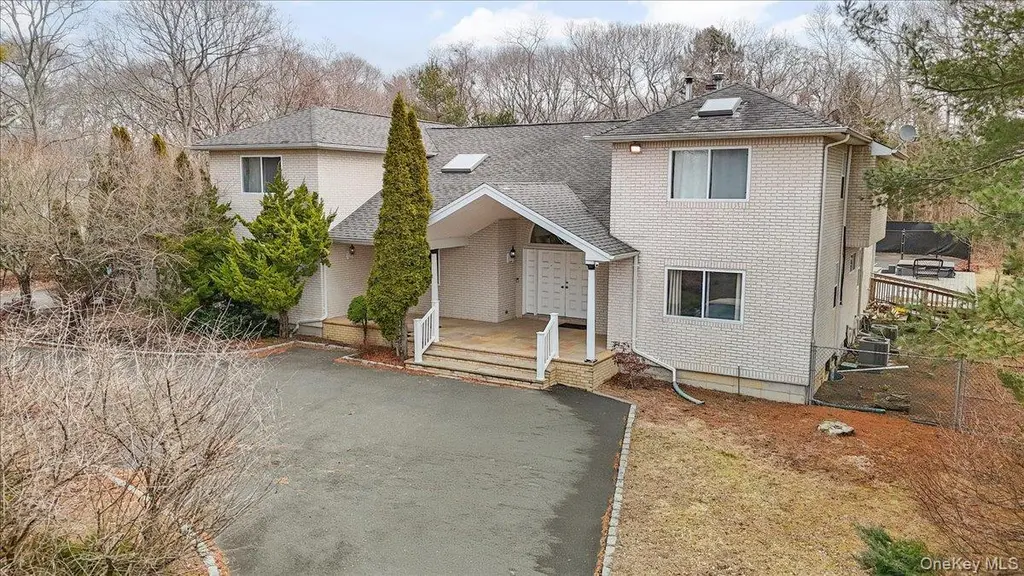
24 Wisteria Dr · Remsenburg-Speonk, NY
Flood risk 1/10 · Minimal
- FEMA flood zone
- X (unshaded)
- Chance of flooding over 30 yrs
- 0.0%
- Est. flood insurance / yr
- $473 – $860
Fire risk 1/10 · Minimal
- Est. fire insurance / yr
- $691 – $1,283
Heat risk 4/10 · Minor
- Hot days now (above 90°F)
- 6 days/yr
- Hot days in 30 yrs
- 17 days/yr
Wind risk 8/10 · Major
- Chance of severe wind over 30 yrs
- 80.0%
Air-quality risk 4/10 · Minor
- Unhealthy air days now
- 4 days/yr
- Unhealthy air days in 30 yrs
- 5 days/yr
Risk factors via First Street. Map © Google.
Why this score? — see what drove the A grade
The composite is a weighted blend of 9 inputs, each scored 0–100. Each bar is that input's sub-score; the figure is the points it added to the 100-point composite (weight × sub-score).
- Cash flow +30.0/30.0
- ARV discount +15.0/15.0
- 1% rule +10.0/10.0
- DSCR +10.0/10.0
- Appreciation +8.9/10.0
- Schools +4.8/10.0
- Rent growth +2.5/5.0
- Livability +2.5/5.0
- Condition / age +2.5/5.0
$1,450,000
🖨 Deal sheet 📄 Offer letter ✓ Due diligence
Listing remarks MLS
Discover this impressive 6-bedroom home in the charming hamlet of Remsenburg, just minutes from the beautiful Hampton beaches. Offering 3,899 sq. ft. of living space, the open floor plan features a bright living room with cathedral ceilings, a stunning fireplace, an eat-in kitchen, and a dining room—all overlooking a private backyard oasis. The spacious primary suite boasts two walk-in closets and a luxurious bath, complemented by five additional bedrooms, three baths, and a versatile loft area. Step outside to enjoy the heated 20x40 saltwater pool, expansive decking with a hot tub, and an all-weather tennis/basketball court—perfect for relaxation and recreation. Additional highlights include a 2-car garage, central air conditioning, a security system, central vacuum, and a sprinkler system. With a 2,100 sq. ft. plus basement ready for customization and low taxes in the desirable Remsenburg-Westhampton school district, this property is ideal as a summer getaway or a year-round retreat. 75 minutes from NYC.
Key facts
- Hot tub
- Versatile loft area
- Two walk in closets
Tags
Neighborhood map
What this means for you Summary
Snapshot
- This is a 6-bed/3.0-bath single-family listed at $1.45M.
Deal economics
- At list price, monthly cash flow is $11k ($137k/yr) — positive.
- The deal already cash-flows at list — no discount required.
- Meets the 1% rule at list price ($26k rent vs $1.45M).
- Recommended offer: $1.36M (6.0% below list) — sets the bar for market timing.
- Cap rate 15.7% vs local median 7.2% in Remsenburg-Speonk — top-decile yield for the area; either an underpriced asset or a hidden risk that comps aren't pricing in. Stress-test before assuming the spread holds.
Location & tenants
- Location reads: area grade A — affects rentability + tenant quality, not the cash-flow math above.
- Remsenburg-Speonk Union Free School District (suburban): math 60% / reading 40% proficiency, ranked #389 of 755 in NY (top 52%) — acceptable for families but not a draw, mixed tenant base, ~2y average lease; only 10% free/reduced lunch — higher-income household profile.
- Market conditions: 40 active listings in the ZIP; 2 comparable units currently listed for rent nearby; 1,366 units permitted in Suffolk County in 2024 (216 in 5+ unit buildings).
Forward outlook
- In year one you build about $123k of equity ($10k loan paydown + $113k appreciation (7.8% local appreciation)).
- Suffolk County population projected to shrink 5% by 2050 — rents likely to lag national; underwrite the cash flow, not the appreciation.
- At projected returns (7.8% appreciation + 3.0% rent growth), your $406k cash investment doubles in ~2 years — after that, you're playing with house money.
- By year 2, paydown + projected appreciation supports a ~$197k cash-out refi (75% LTV) — recoverable capital for the next deal without selling this one.
Negotiation context
- It's been on market 71 days — a 6% lower offer ($1.36M) is reasonable based on typical stale-listing flexibility.
- 5 sale attempts since 13y ago with the ask held roughly flat each time — persistent listings suggest the price (not the market) is what's stuck; bring a comps-based counter.
- Current owner paid $675k; list at $1.45M implies a 115% gain — meaningful room to come down on a strong offer.
Risks & watch-outs
- Climate carrying-cost: severe wind risk, 80% chance of damaging wind over 30y — expect insurance premiums to compound above CPI over the hold.
Questions for the listing agent
- It's been on market 71 days. Have you received any prior offers? Is the seller open to a 6% concession, seller financing, or rate buy-down credit?
- Why hasn't it sold? Are there any deal-killer items the seller is aware of (foundation, flood, title, zoning, code violations)?
- Is there a deadline driving the sale (1031 exchange, divorce, estate, relocation)? That informs how much negotiation room exists.
- What's the average days-on-market for RENTAL listings here right now (not sales)? A rising rental-DOM trend means longer vacancies and softer asking-rent achievability than the comps imply.
- What's the recent tenant-quality profile in this submarket — average credit score on applications, eviction rate, late-payment / NSF rate, and stable-employment percentage? A property-management company in the area should have these aggregated.
- How much new for-sale + rental construction is in the pipeline within 1–3 miles? Heavy new supply typically softens prices + rents 12–24 months out; constrained supply supports both.
Investment metrics
- 1% rule
- 1.80% ✓
- Cap rate
- 15.74%
- Cash-on-cash
- 33.75%
- DSCR
- 2.50
- GRM
- 4.6
CMA / ARV
- ARV (median comp)
- $2,615,309
- List price
- $1,450,000
- Delta
- -44.56%
- Verdict
- UNDERPRICED
- Comps
- 17 within 1.0 mi
Show comp detail 3 sales within ~0.75 mi
| Address | Dist | Beds/Ba | Sqft | Sold | Price | $/sf | Match |
|---|---|---|---|---|---|---|---|
| 29 Bridle Path | 0.34mi | 6/3.5 | 3,708 (-4%) | 7mo | $2,750,000 | $742 | 70 |
| 50A S Phillips Ave | 0.72mi | 5/3.0 (-1) | 3,934 (+2%) | 0mo | $1,900,000 | $483 | 58 |
| 21 Rogers Ln | 0.71mi | 5/5.0 (-1) | 3,978 (+3%) | 1mo | $2,325,000 | $584 | 48 |
Match score weights: distance 35% · size 25% · config 20% · recency 20%. Top-matched comps best support the ARV.
Projected returns pro-forma
7.81% appreciation · 3.0% rent growth · sell at horizon
- IRR
- 46.9%
- Equity multiple
- 4.22×
- Total profit
- $1,306,721
- Equity at exit
- $1,082,778
- IRR
- 42.3%
- Equity multiple
- 9.01×
- Total profit
- $3,250,263
- Equity at exit
- $2,131,593
Cash invested: $406,000 (down + closing). Projections, not guarantees.
Landlord ↔ Tenant lean methodology
- Overall (STATE)
- 15 Strongly Tenant-Friendly
- State New York
- 15 Strongly Tenant-Friendly · D+10
- County
- — inherits STATE
- City
- — inherits STATE
ZIP-level market 11960
- Home prices YoY
- 2.1%
- Active inventory
- 40
- Price-to-rent
- 4.6×
Monthly cashflow live
- Estimated rent
- $26,040 medium interval (Pro) →
- Mortgage (P&I)
- −$7,604
- Tax from tax record
- −$945 /mo · $11,339/yr
- Insurance
- −$604
- HOA
- −$0
- Vacancy / Maint / Mgmt
- −$5,468
- Net cashflow
- $11,418
Break-even live
UW: 25.0% down · 7.5% · 30yr · 1.5% tax · 5.0% vac · 8.0% maint · 8.0% mgmt
Financing live
Cash to close
- Down payment
- $362,500
- Closing costs
- $43,500
- Reserves months
- —
- Total cash needed
- —
Loan-product check · same deal, 3 products live
Conventional
25% down · 7.5% · 30yr
- Down + closing
- —
- Monthly P&I
- —
- Monthly cashflow
- —
- DSCR
- —
- Eligible?
- —
Personal DTI + credit; lowest rate.
DSCR
20% down · 8.5% · 30yr
- Down + closing
- —
- Monthly P&I
- —
- Monthly cashflow
- —
- DSCR
- —
- Eligible?
- —
No personal income docs; deal must DSCR.
Hard money
10% down · 12.0% · 12mo
- Down + closing
- —
- Monthly P&I
- —
- Monthly cashflow
- —
- DSCR
- —
- Eligible?
- —
Short-term bridge; refi at stabilization.
Rent comps 2 comps
| Address | Beds | Baths | Sqft | Rent | $/sqft | DOM | Units | Dist |
|---|---|---|---|---|---|---|---|---|
| 8 Sweetgrass Rd Westhampton, NY | 5.0 | 4.5 | 4050 | $13,000 | $3.21 | 1d | 1 | 1.37mi |
| 6 Bay Meadow Ln Westhampton, NY | 6.0 | 5.0 | 3500 | $40,000 | $11.43 | 43d | 1 | 1.39mi |
Listing history 20 events
-
2026-06-04status $1,450,000 Pending 71 DOM
-
2026-06-03days on market $1,450,000 Active 71 DOM
-
2026-06-02days on market $1,450,000 Active 70 DOM
-
2026-06-01days on market $1,450,000 Active 69 DOM
-
2026-05-31days on market $1,450,000 Active 68 DOM
-
2026-03-24$1,450,000 Active 1033-char remark
Show marketing remark (1033 chars)
Discover this impressive 6-bedroom home in the charming hamlet of Remsenburg, just minutes from the beautiful Hampton beaches. Offering 3,899 sq. ft. of living space, the open floor plan features a bright living room with cathedral ceilings, a stunning fireplace, an eat-in kitchen, and a dining room—all overlooking a private backyard oasis. The spacious primary suite boasts two walk-in closets and a luxurious bath, complemented by five additional bedrooms, three baths, and a versatile loft area. Step outside to enjoy the heated 20x40 saltwater pool, expansive decking with a hot tub, and an all-weather tennis/basketball court—perfect for relaxation and recreation. Additional highlights include a 2-car garage, central air conditioning, a security system, central vacuum, and a sprinkler system. With a 2,100 sq. ft. plus basement ready for customization and low taxes in the desirable Remsenburg-Westhampton school district, this property is ideal as a summer getaway or a year-round retreat. 75 minutes from NYC.
-
2025-11-20price $1,100,000
-
2025-03-31price $1,749,000
-
2025-03-18$1,899,000 Active
-
2020-04-27historical
-
2020-02-05price $949,000
-
2020-01-29price $999,000
-
2019-11-12price $1,100,000
-
2019-10-07$1,200,000 New
-
2016-12-05historical
-
2016-11-29$949,000 New
-
2014-02-21historical
-
2013-10-30$879,000
-
2000-08-22soldstatus $675,000
-
1998-09-29soldstatus $439,000
ⓘ Source: listings_history table (triggers on properties + properties_extension) + one-shot
backfill from property_details.listing_events for pre-trigger history.
Tax reassessment forecast NY · Partial reset (capped growth)
- Current annual tax
- $11,339 · $945/mo
- Projected year-2 tax
- $17,922 · $1,494/mo
- Expected delta
- +$6,583/yr (+$549/mo · 58.1%)
ⓘ Screening estimate from a state-policy table — verify with the county assessor before closing.
Climate risk First Street
- Flood 1/10 Low FEMA zone X (unshaded) · 0% chance over 30 yrs
- Wildfire 1/10 Low
- Heat 4/10 Moderate 6 d/yr ≥90°F today · 17 d/yr by 30 yrs out
- Wind 8/10 Severe 80% chance of damaging wind over 30 yrs
- Air quality 4/10 Moderate 4 unhealthy d/yr today · 5 by 30 yrs out
Nearby sold comps map
Loading sold comps map…
Walkable amenities ~0.75 mi
Loading nearby amenities…
Taxation est. · year 1
- Rental income
- $312,477
- − Mortgage interest
- −$81,223
- − Property taxes
- −$11,339
- − Insurance
- −$7,250
- − Repairs & maintenance
- −$24,998
- − Management
- −$24,998
- − Depreciation
- −$42,182
- Taxable income
- $120,487
- Est. tax owed @ 24.0%
- −$28,917
- After-tax cash flow
- $108,103/yr
For passive investors: Depreciation is non-cash, so a rental often shows a tax loss while cash-flowing — sheltering income. Rental losses are passive: they offset passive income freely, and up to $25,000/yr can offset ordinary (W-2) income if you actively participate and your MAGI is under $100k (phasing out to $0 by $150k); unused losses carry forward. On sale, claimed depreciation is recaptured at up to 25%, and gains may owe capital-gains tax (a 1031 exchange can defer both). Figures are a year-1 estimate at your 24.0% rate — not tax advice; consult a CPA.
Schools (NCES district)
- District
- Remsenburg-Speonk Union Free School District
- NCES district ID
- 3624420
- Math proficiency
- 60% ▲ 10.00%
- Reading proficiency
- 40% ▼ -10.00%
- Median HH income
- $79,972
- Composite
- 47.7/100
- National rank
- #4915
- State rank
- #389 of 755 in NY
Livability — Remsenburg-Speonk
No livability data for this city. (Only ~50 U.S. cities are tracked.)
Census & demographics
- Census place
- Remsenburg-Speonk, NY
- City population
- 1,346
- Population (ZIP)
- 1,037
Population outlook (Suffolk County) Hauer SSP2
- Today (2025)
- 1,505,262 people
- By 2030
- 1,498,318 · -0.5%
- By 2040
- 1,471,101 · -2.3%
- By 2050
- 1,424,848 · -5.3%
- By 2075
- 1,337,157 · -11.2%
- By 2100
- 1,217,720 · -19.1%
Race, ethnicity, and origin ACS 2023
- Neighborhood character
- Predominantly White (100%)
- Race & ethnicity
- White 100%
- Common ancestry
- Iranian 9% Romanian 8% Scotch-Irish 1%
- Foreign-born
- 3%
Political lean MEDSL · Suffolk
- 2024 margin
- Lean R (+10.0) · D 45.0% · R 55.0%
- 2008→2024 swing
- -16.0pp toward R · 2008: 6.0pp · 2024: -10.0pp
- All cycles
- 2024: R+10.0 2020: R+0.0 2016: R+8.2 2012: D+2.9 2008: D+6.0
Not yet ingested
- Civics
- —
Market trends
- HPI YoY
- ▲ 7.81%
- Current HPI
- 386.454
- Rent YoY
- —
- Metro
- —
- State GDP YoY
- ▲ 2.60%
- F500 in state
- 92
Industry mix (Fortune 500 HQ in NY)
| Industry | F500 HQs | Revenue |
|---|---|---|
| Financial Services | 10 | $950B |
|
||
| Consumer Goods | 9 | $162B |
|
||
| Insurance | 4 | $225B |
|
||
| Telecommunications | 2 | $144B |
|
||
| Pharmaceuticals | 2 | $112B |
|
||
| Media / Entertainment | 2 | $69B |
|
||
Price history
+230.3% since first listed15 events — show timeline
- 2026-03-24 Listed $1,450,000 OneKey® MLS as Distributed by MLS Grid
- 2025-11-20 Price Changed $1,100,000 OneKey® MLS as Distributed by MLS Grid
- 2025-03-31 Price Changed $1,749,000 OneKey® MLS as Distributed by MLS Grid
- 2025-03-18 Listed $1,899,000 OneKey® MLS as Distributed by MLS Grid
- 2020-04-27 Listing Removed — OneKey® MLS as Distributed by MLS Grid
- 2020-02-05 Price Changed $949,000 OneKey® MLS as Distributed by MLS Grid
- 2020-01-29 Price Changed $999,000 OneKey® MLS as Distributed by MLS Grid
- 2019-11-12 Price Changed $1,100,000 OneKey® MLS as Distributed by MLS Grid
- 2019-10-07 Listed $1,200,000 OneKey® MLS as Distributed by MLS Grid
- 2016-12-05 Listing Removed — OneKey® MLS as Distributed by MLS Grid
- 2016-11-29 Listed $949,000 OneKey® MLS as Distributed by MLS Grid
- 2014-02-21 Listing Removed — OneKey® MLS as Distributed by MLS Grid
- 2013-10-30 Listed $879,000 OneKey® MLS as Distributed by MLS Grid
- 2000-08-22 Sold (Public Records) $675,000 Public Records
- 1998-09-29 Sold (Public Records) $439,000 Public Records
Property tax history
+1.5%/yrLatest (2024): $11,339 · +0.0% YoY. Source: county tax records.
Cash-flow waterfall
monthlySold comps — $/sqft
last 12 mo · ≤1 miLoading sold comps…