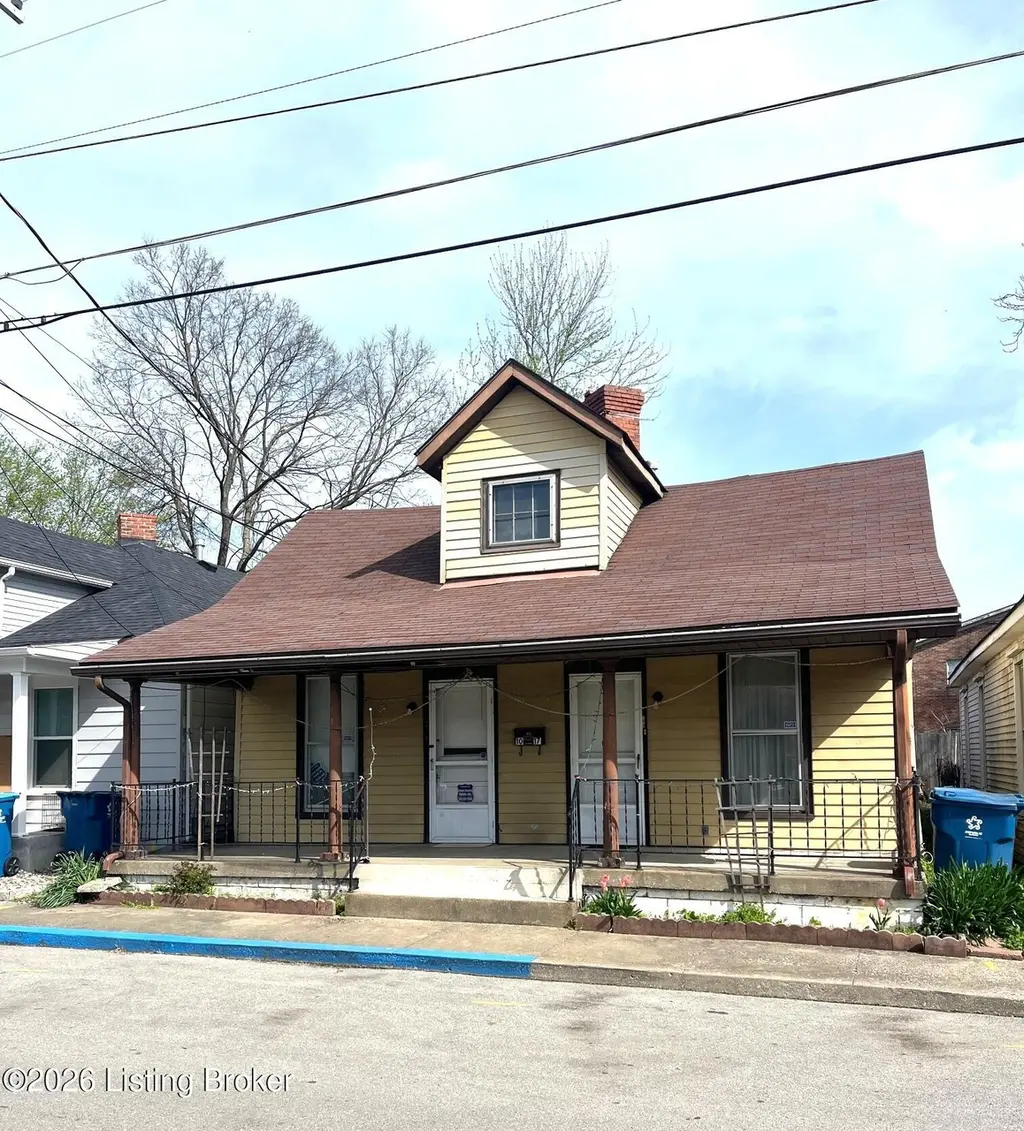
1017 Henry Clay St · Shelbyville, KY
Flood risk 1/10 · Minimal
- FEMA flood zone
- X (unshaded)
- Chance of flooding over 30 yrs
- 0.0%
- Est. flood insurance / yr
- $473 – $860
Fire risk 1/10 · Minimal
- Est. fire insurance / yr
- $839 – $1,559
Heat risk 5/10 · Moderate
- Hot days now (above 104°F)
- 7 days/yr
- Hot days in 30 yrs
- 19 days/yr
Wind risk 2/10 · Minimal
- Chance of severe wind over 30 yrs
- 1.0%
Air-quality risk 2/10 · Minimal
- Unhealthy air days now
- 1 days/yr
- Unhealthy air days in 30 yrs
- 2 days/yr
Risk factors via First Street. Map © Google.
Why this score? — see what drove the B grade
The composite is a weighted blend of 9 inputs, each scored 0–100. Each bar is that input's sub-score; the figure is the points it added to the 100-point composite (weight × sub-score).
- Cash flow +29.4/30.0
- ARV discount +15.0/15.0
- DSCR +10.0/10.0
- 1% rule +7.0/10.0
- Livability +3.8/5.0
- Schools +2.8/10.0
- Rent growth +2.5/5.0
- Condition / age +2.5/5.0
- Appreciation +0.0/10.0
$120,000
🖨 Deal sheet 📄 Offer letter ✓ Due diligence
Listing remarks MLS
Great location! Downtown Shelbyville. Nice starter home or investment property. Near fire department, health department, stores and business offices. Nice front porch.
Key facts
- Listed 77 days
Neighborhood map
What this means for you Summary
Snapshot
- This is a 3-bed/1.0-bath other listed at $120k.
Deal economics
- At list price, monthly cash flow is $427 ($5k/yr) — positive.
- The deal already cash-flows at list — no discount required.
- Meets the 1% rule at list price ($1k rent vs $120k).
- Recommended offer: $113k (6.0% below list) — sets the bar for market timing.
- Cap rate 10.6% vs local median 3.5% in Shelbyville — top-decile yield for the area; either an underpriced asset or a hidden risk that comps aren't pricing in. Stress-test before assuming the spread holds.
Location & tenants
- Location reads 75/100 on livability (#101 in KY, #4,143 nationally) — a middle-class / working-renter tenant base. Strengths: cost of living A+, housing A+, crime A; Watch: schools D, amenities F, commute F.
- Shelby County (town): math 26% / reading 37% proficiency, ranked #77 of 165 in KY (top 47%) — families likely to look elsewhere, expect single-tenant / working-renter base with shorter leases.
- Market conditions: 292 active listings in the ZIP; 10 comparable units currently listed for rent nearby; rentals lingering (median 44d on market — plan ~5-8 weeks vacancy on turnover, expect pricing pressure); 50% of comp listings sitting > 30 days — soft ceiling on asking rent; solid renter incomes; 237 units permitted in Shelby County in 2024 (0 in 5+ unit buildings).
Forward outlook
- Local home prices are declining (-3.0%/yr); year-one equity from $830 of loan paydown is wiped out by about $4k of value loss. Plan a longer hold.
- Shelby County population projected at +34% by 2050 — long-run rental-demand tailwind backs the buy-and-hold thesis.
- At projected returns (-3.0% appreciation + 3.0% rent growth), your $34k cash investment doubles in ~8 years — after that, you're playing with house money.
Negotiation context
- It's been on market 77 days — a 6% lower offer ($113k) is reasonable based on typical stale-listing flexibility.
Risks & watch-outs
- Climate carrying-cost: extreme-heat days projected 7→19/yr by 2055 (HVAC capex compounding) — expect insurance premiums to compound above CPI over the hold.
Questions for the listing agent
- It's been on market 77 days. Have you received any prior offers? Is the seller open to a 6% concession, seller financing, or rate buy-down credit?
- Why hasn't it sold? Are there any deal-killer items the seller is aware of (foundation, flood, title, zoning, code violations)?
- Is there a deadline driving the sale (1031 exchange, divorce, estate, relocation)? That informs how much negotiation room exists.
- Schools are D-rated, which usually means shorter tenancies and higher turnover. Who's the typical renter profile here, and what's been the actual vacancy rate?
- What's the average days-on-market for RENTAL listings here right now (not sales)? A rising rental-DOM trend means longer vacancies and softer asking-rent achievability than the comps imply.
- What's the recent tenant-quality profile in this submarket — average credit score on applications, eviction rate, late-payment / NSF rate, and stable-employment percentage? A property-management company in the area should have these aggregated.
- How much new for-sale + rental construction is in the pipeline within 1–3 miles? Heavy new supply typically softens prices + rents 12–24 months out; constrained supply supports both.
Investment metrics
- 1% rule
- 1.20% ✓
- Cap rate
- 10.57%
- Cash-on-cash
- 15.26%
- DSCR
- 1.68
- GRM
- 6.9
CMA / ARV
- ARV (median comp)
- $209,431
- List price
- $120,000
- Delta
- -42.70%
- Verdict
- UNDERPRICED
- Comps
- 20 within 1.0 mi
Projected returns pro-forma
-3.0% appreciation · 3.0% rent growth · sell at horizon
- IRR
- 5.9%
- Equity multiple
- 1.23×
- Total profit
- $7,719
- Equity at exit
- $17,892
- IRR
- 15.3%
- Equity multiple
- 2.24×
- Total profit
- $41,562
- Equity at exit
- $10,375
Cash invested: $33,600 (down + closing). Projections, not guarantees.
Landlord ↔ Tenant lean methodology
- Overall (STATE)
- 83 Strongly Landlord-Friendly
- State Kentucky
- 83 Strongly Landlord-Friendly · R+16
- County
- — inherits STATE
- City
- — inherits STATE
ZIP-level market 40065
- Active inventory
- 292
- Price-to-rent
- 6.9×
Monthly cashflow live
- Estimated rent
- $1,444 high interval (Pro) →
- Mortgage (P&I)
- −$629
- Tax from tax record
- −$34 /mo · $406/yr
- Insurance
- −$50
- HOA
- −$0
- Vacancy / Maint / Mgmt
- −$303
- Net cashflow
- $427
Break-even live
UW: 25.0% down · 7.5% · 30yr · 1.5% tax · 5.0% vac · 8.0% maint · 8.0% mgmt
Financing live
Cash to close
- Down payment
- $30,000
- Closing costs
- $3,600
- Reserves months
- —
- Total cash needed
- —
Loan-product check · same deal, 3 products live
Conventional
25% down · 7.5% · 30yr
- Down + closing
- —
- Monthly P&I
- —
- Monthly cashflow
- —
- DSCR
- —
- Eligible?
- —
Personal DTI + credit; lowest rate.
DSCR
20% down · 8.5% · 30yr
- Down + closing
- —
- Monthly P&I
- —
- Monthly cashflow
- —
- DSCR
- —
- Eligible?
- —
No personal income docs; deal must DSCR.
Hard money
10% down · 12.0% · 12mo
- Down + closing
- —
- Monthly P&I
- —
- Monthly cashflow
- —
- DSCR
- —
- Eligible?
- —
Short-term bridge; refi at stabilization.
Rent comps 10 comps
| Address | Beds | Baths | Sqft | Rent | $/sqft | DOM | Units | Dist |
|---|---|---|---|---|---|---|---|---|
| 113 Ada Ave Shelbyville, KY | 2.0 | 1.5 | 1008 | $1,025 | $1.02 | 43d | 1 | 0.25mi |
| 103 Martin Luther King Jr St Shelbyville, KY | 2.0 | 1.0 | 909 | $1,295 | $1.42 | 17d | 1 | 0.26mi |
| 149 Gray Hill Ct Shelbyville, KY | 2.0 | 1.5 | 1050 | $895 | $0.85 | 23d | 1 | 0.65mi |
| 1569 Sanford Ln Shelbyville, KY | 1.0–2.0 | 1.0–2.0 | 1017 | $1,225 | $1.20 | 1d | 5 | 0.77mi |
| 874 Marian Village Dr Shelbyville, KY | 2.0–3.0 | 1.5–2.0 | 1015 | $1,475 | $1.45 | 1d | 4 | 0.98mi |
| 1856 Blackwell Rd Unit 1858 Blackwell Shelbyville, KY | 3.0 | 2.0 | 1100 | $1,695 | $1.54 | 43d | 1 | 1.28mi |
| 1814 Oakwood Dr Shelbyville, KY | 3.0 | 1.0 | 1050 | $1,599 | $1.52 | 43d | 1 | 1.34mi |
| 122 Spencer Ct Shelbyville, KY | 3.0 | 2.0 | 1547 | $1,940 | $1.25 | 43d | 1 | 1.36mi |
| 121 Spencer Ct Shelbyville, KY | 3.0 | 2.0 | 1135 | $1,695 | $1.49 | 17d | 1 | 1.37mi |
| 6041 Edgemont Way Shelbyville, KY | 3.0 | 2.0 | 1489 | $2,325 | $1.56 | 43d | 1 | 1.46mi |
Listing history 17 events
-
2026-06-18days on market $120,000 Active 77 DOM
-
2026-06-17days on market $120,000 Active 76 DOM
-
2026-06-16days on market $120,000 Active 75 DOM
-
2026-06-15days on market $120,000 Active 74 DOM
-
2026-06-13days on market $120,000 Active 72 DOM
-
2026-06-13days on market $120,000 Active 71 DOM
-
2026-06-10days on market $120,000 Active 69 DOM
-
2026-06-09days on market $120,000 Active 68 DOM
-
2026-06-08days on market $120,000 Active 67 DOM
-
2026-06-07days on market $120,000 Active 66 DOM
-
2026-06-05days on market $120,000 Active 63 DOM
-
2026-06-03days on market $120,000 Active 62 DOM
-
2026-06-02days on market $120,000 Active 61 DOM
-
2026-06-01days on market $120,000 Active 60 DOM
-
2026-05-31days on market $120,000 Active 59 DOM
-
2026-05-08price $120,000 171-char remark
Show marketing remark (171 chars)
Great location! Downtown Shelbyville. Nice starter home or investment property. Near fire department, health department, stores and business offices. Nice front porch.
-
2026-04-01$129,500 Active 171-char remark
Show marketing remark (171 chars)
Great location! Downtown Shelbyville. Nice starter home or investment property. Near fire department, health department, stores and business offices. Nice front porch.
ⓘ Source: listings_history table (triggers on properties + properties_extension) + one-shot
backfill from property_details.listing_events for pre-trigger history.
Tax reassessment forecast KY · Resets to sale price
- Current annual tax
- $406 · $34/mo
- Projected year-2 tax
- $1,032 · $86/mo
- Expected delta
- +$626/yr (+$52/mo · 154.0%)
ⓘ Screening estimate from a state-policy table — verify with the county assessor before closing.
Climate risk First Street
- Flood 1/10 Low FEMA zone X (unshaded) · 0% chance over 30 yrs
- Wildfire 1/10 Low
- Heat 5/10 Major 7 d/yr ≥104°F today · 19 d/yr by 30 yrs out
- Wind 2/10 Low 100% chance of damaging wind over 30 yrs
- Air quality 2/10 Low 1 unhealthy d/yr today · 2 by 30 yrs out
Nearby sold comps map
Loading sold comps map…
Walkable amenities ~0.75 mi
Loading nearby amenities…
Taxation est. · year 1
- Rental income
- $17,323
- − Mortgage interest
- −$6,722
- − Property taxes
- −$406
- − Insurance
- −$600
- − Repairs & maintenance
- −$1,386
- − Management
- −$1,386
- − Depreciation
- −$3,491
- Taxable income
- $3,332
- Est. tax owed @ 24.0%
- −$800
- After-tax cash flow
- $4,328/yr
For passive investors: Depreciation is non-cash, so a rental often shows a tax loss while cash-flowing — sheltering income. Rental losses are passive: they offset passive income freely, and up to $25,000/yr can offset ordinary (W-2) income if you actively participate and your MAGI is under $100k (phasing out to $0 by $150k); unused losses carry forward. On sale, claimed depreciation is recaptured at up to 25%, and gains may owe capital-gains tax (a 1031 exchange can defer both). Figures are a year-1 estimate at your 24.0% rate — not tax advice; consult a CPA.
Schools (NCES district)
- District
- Shelby County
- NCES district ID
- 2105320
- Math proficiency
- 26% ▼ -10.00%
- Reading proficiency
- 37% ▼ -11.00%
- Median HH income
- $58,163
- Composite
- 28.19/100
- National rank
- #6809
- State rank
- #77 of 165 in KY
Livability — Shelbyville
- Score
- 75/100
- State rank
- #101
- US rank
- #4143
Category grades
Schools grade is shown separately in the Schools card above.
Census & demographics
- Census place
- Shelbyville, KY
- County
- Shelby County · 32,160 people
- City population
- 32,160
- Metro
- Louisville/Jefferson County, KY-IN
- Population (ZIP)
- 32,160
- Household income
- $77,869
- Rent vs Own
- Severe rent burden
- 655.0
Population outlook (Shelby County) Hauer SSP2
- Today (2025)
- 52,947 people
- By 2030
- 56,624 · +6.9%
- By 2040
- 63,983 · +20.8%
- By 2050
- 70,917 · +33.9%
- By 2075
- 87,345 · +65.0%
- By 2100
- 97,345 · +83.9%
Race, ethnicity, and origin ACS 2023
- Neighborhood character
- Predominantly White (74%)
- Race & ethnicity
- White 74% Hispanic / Latino 14% Two or more races 10% Black 6% Asian 1%
- Hispanic origin (detail)
- Mexican 7% Puerto Rican 1%
- Common ancestry
- Slovak 3% Serbian 2% Italian 2%
- Foreign-born
- 8% · Canada
- Languages at home
- 87% English-only · Spanish 11% Tagalog/Filipino 1% Other Asian/Pacific 1%
Political lean MEDSL · Shelby
- 2024 margin
- Solid R (+34.7) · D 31.8% · R 66.5% · Other 1.7%
- 2008→2024 swing
- -10.0pp toward R · 2008: -24.7pp · 2024: -34.7pp
- All cycles
- 2024: R+34.7 2020: R+29.6 2016: R+33.6 2012: R+27.6 2008: R+24.7
Not yet ingested
- Civics
- —
Market trends
- HPI YoY
- ▼ -144.73%
- Current HPI
- 177.2875
- Rent YoY
- —
- Metro
- Louisville/Jefferson County, KY-IN
- State GDP YoY
- ▲ 1.81%
- F500 in state
- 4
Industry mix (Fortune 500 HQ in KY)
| Industry | F500 HQs | Revenue |
|---|---|---|
| Healthcare | 1 | $118B |
|
||
| Food / Beverage | 1 | $7B |
|
||
Price history
-7.3% since first listed2 events — show timeline
- 2026-05-08 Price Changed $120,000 Metro Search MLS
- 2026-04-01 Listed $129,500 Metro Search MLS
Property tax history
+0.6%/yrLatest (2025): $406 · -0.9% YoY. Source: county tax records.
Cash-flow waterfall
monthlySold comps — $/sqft
last 12 mo · ≤1 miLoading sold comps…