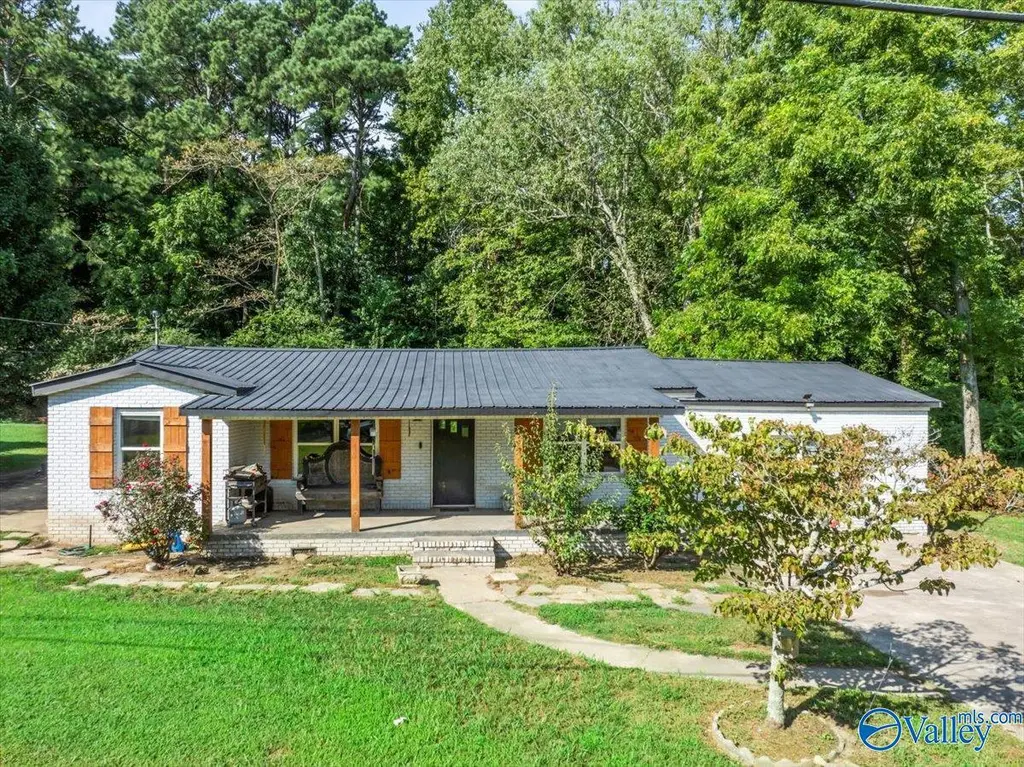
1107 Mcville Rd · Boaz, AL
Flood risk 1/10 · Minimal
- FEMA flood zone
- X (unshaded)
- Chance of flooding over 30 yrs
- 0.0%
- Est. flood insurance / yr
- $507 – $1,088
Fire risk 3/10 · Minor
- Est. fire insurance / yr
- $916 – $1,700
Heat risk 5/10 · Moderate
- Hot days now (above 103°F)
- 7 days/yr
- Hot days in 30 yrs
- 20 days/yr
Wind risk 4/10 · Minor
- Chance of severe wind over 30 yrs
- 22.0%
Air-quality risk 2/10 · Minimal
- Unhealthy air days now
- 1 days/yr
- Unhealthy air days in 30 yrs
- 3 days/yr
Risk factors via First Street. Map © Google.
Why this score? — see what drove the D grade
The composite is a weighted blend of 9 inputs, each scored 0–100. Each bar is that input's sub-score; the figure is the points it added to the 100-point composite (weight × sub-score).
- ARV discount +15.0/15.0
- Cash flow +10.3/30.0
- Livability +3.1/5.0
- DSCR +3.0/10.0
- Schools +3.0/10.0
- Rent growth +2.5/5.0
- Condition / age +2.5/5.0
- 1% rule +1.9/10.0
- Appreciation +0.0/10.0
$227,900
🖨 Deal sheet 📄 Offer letter ✓ Due diligence
Listing remarks MLS
Wow! Check out this 4 bed 2 bath home with over 1800 sq ft. Open floor concept that creates ample space for entertaining. Kitchen offers tile back splash with stainless appliances. Huge master suite with double vanity and tile shower. Newer metal roof and windows with an encapsulated crawlspace. Convenient to local businesses and schools. Let’s make it happen!
Key facts
- 0.52 acre lot
- Built 1938
- Listed 295 days
Neighborhood map
What this means for you Summary
Snapshot
- This is a 4-bed/2.0-bath single-family listed at $228k.
Deal economics
- At list price, monthly cash flow is $-124 ($-1k/yr) — negative.
- To cash-flow at today's rent, offer at most $206k (9.6% below list).
- To meet the 1% rule (rent ≥ 1% of price), the offer needs to be $157k (31.1% below list).
- Recommended offer: $157k (31.1% below list) — sets the bar for 1% rule.
- Cap rate 5.6% vs local median 4.3% in Boaz — top-decile yield for the area; either an underpriced asset or a hidden risk that comps aren't pricing in. Stress-test before assuming the spread holds.
Location & tenants
- Location reads 61/100 on livability (#233 in AL) — a middle-class / working-renter tenant base. Strengths: cost of living A+, housing A; Watch: crime C-, employment D+, schools D-.
- Boaz City (town): math 28% / reading 44% proficiency, ranked #43 of 129 in AL (top 33%) — families likely to look elsewhere, expect single-tenant / working-renter base with shorter leases.
- Market conditions: 87 active listings in the ZIP; 163 units permitted in Marshall County in 2024 (0 in 5+ unit buildings).
Forward outlook
- Local home prices are declining (-3.0%/yr); year-one equity from $2k of loan paydown is wiped out by about $7k of value loss. Plan a longer hold.
Negotiation context
- It's been on market 296 days — a 12% lower offer ($201k) is reasonable based on typical stale-listing flexibility.
- 3 sale attempts since 3y ago; this cycle's ask has dropped $12k (5%) from the opening price — seller is motivated, your offer sets the floor, not the list.
Risks & watch-outs
- Watch-outs: built in 1938 — expect roof / HVAC / electrical / plumbing capex.
- Climate carrying-cost: extreme-heat days projected 7→20/yr by 2055 (HVAC capex compounding) — expect insurance premiums to compound above CPI over the hold.
Questions for the listing agent
- What do current leases actually rent for vs. the listed asking? Can we see a recent rent roll and the last 12 months of T-12 income?
- It's been on market 296 days. Have you received any prior offers? Is the seller open to a 31% concession, seller financing, or rate buy-down credit?
- Built in 1938 — when were the roof, HVAC, electrical panel, plumbing, and water heater last replaced?
- Why hasn't it sold? Are there any deal-killer items the seller is aware of (foundation, flood, title, zoning, code violations)?
- Is there a deadline driving the sale (1031 exchange, divorce, estate, relocation)? That informs how much negotiation room exists.
- Schools are D-rated, which usually means shorter tenancies and higher turnover. Who's the typical renter profile here, and what's been the actual vacancy rate?
- The area grade is low — what's the realistic commute time and amenity access for the typical tenant pool here? Any planned neighborhood developments (good or bad) we should know about?
- What's the average days-on-market for RENTAL listings here right now (not sales)? A rising rental-DOM trend means longer vacancies and softer asking-rent achievability than the comps imply.
- What's the recent tenant-quality profile in this submarket — average credit score on applications, eviction rate, late-payment / NSF rate, and stable-employment percentage? A property-management company in the area should have these aggregated.
- How much new for-sale + rental construction is in the pipeline within 1–3 miles? Heavy new supply typically softens prices + rents 12–24 months out; constrained supply supports both.
Investment metrics
- 1% rule
- 0.69% ✗
- Cap rate
- 5.64%
- Cash-on-cash
- -2.33%
- DSCR
- 0.90
- GRM
- 12.1
CMA / ARV
- ARV (median comp)
- $301,320
- List price
- $227,900
- Delta
- -24.37%
- Verdict
- UNDERPRICED
- Comps
- 20 within 1.0 mi
Show comp detail 12 sales within ~0.75 mi
| Address | Dist | Beds/Ba | Sqft | Sold | Price | $/sf | Match |
|---|---|---|---|---|---|---|---|
| 735 Mcville Rd | 0.34mi | 3/2.0 (-1) | 1,800 (-3%) | 9mo | $210,000 | $117 | 66 |
| 54 Ora St | 0.29mi | 3/2.0 (-1) | 1,765 (-5%) | 10mo | $310,000 | $176 | 65 |
| 434 Mcville Rd | 0.70mi | 3/2.0 (-1) | 1,860 (-0%) | 1mo | $375,000 | $202 | 62 |
| 1009 Bruce Rd | 0.57mi | 3/2.0 (-1) | 1,870 (+0%) | 12mo | $285,000 | $152 | 58 |
| 1182 Bruce Rd | 0.60mi | 3/2.0 (-1) | 1,915 (+3%) | 11mo | $365,000 | $191 | 53 |
| 1168 Bruce Rd | 0.59mi | 3/2.0 (-1) | 1,915 (+3%) | 17mo | $365,000 | $191 | 49 |
| 1122 Bruce Rd | 0.58mi | 3/2.0 (-1) | 1,902 (+2%) | 22mo | $351,000 | $185 | 46 |
| 475 Mcville Rd | 0.60mi | 3/2.5 (-1) | 1,960 (+5%) | 16mo | $118,000 | $60 | 43 |
| 877 Highland St | 0.63mi | 3/2.0 (-1) | 1,600 (-14%) | 1mo | $105,000 | $66 | 42 |
| 325 Greenwood Ave | 0.71mi | 3/2.0 (-1) | 1,657 (-11%) | 3mo | $262,000 | $158 | 41 |
| 274 Kayla Cir | 0.73mi | 3/2.0 (-1) | 1,642 (-12%) | 1mo | $315,000 | $192 | 40 |
| 348 Kayla Cir | 0.69mi | 3/2.0 (-1) | 2,100 (+13%) | 16mo | $367,000 | $175 | 29 |
Match score weights: distance 35% · size 25% · config 20% · recency 20%. Top-matched comps best support the ARV.
Projected returns pro-forma
-3.0% appreciation · 3.0% rent growth · sell at horizon
- IRR
- -20.2%
- Equity multiple
- 0.30×
- Total profit
- $-44,939
- Equity at exit
- $33,981
- IRR
- -13.4%
- Equity multiple
- 0.22×
- Total profit
- $-49,737
- Equity at exit
- $19,705
Cash invested: $63,812 (down + closing). Projections, not guarantees.
Landlord ↔ Tenant lean methodology
- Overall (STATE)
- 90 Strongly Landlord-Friendly
- State Alabama
- 90 Strongly Landlord-Friendly · R+15
- County
- — inherits STATE
- City
- — inherits STATE
ZIP-level market 35957
- Home prices YoY
- -10.6%
- Active inventory
- 87
- Price-to-rent
- 12.1×
Monthly cashflow live
- Estimated rent
- $1,570 medium interval (Pro) →
- Mortgage (P&I)
- −$1,195
- Tax from tax record
- −$75 /mo · $896/yr
- Insurance
- −$95
- HOA
- −$0
- Vacancy / Maint / Mgmt
- −$330
- Net cashflow
- $-124
Break-even live
UW: 25.0% down · 7.5% · 30yr · 1.5% tax · 5.0% vac · 8.0% maint · 8.0% mgmt
Financing live
Cash to close
- Down payment
- $56,975
- Closing costs
- $6,837
- Reserves months
- —
- Total cash needed
- —
Loan-product check · same deal, 3 products live
Conventional
25% down · 7.5% · 30yr
- Down + closing
- —
- Monthly P&I
- —
- Monthly cashflow
- —
- DSCR
- —
- Eligible?
- —
Personal DTI + credit; lowest rate.
DSCR
20% down · 8.5% · 30yr
- Down + closing
- —
- Monthly P&I
- —
- Monthly cashflow
- —
- DSCR
- —
- Eligible?
- —
No personal income docs; deal must DSCR.
Hard money
10% down · 12.0% · 12mo
- Down + closing
- —
- Monthly P&I
- —
- Monthly cashflow
- —
- DSCR
- —
- Eligible?
- —
Short-term bridge; refi at stabilization.
Listing history 29 events
-
2026-06-19days on market $227,900 Active 296 DOM
-
2026-06-18days on market $227,900 Active 295 DOM
-
2026-06-17days on market $227,900 Active 294 DOM
-
2026-06-16days on market $227,900 Active 293 DOM
-
2026-06-15days on market $227,900 Active 292 DOM
-
2026-06-14days on market $227,900 Active 290 DOM
-
2026-06-12days on market $227,900 Active 289 DOM
-
2026-06-09days on market $227,900 Active 286 DOM
-
2026-06-08days on market $227,900 Active 285 DOM
-
2026-06-07days on market $227,900 Active 284 DOM
-
2026-06-07days on market $227,900 Active 283 DOM
-
2026-06-04days on market $227,900 Active 280 DOM
-
2026-06-02days on market $227,900 Active 279 DOM
-
2026-06-01days on market $227,900 Active 278 DOM
-
2026-05-31days on market $227,900 Active 277 DOM
-
2026-05-31days on market $227,900 Active 276 DOM
-
2026-01-24price $227,900 368-char remark
Show marketing remark (368 chars)
Wow! Check out this 4 bed 2 bath home with over 1800 sq ft. Open floor concept that creates ample space for entertaining. Kitchen offers tile back splash with stainless appliances. Huge master suite with double vanity and tile shower. Newer metal roof and windows with an encapsulated crawlspace. Convenient to local businesses and schools. Let’s make it happen!
-
2026-01-03price $229,900 368-char remark
Show marketing remark (368 chars)
Wow! Check out this 4 bed 2 bath home with over 1800 sq ft. Open floor concept that creates ample space for entertaining. Kitchen offers tile back splash with stainless appliances. Huge master suite with double vanity and tile shower. Newer metal roof and windows with an encapsulated crawlspace. Convenient to local businesses and schools. Let’s make it happen!
-
2025-09-22price $234,900 368-char remark
Show marketing remark (368 chars)
Wow! Check out this 4 bed 2 bath home with over 1800 sq ft. Open floor concept that creates ample space for entertaining. Kitchen offers tile back splash with stainless appliances. Huge master suite with double vanity and tile shower. Newer metal roof and windows with an encapsulated crawlspace. Convenient to local businesses and schools. Let’s make it happen!
-
2025-08-27$239,900 Active 368-char remark
Show marketing remark (368 chars)
Wow! Check out this 4 bed 2 bath home with over 1800 sq ft. Open floor concept that creates ample space for entertaining. Kitchen offers tile back splash with stainless appliances. Huge master suite with double vanity and tile shower. Newer metal roof and windows with an encapsulated crawlspace. Convenient to local businesses and schools. Let’s make it happen!
-
2024-08-30historical
-
2024-07-01price $249,900
-
2024-06-23$254,900 Active
-
2023-07-18soldstatus $228,500 Sold
-
2023-07-18soldstatus $228,500
-
2023-06-15status Pending
-
2023-05-18$228,500 Active
-
2021-09-07soldstatus $60,000
-
2013-03-14soldstatus $8,000
ⓘ Source: listings_history table (triggers on properties + properties_extension) + one-shot
backfill from property_details.listing_events for pre-trigger history.
Tax reassessment forecast AL · Resets to sale price
- Current annual tax
- $896 · $75/mo
- Projected year-2 tax
- $934 · $78/mo
- Expected delta
- +$38/yr (+$3/mo · 4.3%)
ⓘ Screening estimate from a state-policy table — verify with the county assessor before closing.
Climate risk First Street
- Flood 1/10 Low FEMA zone X (unshaded) · 0% chance over 30 yrs
- Wildfire 3/10 Moderate
- Heat 5/10 Major 7 d/yr ≥103°F today · 20 d/yr by 30 yrs out
- Wind 4/10 Moderate 22% chance of damaging wind over 30 yrs
- Air quality 2/10 Low 1 unhealthy d/yr today · 3 by 30 yrs out
Nearby sold comps map
Loading sold comps map…
Walkable amenities ~0.75 mi
Loading nearby amenities…
Taxation est. · year 1
- Rental income
- $18,846
- − Mortgage interest
- −$12,766
- − Property taxes
- −$896
- − Insurance
- −$1,140
- − Repairs & maintenance
- −$1,508
- − Management
- −$1,508
- − Depreciation
- −$6,630
- Taxable loss
- −$5,601
- Est. tax savings @ 24.0%
- +$1,344
- After-tax cash flow
- $-145/yr
For passive investors: Depreciation is non-cash, so a rental often shows a tax loss while cash-flowing — sheltering income. Rental losses are passive: they offset passive income freely, and up to $25,000/yr can offset ordinary (W-2) income if you actively participate and your MAGI is under $100k (phasing out to $0 by $150k); unused losses carry forward. On sale, claimed depreciation is recaptured at up to 25%, and gains may owe capital-gains tax (a 1031 exchange can defer both). Figures are a year-1 estimate at your 24.0% rate — not tax advice; consult a CPA.
Schools (NCES district)
- District
- Boaz City
- NCES district ID
- 0100012
- Math proficiency
- 28% ▼ -15.00%
- Reading proficiency
- 44% ▲ 5.00%
- Median HH income
- $35,599
- Composite
- 29.74/100
- National rank
- #6442
- State rank
- #43 of 129 in AL
Livability — Boaz
- Score
- 61/100
- State rank
- #233
- US rank
- #17318
Category grades
Schools grade is shown separately in the Schools card above.
Census & demographics
- Census place
- Boaz, AL
- Population (ZIP)
- 16,672
Population outlook (Marshall County) Hauer SSP2
- Today (2025)
- 97,402 people
- By 2030
- 98,138 · +0.8%
- By 2040
- 98,502 · +1.1%
- By 2050
- 97,024 · -0.4%
- By 2075
- 89,334 · -8.3%
- By 2100
- 74,749 · -23.3%
Race, ethnicity, and origin ACS 2023
- Neighborhood character
- Predominantly White (73%)
- Race & ethnicity
- White 73% Hispanic / Latino 22% Two or more races 6% Black 2%
- Hispanic origin (detail)
- Mexican 10% Puerto Rican 1%
- Common ancestry
- Slovak 1% Russian 1% Serbian 1%
- Foreign-born
- 9% · Canada
- Languages at home
- 83% English-only · Spanish 15% Other Indo-European 1%
Political lean MEDSL · Marshall
- 2024 margin
- Solid R (+71.7) · D 13.8% · R 85.5%
- 2008→2024 swing
- -15.4pp toward R · 2008: -56.4pp · 2024: -71.7pp
- All cycles
- 2024: R+71.7 2020: R+68.7 2016: R+69.5 2012: R+60.1 2008: R+56.4
Not yet ingested
- Civics
- —
Market trends
- HPI YoY
- ▼ -29.42%
- Current HPI
- 249.5829
- Rent YoY
- —
- Metro
- —
- State GDP YoY
- ▲ 2.94%
- F500 in state
- 4
Industry mix (Fortune 500 HQ in AL)
| Industry | F500 HQs | Revenue |
|---|---|---|
| Financial Services | 1 | $8B |
|
||
| Healthcare | 1 | $5B |
|
||
Price history
+2748.8% since first listed13 events — show timeline
- 2026-01-24 Price Changed $227,900 VMLS
- 2026-01-03 Price Changed $229,900 VMLS
- 2025-09-22 Price Changed $234,900 VMLS
- 2025-08-27 Listed $239,900 VMLS
- 2024-08-30 Delisted — VMLS
- 2024-07-01 Price Changed $249,900 VMLS
- 2024-06-23 Listed $254,900 VMLS
- 2023-07-18 Sold (Public Records) $228,500 Public Records
- 2023-07-18 Sold (MLS) $228,500 VMLS
- 2023-06-15 Pending — VMLS
- 2023-05-18 Listed $228,500 VMLS
- 2021-09-07 Sold (Public Records) $60,000 Public Records
- 2013-03-14 Sold (Public Records) $8,000 Public Records
Property tax history
+14.0%/yrLatest (2025): $896 · +7.4% YoY. Source: county tax records.
Cash-flow waterfall
monthlySold comps — $/sqft
last 12 mo · ≤1 miLoading sold comps…