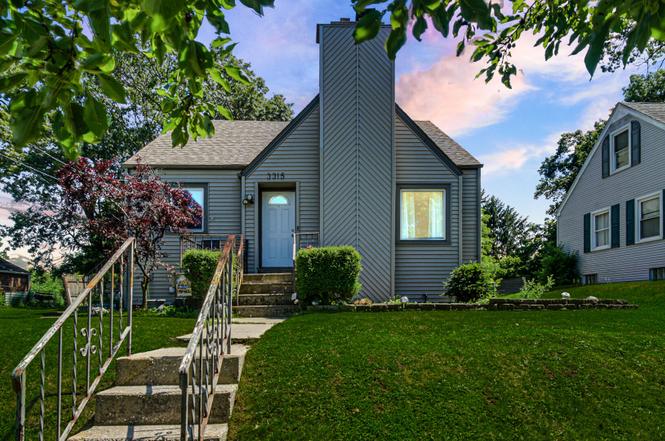
3315 Edison St · Lake Station, IN
Flood risk 1/10 · Minimal
- FEMA flood zone
- X (unshaded)
- Chance of flooding over 30 yrs
- 0.0%
- Est. flood insurance / yr
- $473 – $860
Fire risk 6/10 · Moderate
- Est. fire insurance / yr
- $717 – $1,331
Heat risk 2/10 · Minimal
- Hot days now (above 102°F)
- 7 days/yr
- Hot days in 30 yrs
- 15 days/yr
Wind risk 2/10 · Minimal
- Chance of severe wind over 30 yrs
- 0.0%
Air-quality risk 4/10 · Minor
- Unhealthy air days now
- 5 days/yr
- Unhealthy air days in 30 yrs
- 6 days/yr
Risk factors via First Street. Map © Google.
Why this score? — see what drove the D+ grade
The composite is a weighted blend of 9 inputs, each scored 0–100. Each bar is that input's sub-score; the figure is the points it added to the 100-point composite (weight × sub-score).
- Cash flow +17.9/30.0
- ARV discount +8.2/15.0
- DSCR +5.6/10.0
- 1% rule +3.9/10.0
- Livability +3.2/5.0
- Rent growth +2.5/5.0
- Condition / age +2.5/5.0
- Schools +1.7/10.0
- Appreciation +0.0/10.0
$199,000
🖨 Deal sheet (PDF) 📄 Offer letter ✓ Due diligence
Listing remarks MLS
New Year, new project! This 3 bedroom, 1 bath Cape Cod style home has loads of potential, but needs plenty of work to get there. Home is situated on a corner lot and features a deck, unfinished basement and fireplace. HUD owned property sold as-is. HUD case# 151-900118, UI. Buyer is responsible for utility activation for any inspections or appraisals. Plumbing did not hold pressure during winterization and seller will not allow water to be turned on. HUD is not permitted to give keys out at closing. Buyer shall arrange to have home re-keyed after closing.
Key facts
- Flex space
- Walk-out basement
- Updated kitchen
Tags
Property features AI
Exterior
- Parking: Off-street parking with additional parking available
- Utilities: Electricity connected; Public water; Public sewer; Natural gas connected
- Home design: One-and-one-half story vinyl-sided home; Built in 1948
- Construction: Vinyl siding; Has a basement (full, partially finished with walk-out access, interior entry, bath stubbed, storage space)
- Exterior features: Deck; Fenced backyard; Shed(s); Trees/woods view
Interior
- Kitchen: Range; Microwave; Refrigerator
- Bedrooms: Primary bedroom; Three additional bedrooms
- Flooring: Hardwood floors
- Bathrooms: 1 full bathroom
- Heating & cooling: Forced air heating (natural gas); Central air conditioning
- Interior features: Eat-in kitchen; Recessed lighting; Living room fireplace (wood burning)
- Laundry & utility: Laundry room with washer and dryer hookups (electric and gas dryer hookups); Utility sink; Washer and dryer included; Gas water heater
Neighborhood map
What this means for you Summary
Snapshot
- This is a 3-bed/1.5-bath single-family listed at $199k.
Deal economics
- At list price, monthly cash flow is $169 ($2k/yr) — positive.
- The deal already cash-flows at list — no discount required.
- To meet the 1% rule (rent ≥ 1% of price), the offer needs to be $177k (11.2% below list).
- Recommended offer: $177k (11.2% below list) — sets the bar for 1% rule.
Location & tenants
- Location reads 63/100 on livability (#411 in IN) — a middle-class / working-renter tenant base. Strengths: cost of living A+, housing A+; Watch: crime C-, amenities F, commute F.
- Lake Station Community Schools (suburban): math 16% / reading 24% proficiency, ranked #278 of 301 in IN (top 92%) — low school quality limits family demand, transient renter base, plan for 1-2y turnover; 69% free/reduced lunch — lower-income household profile, screen leases tightly.
- Zoned schools: Virgil I Bailey Elementary School (math 27% / reading 17%, grade F, #790 of 994 statewide, top 81%, 270 students, 84% FRL); Thomas A Edison Jr-Sr Hs (math 7% / reading 24%, grade F, #355 of 369 statewide, top 96%, 616 students, 76% FRL).
- Market conditions: 59 active listings in the ZIP; 4 comparable units currently listed for rent nearby; rentals lingering (median 46d on market — plan ~5-8 weeks vacancy on turnover, expect pricing pressure); 50% of comp listings sitting > 30 days — soft ceiling on asking rent; 1,642 units permitted in Lake County in 2024 (14 in 5+ unit buildings).
- This rent runs 35% of the median local income ($61k/yr) — at the standard rent-burdened threshold; future hikes will face affordability resistance.
Forward outlook
- Local home prices are declining (-3.0%/yr); year-one equity from $1k of loan paydown is wiped out by about $6k of value loss. Plan a longer hold.
- Lake County population projected to shrink 7% by 2050 — rents likely to lag national; underwrite the cash flow, not the appreciation.
Negotiation context
- Only 2 days on market — expect competitive offers; lowballing is unlikely to land.
- 4 sale attempts since 19y ago with the ask held roughly flat each time — persistent listings suggest the price (not the market) is what's stuck; bring a comps-based counter.
- Current owner paid $42k; list at $199k implies a 374% gain — meaningful room to come down on a strong offer.
Risks & watch-outs
- Watch-outs: built in 1948 — expect roof / HVAC / electrical / plumbing capex.
- Climate carrying-cost: major wildfire risk — expect insurance premiums to compound above CPI over the hold.
Questions for the listing agent
- Built in 1948 — when were the roof, HVAC, electrical panel, plumbing, and water heater last replaced?
- Is there a deadline driving the sale (1031 exchange, divorce, estate, relocation)? That informs how much negotiation room exists.
- Schools are F-rated, which usually means shorter tenancies and higher turnover. Who's the typical renter profile here, and what's been the actual vacancy rate?
- The area grade is low — what's the realistic commute time and amenity access for the typical tenant pool here? Any planned neighborhood developments (good or bad) we should know about?
- What's the average days-on-market for RENTAL listings here right now (not sales)? A rising rental-DOM trend means longer vacancies and softer asking-rent achievability than the comps imply.
- What's the recent tenant-quality profile in this submarket — average credit score on applications, eviction rate, late-payment / NSF rate, and stable-employment percentage? A property-management company in the area should have these aggregated.
- How much new for-sale + rental construction is in the pipeline within 1–3 miles? Heavy new supply typically softens prices + rents 12–24 months out; constrained supply supports both.
Investment metrics
- 1% rule
- 0.89% ✗
- Cap rate
- 7.31%
- Cash-on-cash
- 3.63%
- DSCR
- 1.16
- GRM
- 9.4
CMA / ARV
- ARV (on-the-fly)
- $202,020
- Comps found
- 12
Show comp detail 12 sales within ~0.75 mi
| Address | Dist | Beds/Ba | Sqft | Sold | Price | $/sf | Match |
|---|---|---|---|---|---|---|---|
| 3301 Parkside Ave | 0.29mi | 3/2.0 | 1,764 (-3%) | 8mo | $282,000 | $160 | 73 |
| 3550 Old Hobart Rd | 0.25mi | 3/1.5 | 1,900 (+4%) | 13mo | $237,555 | $125 | 70 |
| 3125 Old Hobart Rd | 0.44mi | 4/1.5 (+1) | 1,840 (+1%) | 5mo | $181,000 | $98 | 68 |
| 2130 Parke St | 0.53mi | 3/2.0 | 1,854 (+2%) | 7mo | $205,000 | $111 | 65 |
| 4265 E 28th Ave | 0.67mi | 3/2.0 | 1,840 (+1%) | 6mo | $155,000 | $84 | 60 |
| 3540 Old Hobart Rd | 0.30mi | 4/3.0 (+1) | 1,934 (+6%) | 10mo | $270,000 | $140 | 56 |
| 2282 Orange St | 0.40mi | 3/1.5 | 1,656 (-9%) | 14mo | $150,000 | $91 | 55 |
| 3030 E 22nd Ave | 0.48mi | 3/1.0 | 1,558 (-14%) | 13mo | $199,900 | $128 | 41 |
| 2313 E 27 Ave | 0.68mi | 3/1.0 | 1,996 (+10%) | 15mo | $145,000 | $73 | 38 |
| 2713 Union St | 0.66mi | 3/1.5 | 2,076 (+14%) | 16mo | $190,000 | $92 | 33 |
| 4268 E 27th Ln | 0.63mi | 3/2.0 | 2,088 (+15%) | 14mo | $215,000 | $103 | 32 |
| 2984 Miami St | 0.75mi | 4/2.0 (+1) | 2,088 (+15%) | 14mo | $269,999 | $129 | 22 |
Match score weights: distance 35% · size 25% · config 20% · recency 20%. Top-matched comps best support the ARV.
Projected returns pro-forma
-3.0% appreciation · 3.0% rent growth · sell at horizon
- IRR
- -10.6%
- Equity multiple
- 0.61×
- Total profit
- $-21,578
- Equity at exit
- $29,672
- IRR
- -1.4%
- Equity multiple
- 0.91×
- Total profit
- $-5,231
- Equity at exit
- $17,206
Cash invested: $55,720 (down + closing). Projections, not guarantees.
Landlord ↔ Tenant lean methodology
- Overall (STATE)
- 90 Strongly Landlord-Friendly
- State Indiana
- 90 Strongly Landlord-Friendly · R+11
- County
- — inherits STATE
- City
- — inherits STATE
ZIP-level market 46405
- Home prices YoY
- -7.5%
- Active inventory
- 59
- Price-to-rent
- 9.4×
Monthly cashflow live
- Estimated rent
- $1,767 medium interval (Pro) →
- Mortgage (P&I)
- −$1,044
- Tax from tax record
- −$101 /mo · $1,208/yr
- Insurance
- −$83
- HOA
- −$0
- Vacancy / Maint / Mgmt
- −$371
- Net cashflow
- $169
Break-even live
Sensitivity live
| Price | -10% $281 | -5% $225 | +0% $169 | +5% $112 | +10% $56 |
|---|---|---|---|---|---|
| Rent | -10% $29 | -5% $99 | +0% $169 | +5% $238 | +10% $308 |
| Rate | -1.0pp $269 | -0.5pp $219 | base $169 | +0.5pp $117 | +1.0pp $64 |
UW: 25.0% down · 7.5% · 30yr · 1.5% tax · 5.0% vac · 8.0% maint · 8.0% mgmt
Financing live
Cash to close
- Down payment
- $49,750
- Closing costs
- $5,970
- Reserves months
- —
- Total cash needed
- —
Loan-product check · same deal, 3 products live
Conventional
25% down · 7.5% · 30yr
- Down + closing
- —
- Monthly P&I
- —
- Monthly cashflow
- —
- DSCR
- —
- Eligible?
- —
Personal DTI + credit; lowest rate.
DSCR
20% down · 8.5% · 30yr
- Down + closing
- —
- Monthly P&I
- —
- Monthly cashflow
- —
- DSCR
- —
- Eligible?
- —
No personal income docs; deal must DSCR.
Hard money
10% down · 12.0% · 12mo
- Down + closing
- —
- Monthly P&I
- —
- Monthly cashflow
- —
- DSCR
- —
- Eligible?
- —
Short-term bridge; refi at stabilization.
Rent comps 4 comps
| Address | Beds | Baths | Sqft | Rent | $/sqft | DOM | Units | Dist |
|---|---|---|---|---|---|---|---|---|
| 2701 Union St Lake Station, IN | 3.0 | 2.0 | 1958 | $1,700 | $0.87 | 45d | 1 | 0.66mi |
| 2870 Vigo St Lake Station, IN | 3.0 | 2.0 | 1446 | $1,850 | $1.28 | 45d | 1 | 0.87mi |
| 4546 Marquette Rd Lake Station, IN | 3.0 | 2.0 | 1621 | $1,800 | $1.11 | 1d | 1 | 0.91mi |
| 5091 Central Ave Portage, IN | 3.0 | 1.0 | 1644 | $2,000 | $1.22 | 0d | 1 | 1.28mi |
Listing history 2 events
-
2026-06-21remarks 683-char remark
-
2026-06-21$199,000 Active 2 DOM
ⓘ Source: listings_history table (triggers on properties + properties_extension) + one-shot
backfill from property_details.listing_events for pre-trigger history.
Tax reassessment forecast IN · Partial reset (capped growth)
- Current annual tax
- $1,208 · $101/mo
- Projected year-2 tax
- $1,450 · $121/mo
- Expected delta
- +$242/yr (+$20/mo · 20.0%)
ⓘ Screening estimate from a state-policy table — verify with the county assessor before closing.
Climate risk First Street
- Flood 1/10 Low FEMA zone X (unshaded) · 0% chance over 30 yrs
- Wildfire 6/10 Major
- Heat 2/10 Low 7 d/yr ≥102°F today · 15 d/yr by 30 yrs out
- Wind 2/10 Low 0% chance of damaging wind over 30 yrs
- Air quality 4/10 Moderate 5 unhealthy d/yr today · 6 by 30 yrs out
Nearby sold comps map
Loading sold comps map…
Walkable amenities ~0.75 mi
Loading nearby amenities…
Taxation est. · year 1
- Rental income
- $21,200
- − Mortgage interest
- −$11,147
- − Property taxes
- −$1,208
- − Insurance
- −$995
- − Repairs & maintenance
- −$1,696
- − Management
- −$1,696
- − Depreciation
- −$5,789
- Taxable loss
- −$1,331
- Est. tax savings @ 24.0%
- +$319
- After-tax cash flow
- $2,342/yr
For passive investors: Depreciation is non-cash, so a rental often shows a tax loss while cash-flowing — sheltering income. Rental losses are passive: they offset passive income freely, and up to $25,000/yr can offset ordinary (W-2) income if you actively participate and your MAGI is under $100k (phasing out to $0 by $150k); unused losses carry forward. On sale, claimed depreciation is recaptured at up to 25%, and gains may owe capital-gains tax (a 1031 exchange can defer both). Figures are a year-1 estimate at your 24.0% rate — not tax advice; consult a CPA.
Schools (NCES district)
- District
- Lake Station Community Schools
- NCES district ID
- 1802910
- Math proficiency
- 16% ▼ -14.00%
- Reading proficiency
- 24% ▼ -15.00%
- Median HH income
- $41,406
- Composite
- 17.06/100
- National rank
- #9123
- State rank
- #278 of 301 in IN
Livability — Lake Station
- Score
- 63/100
- State rank
- #411
- US rank
- #14929
Category grades
Schools grade is shown separately in the Schools card above.
Census & demographics
- Census place
- Lake Station, IN
- County
- Lake County · 422,878 people
- City population
- 12,184
- Metro
- Chicago-Naperville-Elgin, IL-IN-WI
- Population (ZIP)
- 12,184
- Household income
- $60,881
- Rent vs Own
- Severe rent burden
- 216.0
Population outlook (Lake County) Hauer SSP2
- Today (2025)
- 484,026 people
- By 2030
- 478,091 · -1.2%
- By 2040
- 462,974 · -4.3%
- By 2050
- 449,894 · -7.1%
- By 2075
- 436,169 · -9.9%
- By 2100
- 426,607 · -11.9%
Race, ethnicity, and origin ACS 2023
- Neighborhood character
- Predominantly White (66%)
- Race & ethnicity
- White 66% Hispanic / Latino 28% Two or more races 18% Black 2%
- Hispanic origin (detail)
- Mexican 23% Puerto Rican 3%
- Common ancestry
- Romanian 4% German 4% Slovak 4%
- Foreign-born
- 8% · Canada
- Languages at home
- 83% English-only · Spanish 15% Other Indo-European 1%
Political lean MEDSL · Lake
- 2024 margin
- Lean D (+5.6) · D 52.1% · R 46.5% · Other 1.5%
- 2008→2024 swing
- -28.6pp toward R · 2008: 34.3pp · 2024: 5.6pp
- All cycles
- 2024: D+5.6 2020: D+15.1 2016: D+20.6 2012: D+31.0 2008: D+34.3
Not yet ingested
- Civics
- —
Market trends
- HPI YoY
- ▼ -23.48%
- Current HPI
- 289.0285
- Rent YoY
- —
- Metro
- Chicago-Naperville-Elgin, IL-IN-WI
- State GDP YoY
- ▲ 2.90%
- F500 in state
- 18
Industry mix (Fortune 500 HQ in IN)
| Industry | F500 HQs | Revenue |
|---|---|---|
| Industrial Machinery | 2 | $37B |
|
||
| Healthcare | 1 | $177B |
|
||
| Pharmaceuticals | 1 | $45B |
|
||
| Metals / Steel | 1 | $18B |
|
||
| Agriculture | 1 | $17B |
|
||
| Packaging | 1 | $12B |
|
||
Price history
+99.2% since first listed6 events — show timeline
- 2026-06-19 Listed $199,000 NIRA MLS as Distributed by MLS Grid
- 2018-05-23 Sold (MLS) $42,000 NIRA MLS as Distributed by MLS Grid
- 2017-12-22 Listed $55,000 NIRA MLS as Distributed by MLS Grid
- 2016-09-25 Listing Removed — MIBOR as Distributed by MLS Grid
- 2016-03-25 Listed $56,925 MIBOR as Distributed by MLS Grid
- 2007-03-19 Listed $99,900 NIRA MLS as Distributed by MLS Grid
Property tax history
+1.4%/yrLatest (2024): $1,208 · -4.8% YoY. Source: county tax records.
Cash-flow waterfall
monthlySold comps — $/sqft
last 12 mo · ≤1 miLoading sold comps…