303 S Maple St St · Worthing, SD
Flood risk 1/10 · Minimal
- FEMA flood zone
- X (unshaded)
- Chance of flooding over 30 yrs
- 0.0%
- Est. flood insurance / yr
- $507 – $1,088
Fire risk 3/10 · Minor
- Est. fire insurance / yr
- $1,342 – $2,492
Heat risk 2/10 · Minimal
- Hot days now (above 100°F)
- 7 days/yr
- Hot days in 30 yrs
- 14 days/yr
Wind risk 2/10 · Minimal
- Chance of severe wind over 30 yrs
- —
Air-quality risk 2/10 · Minimal
- Unhealthy air days now
- 1 days/yr
- Unhealthy air days in 30 yrs
- 1 days/yr
Risk factors via First Street. Map © Google.
Why this score? — see what drove the D grade
The composite is a weighted blend of 9 inputs, each scored 0–100. Each bar is that input's sub-score; the figure is the points it added to the 100-point composite (weight × sub-score).
- Cash flow +11.2/30.0
- ARV discount +7.5/15.0
- Schools +5.2/10.0
- Appreciation +5.0/10.0
- Livability +3.6/5.0
- DSCR +3.3/10.0
- 1% rule +2.9/10.0
- Rent growth +2.5/5.0
- Condition / age +2.5/5.0
$138,500
🖨 Deal sheet (PDF) 📄 Offer letter ✓ Due diligence
Key facts
- Floor coverings
- New electrical
- Bathtub
Tags
Property features AI
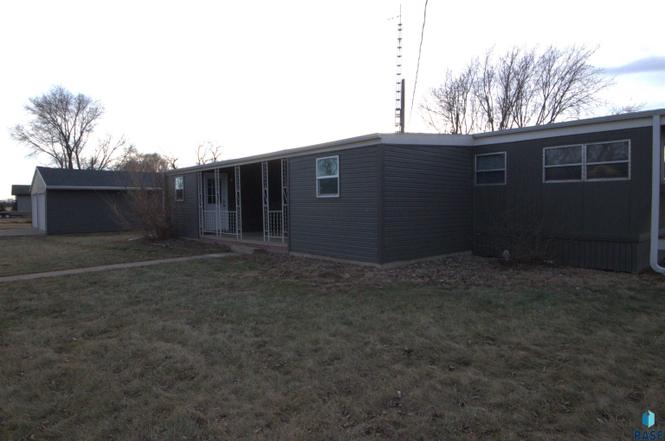
Exterior
- Parking: Detached 2-car garage (approx. 30 x 24) with garage heater, room for garage, and separate workshop; Concrete parking
- Utilities: Public water; Public sewer
- Home design: Mobile home; Ranch style; Above-grade finished area and additional below-grade unfinished area
- Construction: Metal and vinyl siding construction; Block foundation; Composition roof; Land is owned
- Exterior features: Covered patio; City lot; Additional buildings, RV/boat storage, and shed(s)
Interior
- Kitchen: Range; Refrigerator; Stove hood
- Bedrooms: Main-level master bedroom (approx. 10 x 11); Basement bedroom with built-in closet (approx. 6 x 9)
- Flooring: Carpet; Concrete; Vinyl
- Bathrooms: One full bathroom
- Heating & cooling: Natural gas heating; Central air; Natural gas water heater
- Interior features: Main floor laundry; Master bedroom on main level; Open-concept living room to kitchen; Partial basement
- Laundry & utility: Main floor laundry
Neighborhood map
What this means for you Summary
Snapshot
- This is a 2-bed/1.0-bath other listed at $138k.
Deal economics
- At list price, monthly cash flow is $-53 ($-631/yr) — negative.
- To cash-flow at today's rent, offer at most $129k (6.7% below list).
- To meet the 1% rule (rent ≥ 1% of price), the offer needs to be $109k (21.3% below list).
- Recommended offer: $109k (21.3% below list) — sets the bar for 1% rule.
Location & tenants
- Location reads 72/100 on livability (#44 in SD) — a middle-class / working-renter tenant base. Strengths: crime A+, employment A+, cost of living A+; Watch: amenities F, commute F, health & safety D-.
- Lennox School District 41-4 (rural): math 56% / reading 64% proficiency, ranked #5 of 59 in SD (top 8%) — acceptable for families but not a draw, mixed tenant base, ~2y average lease; only 12% free/reduced lunch — higher-income household profile.
- Zoned schools: Worthing Elementary - 05 (math 64% / reading 64%, grade B, #39 of 253 statewide, top 19%, 126 students, 5% FRL); Lennox Jr. High - 08 (math 57% / reading 67%, grade B+, #13 of 143 statewide, top 11%, 189 students, 15% FRL); Lennox High School - 01 (math 32% / reading 77%, grade C-, #53 of 151 statewide, top 41%, 359 students, 14% FRL) — zoned schools at 11% FRL track the district average.
- Market conditions: 1 active listings in the ZIP; 232 units permitted in Lincoln County in 2024 (14 in 5+ unit buildings).
Forward outlook
- In year one you build about $5k of equity ($958 loan paydown + $4k appreciation (3.0% local appreciation)).
- Lincoln County population projected at +66% by 2050 — long-run rental-demand tailwind backs the buy-and-hold thesis.
- At projected returns (3.0% appreciation + 3.0% rent growth), your $39k cash investment doubles in ~7 years — after that, you're playing with house money.
- By year 7, paydown + projected appreciation supports a ~$32k cash-out refi (75% LTV) — recoverable capital for the next deal without selling this one.
Negotiation context
- It's been on market 107 days — a 9% lower offer ($126k) is reasonable based on typical stale-listing flexibility.
- 2 sale attempts since 4y ago with the ask held roughly flat each time — persistent listings suggest the price (not the market) is what's stuck; bring a comps-based counter.
Questions for the listing agent
- What do current leases actually rent for vs. the listed asking? Can we see a recent rent roll and the last 12 months of T-12 income?
- It's been on market 107 days. Have you received any prior offers? Is the seller open to a 21% concession, seller financing, or rate buy-down credit?
- Built in 1964 — when were the roof, HVAC, electrical panel, plumbing, and water heater last replaced?
- Why hasn't it sold? Are there any deal-killer items the seller is aware of (foundation, flood, title, zoning, code violations)?
- Is there a deadline driving the sale (1031 exchange, divorce, estate, relocation)? That informs how much negotiation room exists.
- The area grade is low — what's the realistic commute time and amenity access for the typical tenant pool here? Any planned neighborhood developments (good or bad) we should know about?
- What's the average days-on-market for RENTAL listings here right now (not sales)? A rising rental-DOM trend means longer vacancies and softer asking-rent achievability than the comps imply.
- What's the recent tenant-quality profile in this submarket — average credit score on applications, eviction rate, late-payment / NSF rate, and stable-employment percentage? A property-management company in the area should have these aggregated.
- How much new for-sale + rental construction is in the pipeline within 1–3 miles? Heavy new supply typically softens prices + rents 12–24 months out; constrained supply supports both.
Investment metrics
- 1% rule
- 0.79% ✗
- Cap rate
- 5.84%
- Cash-on-cash
- -1.63%
- DSCR
- 0.93
- GRM
- 10.6
CMA / ARV
No comps found within radius.
Projected returns pro-forma
3.0% appreciation · 3.0% rent growth · sell at horizon
- IRR
- 6.0%
- Equity multiple
- 1.34×
- Total profit
- $13,324
- Equity at exit
- $62,276
- IRR
- 8.9%
- Equity multiple
- 2.34×
- Total profit
- $52,135
- Equity at exit
- $95,974
Cash invested: $38,780 (down + closing). Projections, not guarantees.
Landlord ↔ Tenant lean methodology
- Overall (STATE)
- 83 Strongly Landlord-Friendly
- State South Dakota
- 83 Strongly Landlord-Friendly · R+16
- County
- — inherits STATE
- City
- — inherits STATE
ZIP-level market 57077-2051
- Active inventory
- 1
- Price-to-rent
- 10.6×
Monthly cashflow live
- Estimated rent
- $1,090 medium interval (Pro) →
- Mortgage (P&I)
- −$726
- Tax from tax record
- −$130 /mo · $1,561/yr
- Insurance
- −$58
- HOA
- −$0
- Vacancy / Maint / Mgmt
- −$229
- Net cashflow
- $-53
Break-even live
Sensitivity live
| Price | -10% $26 | -5% $-13 | +0% $-53 | +5% $-92 | +10% $-131 |
|---|---|---|---|---|---|
| Rent | -10% $-139 | -5% $-96 | +0% $-53 | +5% $-10 | +10% $34 |
| Rate | -1.0pp $17 | -0.5pp $-17 | base $-53 | +0.5pp $-88 | +1.0pp $-125 |
UW: 25.0% down · 7.5% · 30yr · 1.5% tax · 5.0% vac · 8.0% maint · 8.0% mgmt
Financing live
Cash to close
- Down payment
- $34,625
- Closing costs
- $4,155
- Reserves months
- —
- Total cash needed
- —
Loan-product check · same deal, 3 products live
Conventional
25% down · 7.5% · 30yr
- Down + closing
- —
- Monthly P&I
- —
- Monthly cashflow
- —
- DSCR
- —
- Eligible?
- —
Personal DTI + credit; lowest rate.
DSCR
20% down · 8.5% · 30yr
- Down + closing
- —
- Monthly P&I
- —
- Monthly cashflow
- —
- DSCR
- —
- Eligible?
- —
No personal income docs; deal must DSCR.
Hard money
10% down · 12.0% · 12mo
- Down + closing
- —
- Monthly P&I
- —
- Monthly cashflow
- —
- DSCR
- —
- Eligible?
- —
Short-term bridge; refi at stabilization.
Listing history 5 events
-
2026-04-30status Pending
-
2026-01-13$138,500 Active
-
2022-09-12historical
-
2022-08-08price $139,900
-
2022-06-22$159,900 Active - New
ⓘ Source: listings_history table (triggers on properties + properties_extension) + one-shot
backfill from property_details.listing_events for pre-trigger history.
Tax reassessment forecast SD · Resets to sale price
- Current annual tax
- $1,561 · $130/mo
- Projected year-2 tax
- $1,814 · $151/mo
- Expected delta
- +$253/yr (+$21/mo · 16.2%)
ⓘ Screening estimate from a state-policy table — verify with the county assessor before closing.
Climate risk First Street
- Flood 1/10 Low FEMA zone X (unshaded) · 0% chance over 30 yrs
- Wildfire 3/10 Moderate
- Heat 2/10 Low 7 d/yr ≥100°F today · 14 d/yr by 30 yrs out
- Wind 2/10 Low
- Air quality 2/10 Low 1 unhealthy d/yr today · 1 by 30 yrs out
Nearby sold comps map
Loading sold comps map…
Walkable amenities ~0.75 mi
Loading nearby amenities…
Taxation est. · year 1
- Rental income
- $13,086
- − Mortgage interest
- −$7,758
- − Property taxes
- −$1,561
- − Insurance
- −$692
- − Repairs & maintenance
- −$1,047
- − Management
- −$1,047
- − Depreciation
- −$4,029
- Taxable loss
- −$3,049
- Est. tax savings @ 24.0%
- +$732
- After-tax cash flow
- $100/yr
For passive investors: Depreciation is non-cash, so a rental often shows a tax loss while cash-flowing — sheltering income. Rental losses are passive: they offset passive income freely, and up to $25,000/yr can offset ordinary (W-2) income if you actively participate and your MAGI is under $100k (phasing out to $0 by $150k); unused losses carry forward. On sale, claimed depreciation is recaptured at up to 25%, and gains may owe capital-gains tax (a 1031 exchange can defer both). Figures are a year-1 estimate at your 24.0% rate — not tax advice; consult a CPA.
Schools (NCES district)
- District
- Lennox School District 41-4
- NCES district ID
- 4641550
- Math proficiency
- 56% ▲ 3.00%
- Reading proficiency
- 64% ▲ 2.00%
- Median HH income
- $63,780
- Composite
- 52.37/100
- National rank
- #1584
- State rank
- #5 of 59 in SD
Livability — Worthing
- Score
- 72/100
- State rank
- #44
- US rank
- #6285
Category grades
Schools grade is shown separately in the Schools card above.
Census & demographics
- Census place
- Worthing, SD
Population outlook (Lincoln County) Hauer SSP2
- Today (2025)
- 70,138 people
- By 2030
- 78,929 · +12.5%
- By 2040
- 97,132 · +38.5%
- By 2050
- 116,136 · +65.6%
- By 2075
- 166,314 · +137.1%
- By 2100
- 219,430 · +212.9%
Not yet ingested
- Political lean
- —
- Race & ethnicity
- —
- Common origin
- —
- Civics
- —
Market trends
- HPI YoY
- —
- Current HPI
- —
- Rent YoY
- —
- Metro
- —
- State GDP YoY
- ▲ 0.70%
- F500 in state
- 2
Industry mix (Fortune 500 HQ in SD)
| Industry | F500 HQs | Revenue |
|---|---|---|
| Utilities | 1 | $1B |
|
||
Price history
-13.4% since first listed5 events — show timeline
- 2026-04-30 Pending — REALTOR® Association of the Sioux Empire
- 2026-01-13 Listed $138,500 REALTOR® Association of the Sioux Empire
- 2022-09-12 Listing Removed — REALTOR® Association of the Sioux Empire
- 2022-08-08 Price Changed $139,900 REALTOR® Association of the Sioux Empire
- 2022-06-22 Listed $159,900 REALTOR® Association of the Sioux Empire
Property tax history
+43.0%/yrLatest (2025): $1,561 · +0.8% YoY. Source: county tax records.
Cash-flow waterfall
monthlySold comps — $/sqft
last 12 mo · ≤1 miLoading sold comps…