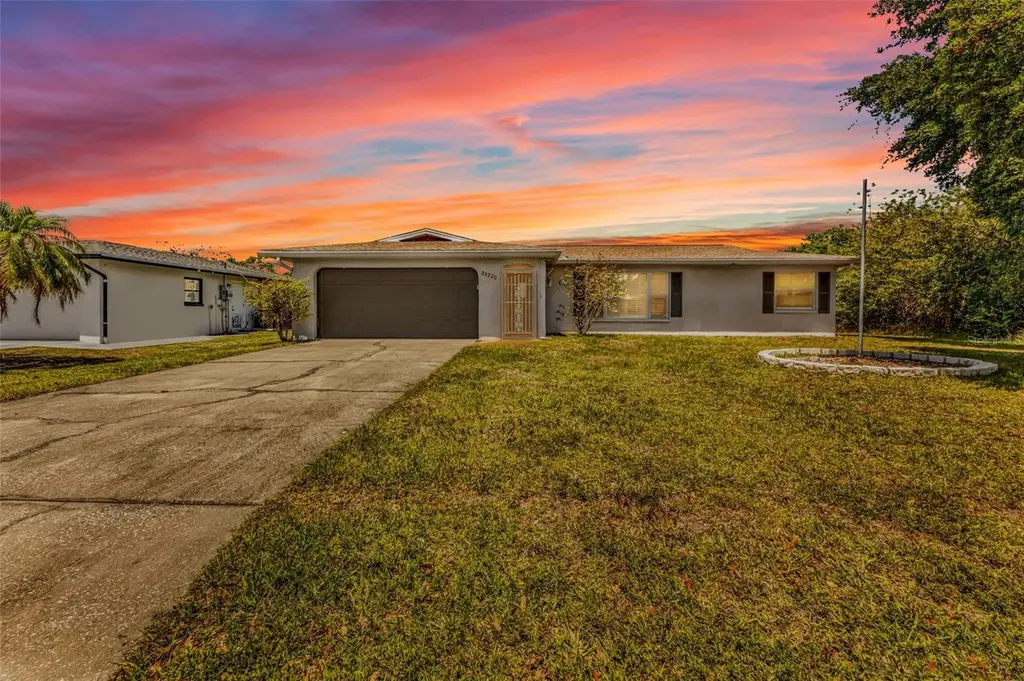
23220 Rountree Ave · Port Charlotte, FL
Flood risk 7/10 · Major
- FEMA flood zone
- X (shaded)
- Chance of flooding over 30 yrs
- 0.76%
- Est. flood insurance / yr
- $507 – $1,088
Fire risk 1/10 · Minimal
- Est. fire insurance / yr
- $947 – $1,759
Heat risk 10/10 · Severe
- Hot days now (above 107°F)
- 7 days/yr
- Hot days in 30 yrs
- 28 days/yr
Wind risk 10/10 · Severe
- Chance of severe wind over 30 yrs
- 99.0%
Air-quality risk 3/10 · Minor
- Unhealthy air days now
- 2 days/yr
- Unhealthy air days in 30 yrs
- 2 days/yr
Risk factors via First Street. Map © Google.
Why this score? — see what drove the D+ grade
The composite is a weighted blend of 9 inputs, each scored 0–100. Each bar is that input's sub-score; the figure is the points it added to the 100-point composite (weight × sub-score).
- Cash flow +14.1/30.0
- ARV discount +13.6/15.0
- Schools +4.6/10.0
- 1% rule +4.5/10.0
- DSCR +4.3/10.0
- Livability +3.2/5.0
- Condition / age +2.5/5.0
- Rent growth +1.5/5.0
- Appreciation +0.0/10.0
$199,000
🖨 Deal sheet 📄 Offer letter ✓ Due diligence
Listing remarks
Under contract-accepting backup offers. PRICED TO SELL- 2 Bedroom, 2 Bathroom, 2 Car Garage POOL HOME in the heart of Port Charlotte welcomes new owners to make it shine once again! This property features impact windows in front of home, including an impact-rated garage door, a roof replaced approximately three years ago, and an HVAC system installed four years ago. Additional highlights include underground utilities and a 10’ x 10’ insulated shed for added storage or workspace. Offering strong structural updates and a solid foundation, the home presents an excellent opportunity for a new owner to enhance and personalize with cosmetic improvements. Ideally situated on a quiet st
Key facts
- Roof replaced
- Insulated shed
- Impact windows
Tags
Property features AI
Finance
- Other: Property type: Residential, single family; Lot approximately 0.23 acre (about 80 x 125); Private in-ground gunite pool with screen enclosure (approx. 12 x 24); Additional building area: shed(s)
- HOA & community: No association
Exterior
- Parking: Attached 2-car garage (approx. 23 x 19); Driveway and off-street parking
- Utilities: Public water; Septic tank; Cable available; Electricity connected; Water connected
- Home design: Single family residence; One story; Faces south
- Construction: Block and stucco construction; Shingle roof; Slab foundation; Built on one level
- Exterior features: Covered patio; Rear porch; Screened enclosure; French doors; Exterior storage/shed(s); Wood fencing; Level, paved lot
Interior
- Kitchen: Dishwasher; Microwave; Range; Refrigerator
- Bedrooms: 2 bedrooms
- Flooring: Carpet; Laminate; Tile
- Bathrooms: 2 full bathrooms
- Heating & cooling: Central heating (electric); Central air; Wall/window unit(s)
- Interior features: Ceiling fans; Walk-in closet(s); Drapes and window treatments; Family room; Inside utility/storage
- Laundry & utility: Inside laundry room
Neighborhood map
What this means for you Summary
Snapshot
- This is a 2-bed/2.0-bath single-family listed at $199k.
Deal economics
- At list price, monthly cash flow is $-36 ($-437/yr) — negative.
- To cash-flow at today's rent, offer at most $193k (3.2% below list).
- To meet the 1% rule (rent ≥ 1% of price), the offer needs to be $190k (4.6% below list).
- Recommended offer: $190k (4.6% below list) — sets the bar for 1% rule.
- Cap rate 6.5% vs local median 4.4% in Port Charlotte — top-decile yield for the area; either an underpriced asset or a hidden risk that comps aren't pricing in. Stress-test before assuming the spread holds.
Location & tenants
- Location reads 65/100 on livability (#655 in FL) — a middle-class / working-renter tenant base. Strengths: cost of living A+, housing A+; Watch: employment D, amenities F, commute F.
- Charlotte (suburban): math 54% / reading 54% proficiency, ranked #22 of 73 in FL (top 30%) — acceptable for families but not a draw, mixed tenant base, ~2y average lease.
- Zoned schools: Kingsway Elementary School (math 55% / reading 53%, grade C, #936 of 2,144 statewide, top 44%, 596 students, 58% FRL); Charlotte High School (math 44% / reading 46%, grade D-, #228 of 667 statewide, top 35%, 1,994 students, 41% FRL) — zoned schools at 49% FRL track the district average.
- Market conditions: Rents falling (-4.0%/yr); 600 active listings in the ZIP; 28 comparable units currently listed for rent nearby; rentals at typical pace (median 21d on market — plan ~3-4 weeks tenant-placement turnaround); 4,585 units permitted in Charlotte County in 2024 (703 in 5+ unit buildings).
- This rent runs 36% of the median local income ($64k/yr) — at the standard rent-burdened threshold; future hikes will face affordability resistance.
Forward outlook
- Local home prices are declining (-3.0%/yr); year-one equity from $1k of loan paydown is wiped out by about $6k of value loss. Plan a longer hold.
- Charlotte County population projected at +24% by 2050 — long-run rental-demand tailwind backs the buy-and-hold thesis.
Negotiation context
- It's been on market 47 days — a 3% lower offer ($193k) is reasonable based on typical stale-listing flexibility.
- 5 sale attempts since 4y ago; this cycle's ask has dropped $31k (13%) from the opening price — seller is motivated, your offer sets the floor, not the list.
- Current owner paid $120k; list at $199k implies a 66% gain — meaningful room to come down on a strong offer.
Risks & watch-outs
- Watch-outs: flood insurance adds $66/mo.
- Climate carrying-cost: major flood risk; severe wind risk, 99% chance of damaging wind over 30y; extreme-heat days projected 7→28/yr by 2055 (HVAC capex compounding) — expect insurance premiums to compound above CPI over the hold.
Questions for the listing agent
- What do current leases actually rent for vs. the listed asking? Can we see a recent rent roll and the last 12 months of T-12 income?
- It's been on market 47 days. Have you received any prior offers? Is the seller open to a 5% concession, seller financing, or rate buy-down credit?
- Built in 1979 — when were the roof, HVAC, electrical panel, plumbing, and water heater last replaced?
- What's the actual annual flood-insurance premium (NFIP or private), and is the property in a SFHA with mandatory coverage?
- Is there a deadline driving the sale (1031 exchange, divorce, estate, relocation)? That informs how much negotiation room exists.
- Schools are D-rated, which usually means shorter tenancies and higher turnover. Who's the typical renter profile here, and what's been the actual vacancy rate?
- The area grade is low — what's the realistic commute time and amenity access for the typical tenant pool here? Any planned neighborhood developments (good or bad) we should know about?
- What's the average days-on-market for RENTAL listings here right now (not sales)? A rising rental-DOM trend means longer vacancies and softer asking-rent achievability than the comps imply.
- What's the recent tenant-quality profile in this submarket — average credit score on applications, eviction rate, late-payment / NSF rate, and stable-employment percentage? A property-management company in the area should have these aggregated.
- How much new for-sale + rental construction is in the pipeline within 1–3 miles? Heavy new supply typically softens prices + rents 12–24 months out; constrained supply supports both.
Investment metrics
- 1% rule
- 0.95% ✗
- Cap rate
- 6.47%
- Cash-on-cash
- 0.65%
- DSCR
- 1.03
- GRM
- 8.7
CMA / ARV
- ARV (on-the-fly)
- $230,376
- Comps found
- 9
Show comp detail 9 sales within ~0.75 mi
| Address | Dist | Beds/Ba | Sqft | Sold | Price | $/sf | Match |
|---|---|---|---|---|---|---|---|
| 3085 Crowder St | 0.09mi | 2/2.0 | 1,362 (+3%) | 11mo | $199,000 | $146 | 82 |
| 23142 Hemenway Ave | 0.28mi | 3/2.0 (+1) | 1,398 (+6%) | 5mo | $220,000 | $157 | 69 |
| 3080 Saint James St | 0.33mi | 3/2.0 (+1) | 1,398 (+6%) | 11mo | $277,000 | $198 | 61 |
| 22486 Olean Blvd | 0.47mi | 2/2.0 | 1,217 (-8%) | 5mo | $205,000 | $168 | 61 |
| 22549 Bolanos Ct | 0.65mi | 2/2.0 | 1,217 (-8%) | 7mo | $230,000 | $189 | 50 |
| 23188 Elmira Blvd | 0.68mi | 3/2.0 (+1) | 1,345 (+2%) | 14mo | $125,000 | $93 | 49 |
| 22374 New York Ave | 0.72mi | 2/2.0 | 1,327 (+0%) | 21mo | $350,000 | $264 | 48 |
| 23279 Burlingame Ave | 0.66mi | 2/2.0 | 1,180 (-11%) | 8mo | $210,000 | $178 | 44 |
| 22417 Oceanside Ave | 0.66mi | 3/2.0 (+1) | 1,206 (-9%) | 21mo | $209,900 | $174 | 32 |
Match score weights: distance 35% · size 25% · config 20% · recency 20%. Top-matched comps best support the ARV.
Projected returns pro-forma
-3.0% appreciation · 0.0% rent growth · sell at horizon
- IRR
- -21.4%
- Equity multiple
- 0.28×
- Total profit
- $-40,001
- Equity at exit
- $29,672
- IRR
- -25.7%
- Equity multiple
- -0.06×
- Total profit
- $-58,801
- Equity at exit
- $17,206
Cash invested: $55,720 (down + closing). Projections, not guarantees.
Landlord ↔ Tenant lean methodology
- Overall (STATE)
- 87 Strongly Landlord-Friendly
- State Florida
- 87 Strongly Landlord-Friendly · R+3
- County
- — inherits STATE
- City
- — inherits STATE
ZIP-level market 33980
- Home prices YoY
- -5.0%
- Rents YoY
- -4.0%
- Active inventory
- 600
- Price-to-rent
- 8.7×
Monthly cashflow live
- Estimated rent
- $1,899 high interval (Pro) →
- Mortgage (P&I)
- −$1,044
- Tax from tax record
- −$343 /mo · $4,121/yr
- Insurance
- −$83
- Flood insurance flood zone
- −$66 /mo · $798/yr
- HOA
- −$0
- Vacancy / Maint / Mgmt
- −$399
- Net cashflow
- $-36
Break-even live
UW: 25.0% down · 7.5% · 30yr · 1.5% tax · 5.0% vac · 8.0% maint · 8.0% mgmt
Financing live
Cash to close
- Down payment
- $49,750
- Closing costs
- $5,970
- Reserves months
- —
- Total cash needed
- —
Loan-product check · same deal, 3 products live
Conventional
25% down · 7.5% · 30yr
- Down + closing
- —
- Monthly P&I
- —
- Monthly cashflow
- —
- DSCR
- —
- Eligible?
- —
Personal DTI + credit; lowest rate.
DSCR
20% down · 8.5% · 30yr
- Down + closing
- —
- Monthly P&I
- —
- Monthly cashflow
- —
- DSCR
- —
- Eligible?
- —
No personal income docs; deal must DSCR.
Hard money
10% down · 12.0% · 12mo
- Down + closing
- —
- Monthly P&I
- —
- Monthly cashflow
- —
- DSCR
- —
- Eligible?
- —
Short-term bridge; refi at stabilization.
Rent comps 28 comps
| Address | Beds | Baths | Sqft | Rent | $/sqft | DOM | Units | Dist |
|---|---|---|---|---|---|---|---|---|
| 3185 Clifford St Port Charlotte, FL | 3.0 | 2.0 | 1776 | $2,400 | $1.35 | 13d | 1 | 0.41mi |
| 2421 Ivanhoe St Port Charlotte, FL | 2.0 | 2.0 | 1396 | $3,300 | $2.36 | 13d | 1 | 0.50mi |
| 2451 Aquilos Ct Port Charlotte, FL | 2.0 | 2.0 | 1307 | $2,000 | $1.53 | 13d | 1 | 0.61mi |
| 24145 Green Heron Dr Port Charlotte, FL | 2.0 | 2.0 | 1512 | $1,900 | $1.26 | 21d | 1 | 0.72mi |
| 23067 Elmira Blvd Punta Gorda, FL | 2.0 | 2.0 | 1052 | $1,750 | $1.66 | 21d | 1 | 0.77mi |
| 24055 Peaceful Brook Loop Punta Gorda, FL | 3.0–5.0 | 2.0–3.0 | 2138 | $2,183 | $1.02 | 13d | 4 | 0.87mi |
| 2377 Starlite Ln Port Charlotte, FL | 3.0 | 1.5 | 1253 | $1,575 | $1.26 | 21d | 1 | 1.09mi |
| 22497 Glen Ave Punta Gorda, FL | 3.0 | 2.0 | 1628 | $1,875 | $1.15 | 21d | 1 | 1.11mi |
| 22153 Olean Blvd Port Charlotte, FL | 2.0 | 2.0 | 1337 | $1,425 | $1.07 | 21d | 1 | 1.16mi |
| 1516 Abel St Port Charlotte, FL | 3.0 | 2.0 | 1874 | $2,200 | $1.17 | 21d | 1 | 1.18mi |
| 22148 Lockport Ave Port Charlotte, FL | 3.0 | 2.0 | 1760 | $1,850 | $1.05 | 13d | 1 | 1.19mi |
| 1636 Hayworth Rd Port Charlotte, FL | 2.0 | 2.0 | 884 | $1,300 | $1.47 | 21d | 1 | 1.25mi |
| 22328 Yonkers Ave Port Charlotte, FL | 2.0 | 2.0 | 1342 | $1,575 | $1.17 | 21d | 1 | 1.25mi |
| 22481 Westchester Blvd Unit B48 Punta Gorda, FL | 2.0 | 2.0 | 1046 | $1,150 | $1.10 | 21d | 1 | 1.26mi |
| 4022 Beaver Ln Port Charlotte, FL | 2.0 | 2.0 | 960 | $1,300 | $1.35 | 21d | 2 | 1.27mi |
| 22481 Westchester Blvd Unit B40 Punta Gorda, FL | 2.0 | 2.0 | 1046 | $1,225 | $1.17 | 13d | 1 | 1.27mi |
| 22481 Westchester Blvd Unit B35 Punta Gorda, FL | 2.0 | 2.0 | 1046 | $1,275 | $1.22 | 21d | 1 | 1.28mi |
| 22481 Westchester Blvd Unit B36 Port Charlotte, FL | 2.0 | 2.0 | 1046 | $1,180 | $1.13 | 13d | 1 | 1.29mi |
| 22086 Beverly Ave Port Charlotte, FL | 2.0 | 1.0 | 1031 | $1,250 | $1.21 | 21d | 1 | 1.30mi |
| 22017 Beverly Ave Port Charlotte, FL | 3.0 | 2.0 | 1472 | $1,600 | $1.09 | 13d | 1 | 1.30mi |
| 22441 Westchester Blvd Unit 1500G Punta Gorda, FL | 2.0 | 2.0 | 960 | $1,200 | $1.25 | 13d | 1 | 1.30mi |
| 4158 Tamiami Trl Unit M4 Port Charlotte, FL | 2.0 | 2.0 | 919 | $1,500 | $1.63 | 21d | 1 | 1.40mi |
| 22291 Westchester Blvd Port Charlotte, FL | 2.0 | 2.0 | 960 | $1,425 | $1.48 | 21d | 2 | 1.40mi |
| 22291 Westchester Blvd Port Charlotte, FL | 2.0 | 2.0 | 960 | $1,400 | $1.46 | 13d | 3 | 1.40mi |
| 1999 Kings Hwy Port Charlotte, FL | 2.0 | 1.0–2.0 | 906 | $1,800 | $1.99 | 21d | 2 | 1.45mi |
| 4024 Oakview Dr Unit I3 Punta Gorda, FL | 2.0 | 2.0 | 893 | $1,900 | $2.13 | 21d | 1 | 1.46mi |
| 4016 Oakview Dr Unit J9 Punta Gorda, FL | 2.0 | 2.0 | 893 | $2,400 | $2.69 | 21d | 1 | 1.47mi |
| 3281 Easy St Port Charlotte, FL | 3.0 | 2.0 | 1196 | $1,750 | $1.46 | 13d | 1 | 1.49mi |
Listing history 23 events
-
2026-06-15status $199,000 Pending 47 DOM
-
2026-06-15days on market $199,000 Active 47 DOM
-
2026-06-14days on market $199,000 Active 45 DOM
-
2026-06-13pricestatus $199,000 Active 44 DOM
-
2026-06-07statusdays on market $225,000 Pending 44 DOM
-
2026-06-05days on market $225,000 Active 43 DOM
-
2026-06-03days on market $225,000 Active 42 DOM
-
2026-06-02days on market $225,000 Active 41 DOM
-
2026-06-01days on market $225,000 Active 40 DOM
-
2026-05-31days on market $225,000 Active 39 DOM
-
2026-05-30days on market $225,000 Active 38 DOM
-
2026-05-04price $225,000
-
2026-04-22$230,000 Active
-
2025-08-23historical
-
2025-08-22status Active
-
2025-08-22status Pending
-
2025-05-23$249,500 Active
-
2022-10-31status Active
-
2022-08-15status Pending
-
2022-05-18$299,000 Active
-
2005-05-03soldstatus $120,000
-
2000-10-18soldstatus $82,900
-
1989-02-01soldstatus $65,000
ⓘ Source: listings_history table (triggers on properties + properties_extension) + one-shot
backfill from property_details.listing_events for pre-trigger history.
Tax reassessment forecast FL · Resets to sale price
- Current annual tax
- $4,121 · $343/mo
- Projected year-2 tax
- $4,121 · $343/mo
- Expected delta
- $0/yr ($0/mo · 0.0%)
ⓘ Screening estimate from a state-policy table — verify with the county assessor before closing.
Climate risk First Street
- Flood 7/10 Severe FEMA zone X (shaded) · 76% chance over 30 yrs
- Wildfire 1/10 Low
- Heat 10/10 Extreme 7 d/yr ≥107°F today · 28 d/yr by 30 yrs out
- Wind 10/10 Extreme 99% chance of damaging wind over 30 yrs
- Air quality 3/10 Moderate 2 unhealthy d/yr today · 2 by 30 yrs out
Nearby sold comps map
Loading sold comps map…
Walkable amenities ~0.75 mi
Loading nearby amenities…
Taxation est. · year 1
- Rental income
- $22,785
- − Mortgage interest
- −$11,147
- − Property taxes
- −$4,121
- − Insurance
- −$1,792
- − Repairs & maintenance
- −$1,823
- − Management
- −$1,823
- − Depreciation
- −$5,789
- Taxable loss
- −$3,711
- Est. tax savings @ 24.0%
- +$891
- After-tax cash flow
- $454/yr
For passive investors: Depreciation is non-cash, so a rental often shows a tax loss while cash-flowing — sheltering income. Rental losses are passive: they offset passive income freely, and up to $25,000/yr can offset ordinary (W-2) income if you actively participate and your MAGI is under $100k (phasing out to $0 by $150k); unused losses carry forward. On sale, claimed depreciation is recaptured at up to 25%, and gains may owe capital-gains tax (a 1031 exchange can defer both). Figures are a year-1 estimate at your 24.0% rate — not tax advice; consult a CPA.
Schools (NCES district)
- District
- Charlotte
- NCES district ID
- 1200240
- Math proficiency
- 54% ▼ -6.00%
- Reading proficiency
- 54% ▼ -1.00%
- Median HH income
- $44,864
- Composite
- 45.62/100
- National rank
- #2586
- State rank
- #22 of 73 in FL
Livability — Port Charlotte
- Score
- 65/100
- State rank
- #655
- US rank
- #13081
Category grades
Schools grade is shown separately in the Schools card above.
Census & demographics
- Census place
- Port Charlotte, FL
- County
- Charlotte County · 196,994 people
- City population
- 102,180
- Metro
- Punta Gorda, FL
- Population (ZIP)
- 13,120
- Household income
- $63,591
- Rent vs Own
- Severe rent burden
- 612.0
Population outlook (Charlotte County) Hauer SSP2
- Today (2025)
- 198,646 people
- By 2030
- 210,507 · +6.0%
- By 2040
- 230,857 · +16.2%
- By 2050
- 247,148 · +24.4%
- By 2075
- 281,777 · +41.8%
- By 2100
- 293,609 · +47.8%
Race, ethnicity, and origin ACS 2023
- Neighborhood character
- Predominantly White (75%)
- Race & ethnicity
- White 75% Hispanic / Latino 10% Two or more races 10% Black 9%
- Hispanic origin (detail)
- Puerto Rican 3% Cuban 2% Dominican 2%
- Common ancestry
- Romanian 5% Hispanic 4% Slovak 3%
- Foreign-born
- 16% · Canada, Jamaica
- Languages at home
- 85% English-only · Spanish 8% French/Haitian/Cajun 5% German/W. Germanic 1%
Political lean MEDSL · Charlotte
- 2024 margin
- Solid R (+34.0) · D 32.7% · R 66.7%
- 2008→2024 swing
- -26.7pp toward R · 2008: -7.2pp · 2024: -34.0pp
- All cycles
- 2024: R+34.0 2020: R+26.6 2016: R+27.8 2012: R+14.3 2008: R+7.2
Not yet ingested
- Civics
- —
Market trends
- HPI YoY
- ▼ -16.02%
- Current HPI
- 306.3331
- Rent YoY
- ▼ -4.04%
- Metro
- Punta Gorda, FL
- State GDP YoY
- ▲ 3.28%
- F500 in state
- 36
Industry mix (Fortune 500 HQ in FL)
| Industry | F500 HQs | Revenue |
|---|---|---|
| Industrial Technology | 2 | $29B |
|
||
| Insurance | 2 | $17B |
|
||
| Retail | 1 | $60B |
|
||
| Technology Distribution | 1 | $58B |
|
||
| Homebuilding | 1 | $35B |
|
||
| Technology Manufacturing | 1 | $35B |
|
||
Price history
+246.2% since first listed12 events — show timeline
- 2026-05-04 Price Changed $225,000 Stellar MLS as Distributed by MLS Grid
- 2026-04-22 Listed $230,000 Stellar MLS as Distributed by MLS Grid
- 2025-08-23 Listing Removed — Stellar MLS as Distributed by MLS Grid
- 2025-08-22 Relisted — Stellar MLS as Distributed by MLS Grid
- 2025-08-22 Pending — Stellar MLS as Distributed by MLS Grid
- 2025-05-23 Listed $249,500 Stellar MLS as Distributed by MLS Grid
- 2022-10-31 Relisted — Stellar MLS as Distributed by MLS Grid
- 2022-08-15 Pending — Stellar MLS as Distributed by MLS Grid
- 2022-05-18 Listed $299,000 Stellar MLS as Distributed by MLS Grid
- 2005-05-03 Sold (Public Records) $120,000 Public Records
- 2000-10-18 Sold (Public Records) $82,900 Public Records
- 1989-02-01 Sold (Public Records) $65,000 Public Records
Property tax history
+18.2%/yrLatest (2025): $4,121 · -5.4% YoY. Source: county tax records.
Cash-flow waterfall
monthlySold comps — $/sqft
last 12 mo · ≤1 miLoading sold comps…