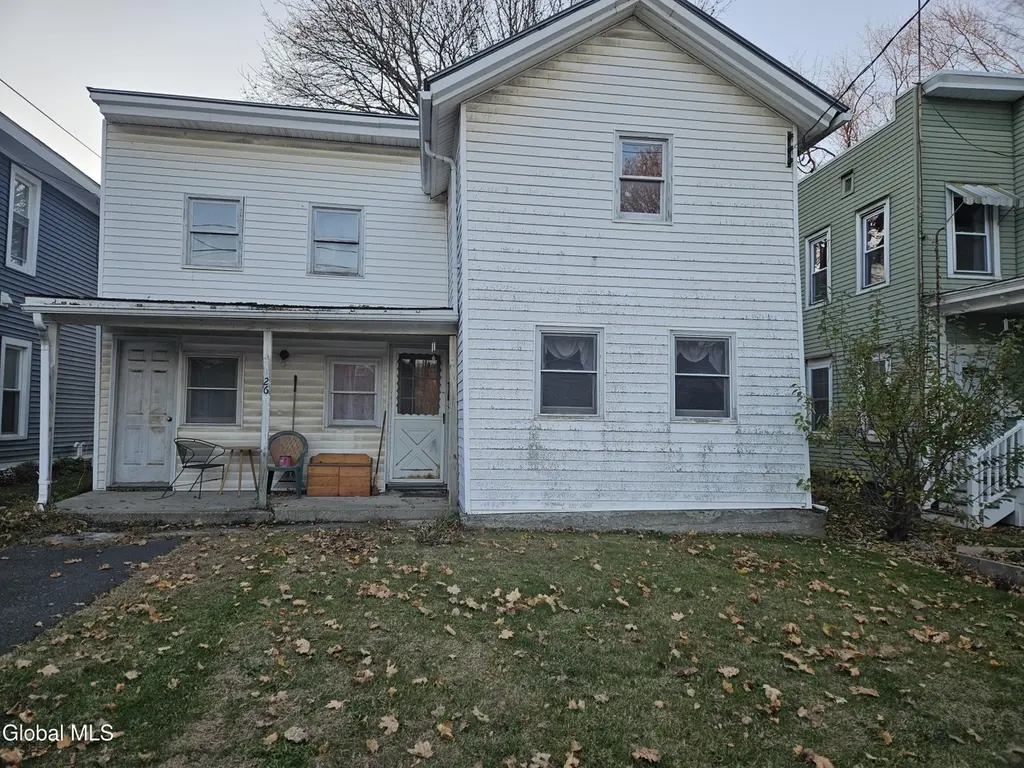
26 Lyman St · Hoosick Falls, NY
Flood risk 1/10 · Minimal
- FEMA flood zone
- X (unshaded)
- Chance of flooding over 30 yrs
- 0.0%
- Est. flood insurance / yr
- $473 – $860
Fire risk 4/10 · Minor
- Est. fire insurance / yr
- $691 – $1,283
Heat risk 3/10 · Minor
- Hot days now (above 94°F)
- 7 days/yr
- Hot days in 30 yrs
- 17 days/yr
Wind risk 3/10 · Minor
- Chance of severe wind over 30 yrs
- 6.0%
Air-quality risk 2/10 · Minimal
- Unhealthy air days now
- 1 days/yr
- Unhealthy air days in 30 yrs
- 1 days/yr
Risk factors via First Street. Map © Google.
Why this score? — see what drove the B+ grade
The composite is a weighted blend of 9 inputs, each scored 0–100. Each bar is that input's sub-score; the figure is the points it added to the 100-point composite (weight × sub-score).
- Cash flow +29.1/30.0
- 1% rule +10.0/10.0
- DSCR +10.0/10.0
- ARV discount +7.5/15.0
- Appreciation +5.5/10.0
- Schools +4.4/10.0
- Livability +3.6/5.0
- Rent growth +2.5/5.0
- Condition / age +2.5/5.0
$105,000
🖨 Deal sheet (PDF) 📄 Offer letter ✓ Due diligence
Listing remarks MLS
Nice village home ,upstairs will need total remodel all gutted and ready for your touch.
Key facts
- 4,356 sq ft lot
- Parking
- Built 1850
Neighborhood map
What this means for you Summary
Snapshot
- This is a 4-bed/2.0-bath single-family listed at $105k.
Deal economics
- At list price, monthly cash flow is $364 ($4k/yr) — positive.
- The deal already cash-flows at list — no discount required.
- Meets the 1% rule at list price ($2k rent vs $105k).
- Recommended offer: $92k (12.0% below list) — sets the bar for market timing.
- Cap rate 10.5% vs local median 4.7% in Hoosick Falls — top-decile yield for the area; either an underpriced asset or a hidden risk that comps aren't pricing in. Stress-test before assuming the spread holds.
Location & tenants
- Location reads 72/100 on livability (#371 in NY) — a middle-class / working-renter tenant base. Strengths: housing A+, health & safety A+, cost of living A; Watch: amenities F, commute F.
- Hoosick Falls Central School District (rural): math 52% / reading 46% proficiency, ranked #469 of 755 in NY (top 62%) — families likely to look elsewhere, expect single-tenant / working-renter base with shorter leases.
- Market conditions: 49 active listings in the ZIP; 405 units permitted in Rensselaer County in 2024 (224 in 5+ unit buildings).
Forward outlook
- In year one you build about $2k of equity ($726 loan paydown + $1k appreciation (1.0% local appreciation)).
- Rensselaer County population projected to shrink 6% by 2050 — rents likely to lag national; underwrite the cash flow, not the appreciation.
- At projected returns (1.0% appreciation + 3.0% rent growth), your $29k cash investment doubles in ~5 years — after that, you're playing with house money.
Negotiation context
- It's been on market 210 days — a 12% lower offer ($92k) is reasonable based on typical stale-listing flexibility.
Risks & watch-outs
- Watch-outs: property tax is 3.2% of price; built in 1850 — expect roof / HVAC / electrical / plumbing capex.
Questions for the listing agent
- It's been on market 210 days. Have you received any prior offers? Is the seller open to a 12% concession, seller financing, or rate buy-down credit?
- Built in 1850 — when were the roof, HVAC, electrical panel, plumbing, and water heater last replaced?
- Property tax is high relative to price — has the assessment been appealed recently, and will the sale trigger a re-assessment?
- Why hasn't it sold? Are there any deal-killer items the seller is aware of (foundation, flood, title, zoning, code violations)?
- Is there a deadline driving the sale (1031 exchange, divorce, estate, relocation)? That informs how much negotiation room exists.
- What's the average days-on-market for RENTAL listings here right now (not sales)? A rising rental-DOM trend means longer vacancies and softer asking-rent achievability than the comps imply.
- What's the recent tenant-quality profile in this submarket — average credit score on applications, eviction rate, late-payment / NSF rate, and stable-employment percentage? A property-management company in the area should have these aggregated.
- How much new for-sale + rental construction is in the pipeline within 1–3 miles? Heavy new supply typically softens prices + rents 12–24 months out; constrained supply supports both.
Investment metrics
- 1% rule
- 1.50% ✓
- Cap rate
- 10.45%
- Cash-on-cash
- 14.86%
- DSCR
- 1.66
- GRM
- 5.6
CMA / ARV
- ARV (median comp)
- $226,593
- List price
- $105,000
- Delta
- -53.66%
- Verdict
- UNDERPRICED
- Comps
- 20 within 1.0 mi
Show comp detail 12 sales within ~0.75 mi
| Address | Dist | Beds/Ba | Sqft | Sold | Price | $/sf | Match |
|---|---|---|---|---|---|---|---|
| 37 Center St | 0.29mi | 4/2.0 | 1,892 (+2%) | 7mo | $197,000 | $104 | 78 |
| 31 Lyman St | 0.03mi | 3/1.5 (-1) | 1,990 (+7%) | 6mo | $195,500 | $98 | 74 |
| 157 Church St | 0.45mi | 4/1.5 | 1,978 (+6%) | 4mo | $85,000 | $43 | 63 |
| 61 High St | 0.38mi | 3/1.5 (-1) | 1,738 (-6%) | 7mo | $165,000 | $95 | 59 |
| 79 High St | 0.41mi | 3/2.0 (-1) | 1,755 (-6%) | 9mo | $309,000 | $176 | 59 |
| 44 Hoosick St | 0.41mi | 4/2.0 | 1,695 (-9%) | 12mo | $154,000 | $91 | 56 |
| 118 Main St | 0.33mi | 3/1.5 (-1) | 1,684 (-9%) | 8mo | $255,000 | $151 | 56 |
| 72 Wilder Ave | 0.48mi | 3/1.0 (-1) | 1,762 (-5%) | 11mo | $125,000 | $71 | 51 |
| 18 Carey Ave | 0.49mi | 4/2.0 | 1,636 (-12%) | 9mo | $79,500 | $49 | 50 |
| 44 Ball St | 0.67mi | 5/1.0 (+1) | 1,956 (+5%) | 9mo | $249,000 | $127 | 43 |
| 2 Cummings St | 0.54mi | 3/1.5 (-1) | 1,597 (-14%) | 8mo | $305,000 | $191 | 37 |
| 26 Seward St | 0.56mi | 3/2.0 (-1) | 1,600 (-14%) | 12mo | $215,000 | $134 | 36 |
Match score weights: distance 35% · size 25% · config 20% · recency 20%. Top-matched comps best support the ARV.
Projected returns pro-forma
1.02% appreciation · 3.0% rent growth · sell at horizon
- IRR
- 16.9%
- Equity multiple
- 1.86×
- Total profit
- $25,367
- Equity at exit
- $35,956
- IRR
- 20.2%
- Equity multiple
- 3.46×
- Total profit
- $72,264
- Equity at exit
- $47,869
Cash invested: $29,400 (down + closing). Projections, not guarantees.
Landlord ↔ Tenant lean methodology
- Overall (STATE)
- 15 Strongly Tenant-Friendly
- State New York
- 15 Strongly Tenant-Friendly · D+10
- County
- — inherits STATE
- City
- — inherits STATE
ZIP-level market 12090
- Home prices YoY
- 0.5%
- Active inventory
- 49
- Price-to-rent
- 5.6×
Monthly cashflow live
- Estimated rent
- $1,573 medium interval (Pro) →
- Mortgage (P&I)
- −$551
- Tax from tax record
- −$284 /mo · $3,410/yr
- Insurance
- −$44
- HOA
- −$0
- Vacancy / Maint / Mgmt
- −$330
- Net cashflow
- $364
Break-even live
Sensitivity live
| Price | -10% $423 | -5% $394 | +0% $364 | +5% $334 | +10% $305 |
|---|---|---|---|---|---|
| Rent | -10% $240 | -5% $302 | +0% $364 | +5% $426 | +10% $488 |
| Rate | -1.0pp $417 | -0.5pp $391 | base $364 | +0.5pp $337 | +1.0pp $309 |
UW: 25.0% down · 7.5% · 30yr · 1.5% tax · 5.0% vac · 8.0% maint · 8.0% mgmt
Financing live
Cash to close
- Down payment
- $26,250
- Closing costs
- $3,150
- Reserves months
- —
- Total cash needed
- —
Loan-product check · same deal, 3 products live
Conventional
25% down · 7.5% · 30yr
- Down + closing
- —
- Monthly P&I
- —
- Monthly cashflow
- —
- DSCR
- —
- Eligible?
- —
Personal DTI + credit; lowest rate.
DSCR
20% down · 8.5% · 30yr
- Down + closing
- —
- Monthly P&I
- —
- Monthly cashflow
- —
- DSCR
- —
- Eligible?
- —
No personal income docs; deal must DSCR.
Hard money
10% down · 12.0% · 12mo
- Down + closing
- —
- Monthly P&I
- —
- Monthly cashflow
- —
- DSCR
- —
- Eligible?
- —
Short-term bridge; refi at stabilization.
Listing history 17 events
-
2026-06-19days on market $105,000 Active 210 DOM
-
2026-06-18days on market $105,000 Active 209 DOM
-
2026-06-17days on market $105,000 Active 208 DOM
-
2026-06-16days on market $105,000 Active 207 DOM
-
2026-06-15days on market $105,000 Active 206 DOM
-
2026-06-14days on market $105,000 Active 204 DOM
-
2026-06-12days on market $105,000 Active 203 DOM
-
2026-06-09days on market $105,000 Active 200 DOM
-
2026-06-08days on market $105,000 Active 199 DOM
-
2026-06-07days on market $105,000 Active 198 DOM
-
2026-06-04days on market $105,000 Active 194 DOM
-
2026-06-02days on market $105,000 Active 193 DOM
-
2026-06-01days on market $105,000 Active 192 DOM
-
2026-05-31days on market $105,000 Active 191 DOM
-
2026-05-31days on market $105,000 Active 190 DOM
-
2026-05-01price $105,000 88-char remark
Show marketing remark (88 chars)
Nice village home ,upstairs will need total remodel all gutted and ready for your touch.
-
2025-11-19$114,000 Active 88-char remark
Show marketing remark (88 chars)
Nice village home ,upstairs will need total remodel all gutted and ready for your touch.
ⓘ Source: listings_history table (triggers on properties + properties_extension) + one-shot
backfill from property_details.listing_events for pre-trigger history.
Tax reassessment forecast NY · Partial reset (capped growth)
- Current annual tax
- $3,410 · $284/mo
- Projected year-2 tax
- $3,410 · $284/mo
- Expected delta
- $0/yr ($0/mo · 0.0%)
ⓘ Screening estimate from a state-policy table — verify with the county assessor before closing.
Climate risk First Street
- Flood 1/10 Low FEMA zone X (unshaded) · 0% chance over 30 yrs
- Wildfire 4/10 Moderate
- Heat 3/10 Moderate 7 d/yr ≥94°F today · 17 d/yr by 30 yrs out
- Wind 3/10 Moderate 6% chance of damaging wind over 30 yrs
- Air quality 2/10 Low 1 unhealthy d/yr today · 1 by 30 yrs out
Nearby sold comps map
Loading sold comps map…
Walkable amenities ~0.75 mi
Loading nearby amenities…
Taxation est. · year 1
- Rental income
- $18,874
- − Mortgage interest
- −$5,882
- − Property taxes
- −$3,410
- − Insurance
- −$525
- − Repairs & maintenance
- −$1,510
- − Management
- −$1,510
- − Depreciation
- −$3,055
- Taxable income
- $2,983
- Est. tax owed @ 24.0%
- −$716
- After-tax cash flow
- $3,652/yr
For passive investors: Depreciation is non-cash, so a rental often shows a tax loss while cash-flowing — sheltering income. Rental losses are passive: they offset passive income freely, and up to $25,000/yr can offset ordinary (W-2) income if you actively participate and your MAGI is under $100k (phasing out to $0 by $150k); unused losses carry forward. On sale, claimed depreciation is recaptured at up to 25%, and gains may owe capital-gains tax (a 1031 exchange can defer both). Figures are a year-1 estimate at your 24.0% rate — not tax advice; consult a CPA.
Schools (NCES district)
- District
- Hoosick Falls Central School District
- NCES district ID
- 3614760
- Math proficiency
- 52% ▲ 5.00%
- Reading proficiency
- 46% ▬ 0.00%
- Median HH income
- $54,349
- Composite
- 44.44/100
- National rank
- #6093
- State rank
- #469 of 755 in NY
Livability — Hoosick Falls
- Score
- 72/100
- State rank
- #371
- US rank
- #6412
Category grades
Schools grade is shown separately in the Schools card above.
Census & demographics
- Census place
- Hoosick Falls, NY
- Population (ZIP)
- 5,874
Population outlook (Rensselaer County) Hauer SSP2
- Today (2025)
- 162,400 people
- By 2030
- 161,746 · -0.4%
- By 2040
- 158,095 · -2.7%
- By 2050
- 152,966 · -5.8%
- By 2075
- 140,767 · -13.3%
- By 2100
- 124,727 · -23.2%
Race, ethnicity, and origin ACS 2023
- Neighborhood character
- Predominantly White (93%)
- Race & ethnicity
- White 93% Hispanic / Latino 5% Two or more races 2%
- Common ancestry
- Romanian 6% Lithuanian 5% Iranian 3%
- Foreign-born
- 2% · Canada
- Languages at home
- 94% English-only · Spanish 2% German/W. Germanic 1% Russian/Polish/Slavic 1%
Political lean MEDSL · Rensselaer
- 2024 margin
- Toss-up / Even · D 50.7% · R 49.3%
- 2008→2024 swing
- -8.0pp toward R · 2008: 9.3pp · 2024: 1.4pp
- All cycles
- 2024: D+1.4 2020: D+5.6 2016: R+2.9 2012: D+11.8 2008: D+9.3
Not yet ingested
- Civics
- —
Market trends
- HPI YoY
- ▲ 1.02%
- Current HPI
- 218.9096
- Rent YoY
- —
- Metro
- —
- State GDP YoY
- ▲ 2.60%
- F500 in state
- 92
Industry mix (Fortune 500 HQ in NY)
| Industry | F500 HQs | Revenue |
|---|---|---|
| Financial Services | 10 | $950B |
|
||
| Consumer Goods | 9 | $162B |
|
||
| Insurance | 4 | $225B |
|
||
| Telecommunications | 2 | $144B |
|
||
| Pharmaceuticals | 2 | $112B |
|
||
| Media / Entertainment | 2 | $69B |
|
||
Price history
-7.9% since first listed2 events — show timeline
- 2026-05-01 Price Changed $105,000 Global MLS
- 2025-11-19 Listed $114,000 Global MLS
Property tax history
+5.7%/yrLatest (2025): $3,410 · -2.8% YoY. Source: county tax records.
Cash-flow waterfall
monthlySold comps — $/sqft
last 12 mo · ≤1 miLoading sold comps…