20281 E Country Club Dr #207 · Aventura, FL
Flood risk 8/10 · Major
- FEMA flood zone
- AE
- Chance of flooding over 30 yrs
- 0.97%
- Est. flood insurance / yr
- $1,737 – $8,500
Fire risk 1/10 · Minimal
- Est. fire insurance / yr
- $947 – $1,759
Heat risk 10/10 · Severe
- Hot days now (above 103°F)
- 6 days/yr
- Hot days in 30 yrs
- 21 days/yr
Wind risk 10/10 · Severe
- Chance of severe wind over 30 yrs
- 99.0%
Air-quality risk 2/10 · Minimal
- Unhealthy air days now
- 1 days/yr
- Unhealthy air days in 30 yrs
- 2 days/yr
Risk factors via First Street. Map © Google.
Why this score? — see what drove the F grade
The composite is a weighted blend of 9 inputs, each scored 0–100. Each bar is that input's sub-score; the figure is the points it added to the 100-point composite (weight × sub-score).
- ARV discount +7.5/15.0
- 1% rule +6.9/10.0
- Cash flow +6.5/30.0
- Schools +4.2/10.0
- Livability +4.0/5.0
- Condition / age +2.5/5.0
- Rent growth +2.1/5.0
- DSCR +0.8/10.0
- Appreciation +0.0/10.0
$595,000
🖨 Deal sheet 📄 Offer letter ✓ Due diligence
Listing remarks
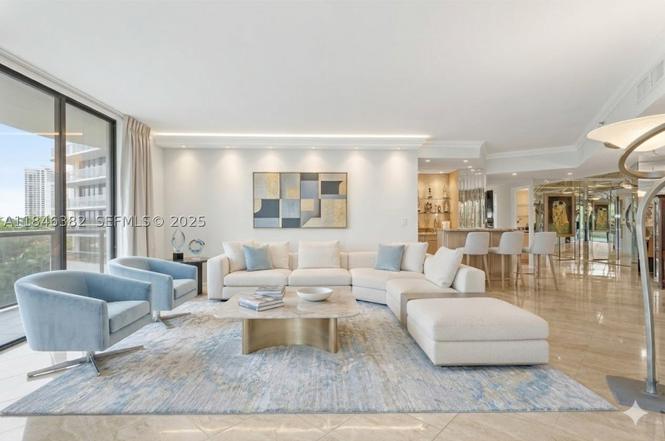
Over 2,000 sq ft of beautifully updated living space with a huge private patio and direct pool access! Enjoy a renovated kitchen, modern bathrooms, spacious living room with wet bar, and a separate dining area. The oversized primary suite fits a king bed, dresser, sofa, and includes a large walk-in closet. Located on Aventura’s scenic 3.5-mile trail, walkable to worship and the mall. Luxury amenities: 2 pools, gym, spa, tennis, squash, movie theater, café, salon & private restaurant.
Key facts
- Wet bar
- Private patio
- Renovated kitchen
Tags
Property features AI
Finance
- Financial info: Pets allowed conditionally (restrictions may apply)
- HOA & community: Monthly association fee (includes management, amenities, common areas, cable TV, internet, grounds and structure maintenance, parking, pest control, pool(s), recreation facilities, sewer, trash); Association amenities include clubhouse, fitness center, pool, spa/hot tub, tennis courts, basketball court, billiard room, bike storage, elevator(s), and transportation service
Exterior
- Parking: 2 covered garage spaces; Guest parking; Multiple parking spaces; Valet
- Security: Complex fenced; Key card entry; Secured lobby; Security guard; Smoke detectors
- Utilities: Water: waterfront with Intracoastal access; Pool heated by association
- Home design: Attached property; Entry on level 2
- Construction: Block construction; Resale unit; 26-story building
- Exterior features: Barbecue area; Porch; Patio; Wrap-around porch/patio; Storm/security shutters; Association pool (heated)
Interior
- Kitchen: Built-in oven; Self-cleaning oven; Microwave; Refrigerator; Icemaker; Dishwasher; Disposal
- Bedrooms: At least one bedroom on the main level
- Flooring: Carpet; Ceramic tile; Marble
- Bathrooms: Two full bathrooms; One half bathroom
- Heating & cooling: Central heating (electric); Central air conditioning (electric)
- Interior features: Blinds on windows; Bidet; Built-in features and bar; Breakfast area; Dual sinks; First floor entry; Jetted tub; Living/dining room; Separate shower; Walk-in closet(s)
- Laundry & utility: Washer; Dryer
Neighborhood map
What this means for you Summary
Snapshot
- This is a 3-bed/2.0-bath condo listed at $595k.
Deal economics
- At list price, monthly cash flow is $-1k ($-17k/yr) — negative.
- The deal already cash-flows at list — no discount required.
- Meets the 1% rule at list price ($7k rent vs $595k).
- Recommended offer: $524k (12.0% below list) — sets the bar for market timing.
- Cap rate 4.3% vs local median 2.6% in Aventura — top-decile yield for the area; either an underpriced asset or a hidden risk that comps aren't pricing in. Stress-test before assuming the spread holds.
Location & tenants
- Location reads 80/100 on livability (#127 in FL, #1,834 nationally) — a professional / high-income tenant draw. Strengths: schools A+, health & safety A+, amenities A; Watch: crime D+, cost of living F.
- Miami-Dade (suburban): math 45% / reading 54% proficiency, ranked #40 of 73 in FL (top 55%) — families likely to look elsewhere, expect single-tenant / working-renter base with shorter leases; 64% free/reduced lunch — lower-income household profile, screen leases tightly.
- Market conditions: Rents soft (-1.5%/yr); 985 active listings in the ZIP; 40 comparable units currently listed for rent nearby; rentals at typical pace (median 21d on market — plan ~3-4 weeks tenant-placement turnaround); solid renter incomes; 10,051 units permitted in Miami-Dade County in 2024 (7,758 in 5+ unit buildings).
- At $7,064/mo this rent would consume 93% of the median local household income ($91k/yr) (locally 1838% of renters already pay >50% of income on rent) — very limited rent-growth headroom before tenants either downsize or default.
Forward outlook
- Local home prices are declining (-3.0%/yr); year-one equity from $4k of loan paydown is wiped out by about $18k of value loss. Plan a longer hold.
- Miami-Dade County population projected at +28% by 2050 — long-run rental-demand tailwind backs the buy-and-hold thesis.
Negotiation context
- It's been on market 328 days — a 12% lower offer ($524k) is reasonable based on typical stale-listing flexibility.
- 4 sale attempts since 3y ago; this cycle's ask has dropped $93k (14%) from the opening price — seller is motivated, your offer sets the floor, not the list.
- Current owner paid $280k; list at $595k implies a 112% gain — meaningful room to come down on a strong offer.
Risks & watch-outs
- Watch-outs: flood insurance adds $427/mo; HOA is 34% of rent.
- Climate carrying-cost: in FEMA flood zone AE (mandatory federal flood insurance); severe wind risk, 99% chance of damaging wind over 30y; extreme-heat days projected 6→21/yr by 2055 (HVAC capex compounding) — expect insurance premiums to compound above CPI over the hold.
Questions for the listing agent
- What do current leases actually rent for vs. the listed asking? Can we see a recent rent roll and the last 12 months of T-12 income?
- It's been on market 328 days. Have you received any prior offers? Is the seller open to a 12% concession, seller financing, or rate buy-down credit?
- What's the actual annual flood-insurance premium (NFIP or private), and is the property in a SFHA with mandatory coverage?
- What does the HOA fee cover, when was the last increase, and are there any pending special assessments or reserve-fund shortfalls?
- Any open or pending special assessments — roof, HVAC, plumbing, elevator, façade? What's the per-unit balance and payoff schedule, and is the seller paying it off at close or rolling it to the buyer?
- Why hasn't it sold? Are there any deal-killer items the seller is aware of (foundation, flood, title, zoning, code violations)?
- Is there a deadline driving the sale (1031 exchange, divorce, estate, relocation)? That informs how much negotiation room exists.
- Schools are A-rated — typically a magnet for longer-tenancy family renters. What's the average tenant stay here, and is there a school-zone premium baked into asking?
- Crime grade is D in this area — have there been break-ins, vandalism, or insurance claims at this property in the last 3 years? What carrier currently insures it and at what premium?
- The area grade is low — what's the realistic commute time and amenity access for the typical tenant pool here? Any planned neighborhood developments (good or bad) we should know about?
- What's the average days-on-market for RENTAL listings here right now (not sales)? A rising rental-DOM trend means longer vacancies and softer asking-rent achievability than the comps imply.
- What's the recent tenant-quality profile in this submarket — average credit score on applications, eviction rate, late-payment / NSF rate, and stable-employment percentage? A property-management company in the area should have these aggregated.
- How much new apartment / multifamily construction is in the pipeline within 1–3 miles? Heavy new supply (>2% of stock underway) typically softens rents 12–24 months out; light construction supports rent growth.
Investment metrics
- 1% rule
- 1.19% ✓
- Cap rate
- 4.25%
- Cash-on-cash
- -7.29%
- DSCR
- 0.68
- GRM
- 7.0
CMA / ARV
No comps found within radius.
Projected returns pro-forma
-3.0% appreciation · 0.0% rent growth · sell at horizon
- IRR
- -41.6%
- Equity multiple
- -0.24×
- Total profit
- $-206,829
- Equity at exit
- $88,716
- IRR
- —
- Equity multiple
- -1.22×
- Total profit
- $-370,370
- Equity at exit
- $51,445
Cash invested: $166,600 (down + closing). Projections, not guarantees.
Landlord ↔ Tenant lean methodology
- Overall (STATE)
- 87 Strongly Landlord-Friendly
- State Florida
- 87 Strongly Landlord-Friendly · R+3
- County
- — inherits STATE
- City
- — inherits STATE
ZIP-level market 33180
- Rents YoY
- -1.5%
- Active inventory
- 985
- Price-to-rent
- 7.0×
Monthly cashflow live
- Estimated rent
- $7,064 high interval (Pro) →
- Mortgage (P&I)
- −$3,120
- Tax from tax record
- −$806 /mo · $9,671/yr
- Insurance
- −$248
- Flood insurance flood zone
- −$427 /mo · $5,118/yr
- HOA est. from 2 same-building comps
- −$2,418
- Vacancy / Maint / Mgmt
- −$1,483
- Net cashflow
- $-1,438
Break-even live
UW: 25.0% down · 7.5% · 30yr · 1.5% tax · 5.0% vac · 8.0% maint · 8.0% mgmt
Financing live
Cash to close
- Down payment
- $148,750
- Closing costs
- $17,850
- Reserves months
- —
- Total cash needed
- —
Loan-product check · same deal, 3 products live
Conventional
25% down · 7.5% · 30yr
- Down + closing
- —
- Monthly P&I
- —
- Monthly cashflow
- —
- DSCR
- —
- Eligible?
- —
Personal DTI + credit; lowest rate.
DSCR
20% down · 8.5% · 30yr
- Down + closing
- —
- Monthly P&I
- —
- Monthly cashflow
- —
- DSCR
- —
- Eligible?
- —
No personal income docs; deal must DSCR.
Hard money
10% down · 12.0% · 12mo
- Down + closing
- —
- Monthly P&I
- —
- Monthly cashflow
- —
- DSCR
- —
- Eligible?
- —
Short-term bridge; refi at stabilization.
Rent comps 40 comps
| Address | Beds | Baths | Sqft | Rent | $/sqft | DOM | Units | Dist |
|---|---|---|---|---|---|---|---|---|
| 20824 NE 37th Ave Unit 20824 Aventura, FL | 3.0 | 4.0 | 2800 | $25,000 | $8.93 | 24d | 1 | 0.25mi |
| 19955 NE 38th Ct #2106 Aventura, FL | 3.0 | 4.5 | 2860 | $20,000 | $6.99 | 18d | 1 | 0.33mi |
| 636 Hibiscus Dr Hallandale Beach, FL | 4.0 | 3.5 | 2753 | $15,000 | $5.45 | 24d | 1 | 0.77mi |
| 3180 S Ocean Dr Hallandale Beach, FL | 2.0–3.0 | 2.0 | 1285 | $4,000 | $3.11 | 24d | 3 | 0.79mi |
| 3180 S Ocean Dr Hallandale Beach, FL | 2.0–3.0 | 2.0 | 1263 | $4,000 | $3.17 | 20d | 2 | 0.79mi |
| 2069 S Ocean Dr Unit TH12 Hallandale Beach, FL | 3.0 | 3.0 | 1500 | $4,800 | $3.20 | 24d | 1 | 0.87mi |
| 2069 S Ocean Dr Unit TH16 Hallandale Beach, FL | 3.0 | 3.0 | 1614 | $4,500 | $2.79 | 24d | 1 | 0.87mi |
| 2069 S Ocean Dr Unit TH16 Hallandale Beach, FL | 3.0 | 3.0 | 1614 | $4,500 | $2.79 | 3d | 1 | 0.87mi |
| 2069 S Ocean Dr Unit TH12 Hallandale Beach, FL | 3.0 | 3.0 | 1500 | $4,800 | $3.20 | 10d | 1 | 0.87mi |
| 2080 S Ocean Dr Hallandale Beach, FL | 2.0–3.0 | 2.0–2.5 | 1270 | $7,500 | $5.91 | 24d | 7 | 0.88mi |
| 2080 S Ocean Dr Hallandale Beach, FL | 2.0–3.0 | 2.0–2.5 | 1270 | $7,500 | $5.91 | 3d | 11 | 0.88mi |
| 2000 S Ocean Dr Unit 8A Hallandale Beach, FL | 3.0 | 3.5 | 2530 | $20,000 | $7.91 | 4d | 1 | 0.98mi |
| 2000 S Ocean Dr Unit 28A Hallandale Beach, FL | 3.0 | 3.5 | 2913 | $22,000 | $7.55 | 24d | 1 | 0.98mi |
| 2000 S Ocean Dr Unit 5A Hallandale Beach, FL | 4.0 | 3.5 | 2913 | $18,000 | $6.18 | 22d | 1 | 0.98mi |
| 2000 S Ocean Dr Unit 8A Hallandale Beach, FL | 3.0 | 3.5 | 2530 | $20,000 | $7.91 | 24d | 1 | 0.98mi |
| 1985 S Ocean Dr Unit 22E Hallandale Beach, FL | 3.0 | 2.5 | 1780 | $5,900 | $3.31 | 7d | 1 | 1.00mi |
| 1985 S Ocean Dr Unit 22E Hallandale Beach, FL | 3.0 | 2.5 | 1780 | $5,900 | $3.31 | 24d | 1 | 1.00mi |
| 1980 S Ocean Dr Unit 15Q Hallandale Beach, FL | 3.0 | 2.5 | 1740 | $4,250 | $2.44 | 24d | 1 | 1.00mi |
| 18975 Collins Ave Sunny Isles Beach, FL | 3.0–5.0 | 3.0–5.5 | 2885 | $22,000 | $7.62 | 10d | 8 | 1.05mi |
| 18975 Collins Ave Sunny Isles Beach, FL | 3.0–5.0 | 3.0–5.5 | 3160 | $22,000 | $6.96 | 2d | 10 | 1.05mi |
| 1950 S Ocean Dr Unit 19E Hallandale Beach, FL | 3.0 | 2.5 | 1780 | $4,000 | $2.25 | 24d | 1 | 1.09mi |
| 1950 S Ocean Dr Unit LE Hallandale Beach, FL | 3.0 | 2.5 | 1780 | $4,500 | $2.53 | 24d | 1 | 1.09mi |
| 1950 S Ocean Dr Unit 19E Hallandale Beach, FL | 3.0 | 2.5 | 1780 | $4,000 | $2.25 | 7d | 1 | 1.09mi |
| 1945 S Ocean Dr Hallandale Beach, FL | 2.0–3.0 | 2.0–3.0 | 1542 | $4,800 | $3.11 | 7d | 2 | 1.10mi |
| 1945 S Ocean Dr Hallandale Beach, FL | 2.0–3.0 | 2.0–3.0 | 1542 | $4,800 | $3.11 | 15d | 3 | 1.10mi |
| 1945 S Ocean Dr Hallandale Beach, FL | 2.0–3.0 | 2.0–2.5 | 1522 | $4,500 | $2.96 | 18d | 3 | 1.10mi |
| 1945 S Ocean Dr Hallandale Beach, FL | 2.0–3.0 | 2.0–3.0 | 1542 | $4,800 | $3.11 | 12d | 2 | 1.10mi |
| 1920 S Ocean Dr Unit 17D Hallandale Beach, FL | 2.0 | 2.0 | 1955 | $4,250 | $2.17 | 24d | 1 | 1.17mi |
| 1880 N Ocean Dr Unit TS601 Hallandale Beach, FL | 3.0 | 3.0 | 1940 | $7,000 | $3.61 | 24d | 1 | 1.23mi |
| 1890 S Ocean Dr #4 Hallandale Beach, FL | 3.0 | 3.0 | 1920 | $6,800 | $3.54 | 2d | 1 | 1.25mi |
| 1890 S Ocean Dr #703 Hallandale Beach, FL | 2.0 | 2.5 | 1600 | $5,000 | $3.12 | 24d | 1 | 1.25mi |
| 468 Golden Isles Dr Unit 202 Hallandale Beach, FL | 3.0 | 2.5 | 2300 | $5,800 | $2.52 | 24d | 1 | 1.27mi |
| 18501 Collins Ave Sunny Isles Beach, FL | 3.0–4.0 | 4.5–5.5 | 3107 | $30,000 | $9.66 | 24d | 2 | 1.32mi |
| 5000 Island Estates Dr #606 Aventura, FL | 3.0 | 4.5 | 2670 | $21,000 | $7.87 | 24d | 1 | 1.34mi |
| 5500 Island Estates Dr #507 Aventura, FL | 3.0 | 4.5 | 2626 | $23,500 | $8.95 | 3d | 1 | 1.34mi |
| 5500 Island Estates Dr #507 Aventura, FL | 3.0 | 4.5 | 2626 | $23,500 | $8.95 | 5d | 1 | 1.34mi |
| 5000 Island Estates Dr #606 Aventura, FL | 3.0 | 4.5 | 2670 | $19,900 | $7.45 | 10d | 1 | 1.34mi |
| 5000 Island Estates Dr #606 Aventura, FL | 3.0 | 4.5 | 2670 | $19,900 | $7.45 | 7d | 1 | 1.34mi |
| 1850 S Ocean Dr #1410 Hallandale Beach, FL | 2.0 | 2.0 | 1782 | $6,500 | $3.65 | 3d | 1 | 1.35mi |
| 1850 S Ocean Dr #1105 Hallandale Beach, FL | 2.0 | 2.0 | 1782 | $7,000 | $3.93 | 17d | 1 | 1.35mi |
HOA detail condo
- Monthly dues
- $0 · $0/yr
- Likely covers
- poolgym
- Assessments
- None detected in remarks — confirm with the listing agent.
Listing history 35 events
-
2026-06-18days on market $595,000 Active 328 DOM
-
2026-06-17days on market $595,000 Active 327 DOM
-
2026-06-16days on market $595,000 Active 326 DOM
-
2026-06-15days on market $595,000 Active 325 DOM
-
2026-06-13days on market $595,000 Active 323 DOM
-
2026-06-09days on market $595,000 Active 319 DOM
-
2026-06-08days on market $595,000 Active 318 DOM
-
2026-06-08days on market $595,000 Active 317 DOM
-
2026-06-04days on market $595,000 Active 314 DOM
-
2026-06-03days on market $595,000 Active 313 DOM
-
2026-06-02days on market $595,000 Active 312 DOM
-
2026-06-01days on market $595,000 Active 311 DOM
-
2026-05-31days on market $595,000 Active 310 DOM
-
2026-05-07price $595,000
-
2025-10-31price $629,000
-
2025-07-25$688,000 Active
-
2025-04-12historical
-
2025-04-01price $599,500
-
2025-04-01price $599,000
-
2024-11-12price $615,000
-
2024-10-24price $619,000
-
2024-09-20price $620,000
-
2024-08-23$599,000 Active
-
2024-04-01historical
-
2024-03-25price $688,000
-
2024-03-25price $745,000
-
2024-03-25price $765,000
-
2024-03-07price $760,000
-
2024-01-11status Active
-
2024-01-10historical Active Under Contract
-
2023-11-21$765,000 Active
-
2009-07-15soldstatus $280,000
-
1992-06-02soldstatus $275,000
-
1987-09-02soldstatus $215,000
-
1987-08-01soldstatus $215,000
ⓘ Source: listings_history table (triggers on properties + properties_extension) + one-shot
backfill from property_details.listing_events for pre-trigger history.
Tax reassessment forecast FL · Resets to sale price
- Current annual tax
- $9,671 · $806/mo
- Projected year-2 tax
- $9,671 · $806/mo
- Expected delta
- $0/yr ($0/mo · 0.0%)
ⓘ Screening estimate from a state-policy table — verify with the county assessor before closing.
Climate risk First Street
- Flood 8/10 Severe FEMA zone AE · 97% chance over 30 yrs
- Wildfire 1/10 Low
- Heat 10/10 Extreme 6 d/yr ≥103°F today · 21 d/yr by 30 yrs out
- Wind 10/10 Extreme 99% chance of damaging wind over 30 yrs
- Air quality 2/10 Low 1 unhealthy d/yr today · 2 by 30 yrs out
Nearby sold comps map
Loading sold comps map…
Walkable amenities ~0.75 mi
Loading nearby amenities…
Taxation est. · year 1
- Rental income
- $84,765
- − Mortgage interest
- −$33,329
- − Property taxes
- −$9,671
- − Insurance
- −$8,094
- − Repairs & maintenance
- −$6,781
- − Management
- −$6,781
- − HOA
- −$29,016
- − Depreciation
- −$17,309
- Taxable loss
- −$26,217
- Est. tax savings @ 24.0%
- +$6,292
- After-tax cash flow
- $-10,967/yr
For passive investors: Depreciation is non-cash, so a rental often shows a tax loss while cash-flowing — sheltering income. Rental losses are passive: they offset passive income freely, and up to $25,000/yr can offset ordinary (W-2) income if you actively participate and your MAGI is under $100k (phasing out to $0 by $150k); unused losses carry forward. On sale, claimed depreciation is recaptured at up to 25%, and gains may owe capital-gains tax (a 1031 exchange can defer both). Figures are a year-1 estimate at your 24.0% rate — not tax advice; consult a CPA.
Schools (NCES district)
- District
- Miami-Dade
- NCES district ID
- 1200390
- Math proficiency
- 45% ▼ -16.00%
- Reading proficiency
- 54% ▼ -5.00%
- Median HH income
- $43,928
- Composite
- 41.76/100
- National rank
- #3397
- State rank
- #40 of 73 in FL
Livability — Aventura
- Score
- 80/100
- State rank
- #127
- US rank
- #1834
Category grades
Schools grade is shown separately in the Schools card above.
Census & demographics
- Census place
- Aventura, FL
- County
- Miami-Dade County · 2,697,751 people
- City population
- 34,147
- Metro
- Miami-Fort Lauderdale-Pompano Beach, FL
- Population (ZIP)
- 34,147
- Household income
- $91,055
- Rent vs Own
- Severe rent burden
- 1838.0
Population outlook (Miami-Dade County) Hauer SSP2
- Today (2025)
- 3,126,439 people
- By 2030
- 3,325,765 · +6.4%
- By 2040
- 3,697,561 · +18.3%
- By 2050
- 4,012,134 · +28.3%
- By 2075
- 4,605,612 · +47.3%
- By 2100
- 4,866,598 · +55.7%
Race, ethnicity, and origin ACS 2023
- Neighborhood character
- Diverse neighborhood (Simpson 0.59)
- Race & ethnicity
- White 46% Hispanic / Latino 45% Two or more races 28% Black 2% Asian 2%
- Hispanic origin (detail)
- Mexican 2% Puerto Rican 2% Cuban 7% Dominican 1% Salvadoran 6%
- Common ancestry
- Scotch-Irish 5% Romanian 5% Italian 3%
- Foreign-born
- 52% · Canada, Jamaica, Dominican Republic
- Languages at home
- 30% English-only · Spanish 49% Other Indo-European 6% Russian/Polish/Slavic 4%
Political lean MEDSL · Miami-Dade
- 2024 margin
- R (+11.4) · D 43.9% · R 55.4%
- 2008→2024 swing
- -27.6pp toward R · 2008: 16.1pp · 2024: -11.4pp
- All cycles
- 2024: R+11.4 2020: D+7.3 2016: D+29.6 2012: D+23.7 2008: D+16.1
Not yet ingested
- Civics
- —
Market trends
- HPI YoY
- ▼ -343.81%
- Current HPI
- 234.7715
- Rent YoY
- ▼ -1.51%
- Metro
- Miami-Fort Lauderdale-Pompano Beach, FL
- State GDP YoY
- ▲ 3.28%
- F500 in state
- 36
Industry mix (Fortune 500 HQ in FL)
| Industry | F500 HQs | Revenue |
|---|---|---|
| Industrial Technology | 2 | $29B |
|
||
| Insurance | 2 | $17B |
|
||
| Retail | 1 | $60B |
|
||
| Technology Distribution | 1 | $58B |
|
||
| Homebuilding | 1 | $35B |
|
||
| Technology Manufacturing | 1 | $35B |
|
||
Price history
+176.7% since first listed22 events — show timeline
- 2026-05-07 Price Changed $595,000 MARMLS
- 2025-10-31 Price Changed $629,000 MARMLS
- 2025-07-25 Listed $688,000 MARMLS
- 2025-04-12 Listing Removed — MARMLS
- 2025-04-01 Price Changed $599,500 MARMLS
- 2025-04-01 Price Changed $599,000 MARMLS
- 2024-11-12 Price Changed $615,000 MARMLS
- 2024-10-24 Price Changed $619,000 MARMLS
- 2024-09-20 Price Changed $620,000 MARMLS
- 2024-08-23 Listed $599,000 MARMLS
- 2024-04-01 Listing Removed — MARMLS
- 2024-03-25 Price Changed $688,000 MARMLS
- 2024-03-25 Price Changed $745,000 MARMLS
- 2024-03-25 Price Changed $765,000 MARMLS
- 2024-03-07 Price Changed $760,000 MARMLS
- 2024-01-11 Relisted — MARMLS
- 2024-01-10 Contingent — MARMLS
- 2023-11-21 Listed $765,000 MARMLS
- 2009-07-15 Sold (MLS) $280,000 MARMLS
- 1992-06-02 Sold (Public Records) $275,000 Public Records
- 1987-09-02 Sold (Public Records) $215,000 Public Records
- 1987-08-01 Sold (Public Records) $215,000 Public Records
Property tax history
+4.5%/yrLatest (2025): $9,671 · -11.4% YoY. Source: county tax records.
Cash-flow waterfall
monthlySold comps — $/sqft
last 12 mo · ≤1 miLoading sold comps…