1256 Bass Dr · Pymatuning Central, PA
Flood risk 1/10 · Minimal
- FEMA flood zone
- X (unshaded)
- Chance of flooding over 30 yrs
- 0.0%
- Est. flood insurance / yr
- $507 – $1,088
Fire risk 1/10 · Minimal
- Est. fire insurance / yr
- $511 – $949
Heat risk 2/10 · Minimal
- Hot days now (above 94°F)
- 7 days/yr
- Hot days in 30 yrs
- 17 days/yr
Wind risk 1/10 · Minimal
- Chance of severe wind over 30 yrs
- —
Air-quality risk 2/10 · Minimal
- Unhealthy air days now
- 1 days/yr
- Unhealthy air days in 30 yrs
- 3 days/yr
Risk factors via First Street. Map © Google.
Why this score? — see what drove the C grade
The composite is a weighted blend of 9 inputs, each scored 0–100. Each bar is that input's sub-score; the figure is the points it added to the 100-point composite (weight × sub-score).
- Cash flow +15.4/30.0
- ARV discount +9.2/15.0
- Appreciation +9.2/10.0
- DSCR +4.7/10.0
- 1% rule +4.2/10.0
- Schools +4.0/10.0
- Livability +3.2/5.0
- Rent growth +2.5/5.0
- Condition / age +2.5/5.0
$167,000
🖨 Deal sheet 📄 Offer letter ✓ Due diligence
Listing remarks
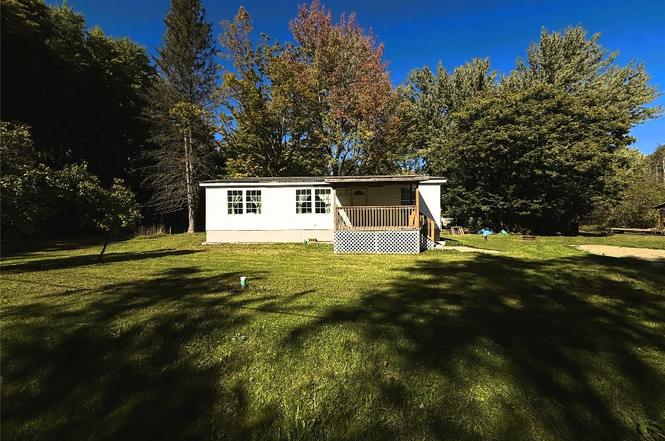
Discover your Pymatuning oasis! Situated on a . 25 acre lot, this home sits less than . 2 miles from the lake. Plenty of room to enjoy the outdoors, whether relaxing in the gazebo, enjoying coffee on the front porch, or evenings by the firepit. Featuring 3 bedrooms and 2 full baths that are spacious in size. Primary bedroom has its own full bath with jetted tub, shower, and double sinks. Could be used to bring in additional income, as it was previously an Airbnb. Schedule your showing today!
Key facts
- Double sinks
- Firepit
- Gazebo
Tags
Neighborhood map
What this means for you Summary
Snapshot
- This is a 3-bed/2.0-bath single-family listed at $167k.
Deal economics
- At list price, monthly cash flow is $66 ($788/yr) — positive.
- The deal already cash-flows at list — no discount required.
- To meet the 1% rule (rent ≥ 1% of price), the offer needs to be $154k (7.5% below list).
- Recommended offer: $147k (12.0% below list) — sets the bar for market timing.
Location & tenants
- Location reads 64/100 on livability (#1,181 in PA) — a middle-class / working-renter tenant base. Strengths: crime A+, cost of living A+, housing A+; Watch: employment D+, health & safety D, schools F.
- Conneaut SD (rural): math 38% / reading 57% proficiency, ranked #241 of 539 in PA (top 45%) — families likely to look elsewhere, expect single-tenant / working-renter base with shorter leases.
- Market conditions: 53 active listings in the ZIP; 83 units permitted in Crawford County in 2024 (0 in 5+ unit buildings).
Forward outlook
- In year one you build about $15k of equity ($1k loan paydown + $14k appreciation (8.5% local appreciation)).
- Crawford County population projected at -22% by 2050 — secular population decline; favor cash flow + early exit over multi-decade hold.
- At projected returns (8.5% appreciation + 3.0% rent growth), your $47k cash investment doubles in ~3 years — after that, you're playing with house money.
- By year 3, paydown + projected appreciation supports a ~$38k cash-out refi (75% LTV) — recoverable capital for the next deal without selling this one.
Negotiation context
- It's been on market 226 days — a 12% lower offer ($147k) is reasonable based on typical stale-listing flexibility.
- 3 sale attempts since 2y ago with the ask held roughly flat each time — persistent listings suggest the price (not the market) is what's stuck; bring a comps-based counter.
Questions for the listing agent
- It's been on market 226 days. Have you received any prior offers? Is the seller open to a 12% concession, seller financing, or rate buy-down credit?
- Why hasn't it sold? Are there any deal-killer items the seller is aware of (foundation, flood, title, zoning, code violations)?
- Is there a deadline driving the sale (1031 exchange, divorce, estate, relocation)? That informs how much negotiation room exists.
- Schools are F-rated, which usually means shorter tenancies and higher turnover. Who's the typical renter profile here, and what's been the actual vacancy rate?
- What's the average days-on-market for RENTAL listings here right now (not sales)? A rising rental-DOM trend means longer vacancies and softer asking-rent achievability than the comps imply.
- What's the recent tenant-quality profile in this submarket — average credit score on applications, eviction rate, late-payment / NSF rate, and stable-employment percentage? A property-management company in the area should have these aggregated.
- How much new for-sale + rental construction is in the pipeline within 1–3 miles? Heavy new supply typically softens prices + rents 12–24 months out; constrained supply supports both.
Investment metrics
- 1% rule
- 0.92% ✗
- Cap rate
- 6.76%
- Cash-on-cash
- 1.69%
- DSCR
- 1.07
- GRM
- 9.0
CMA / ARV
- ARV (on-the-fly)
- $173,600
- Comps found
- 2
Show comp detail 2 sales within ~0.75 mi
| Address | Dist | Beds/Ba | Sqft | Sold | Price | $/sf | Match |
|---|---|---|---|---|---|---|---|
| 1359 Beach Dr | 0.44mi | 3/2.0 | 1,100 (-2%) | 9mo | $170,000 | $155 | 69 |
| 1992 ST Hwy 285 | 0.53mi | 2/1.0 (-1) | 960 (-14%) | 8mo | $105,000 | $109 | 35 |
Match score weights: distance 35% · size 25% · config 20% · recency 20%. Top-matched comps best support the ARV.
Projected returns pro-forma
8.48% appreciation · 3.0% rent growth · sell at horizon
- IRR
- 22.3%
- Equity multiple
- 2.67×
- Total profit
- $78,213
- Equity at exit
- $132,420
- IRR
- 20.3%
- Equity multiple
- 5.80×
- Total profit
- $224,231
- Equity at exit
- $268,324
Cash invested: $46,760 (down + closing). Projections, not guarantees.
Landlord ↔ Tenant lean methodology
- Overall (STATE)
- 62 Landlord-Friendly
- State Pennsylvania
- 62 Landlord-Friendly · EVEN
- County
- — inherits STATE
- City
- — inherits STATE
ZIP-level market 16424
- Home prices YoY
- 3.2%
- Active inventory
- 53
- Price-to-rent
- 9.0×
Monthly cashflow live
- Estimated rent
- $1,544 medium interval (Pro) →
- Mortgage (P&I)
- −$876
- Tax est. 1.5%
- −$209 /mo · $2,505/yr
- Insurance
- −$70
- HOA
- −$0
- Vacancy / Maint / Mgmt
- −$324
- Net cashflow
- $66
Break-even live
UW: 25.0% down · 7.5% · 30yr · 1.5% tax · 5.0% vac · 8.0% maint · 8.0% mgmt
Financing live
Cash to close
- Down payment
- $41,750
- Closing costs
- $5,010
- Reserves months
- —
- Total cash needed
- —
Loan-product check · same deal, 3 products live
Conventional
25% down · 7.5% · 30yr
- Down + closing
- —
- Monthly P&I
- —
- Monthly cashflow
- —
- DSCR
- —
- Eligible?
- —
Personal DTI + credit; lowest rate.
DSCR
20% down · 8.5% · 30yr
- Down + closing
- —
- Monthly P&I
- —
- Monthly cashflow
- —
- DSCR
- —
- Eligible?
- —
No personal income docs; deal must DSCR.
Hard money
10% down · 12.0% · 12mo
- Down + closing
- —
- Monthly P&I
- —
- Monthly cashflow
- —
- DSCR
- —
- Eligible?
- —
Short-term bridge; refi at stabilization.
Listing history 20 events
-
2026-06-19days on market $167,000 Active 226 DOM
-
2026-06-18days on market $167,000 Active 225 DOM
-
2026-06-17days on market $167,000 Active 224 DOM
-
2026-06-16days on market $167,000 Active 223 DOM
-
2026-06-15days on market $167,000 Active 222 DOM
-
2026-06-14days on market $167,000 Active 220 DOM
-
2026-06-12days on market $167,000 Active 219 DOM
-
2026-06-09days on market $167,000 Active 216 DOM
-
2026-06-08days on market $167,000 Active 215 DOM
-
2026-06-07days on market $167,000 Active 214 DOM
-
2026-06-07days on market $167,000 Active 213 DOM
-
2026-06-03days on market $167,000 Active 210 DOM
-
2026-06-02days on market $167,000 Active 209 DOM
-
2026-06-01days on market $167,000 Active 208 DOM
-
2026-05-31days on market $167,000 Active 207 DOM
-
2026-05-30days on market $167,000 Active 206 DOM
-
2026-04-22status Pending
-
2025-10-01$167,000 Active
-
2024-07-26$330,000 Active
-
2024-07-26$330,000 Active
ⓘ Source: listings_history table (triggers on properties + properties_extension) + one-shot
backfill from property_details.listing_events for pre-trigger history.
Climate risk First Street
- Flood 1/10 Low FEMA zone X (unshaded) · 0% chance over 30 yrs
- Wildfire 1/10 Low
- Heat 2/10 Low 7 d/yr ≥94°F today · 17 d/yr by 30 yrs out
- Wind 1/10 Low
- Air quality 2/10 Low 1 unhealthy d/yr today · 3 by 30 yrs out
Nearby sold comps map
Loading sold comps map…
Walkable amenities ~0.75 mi
Loading nearby amenities…
Taxation est. · year 1
- Rental income
- $18,528
- − Mortgage interest
- −$9,355
- − Property taxes
- −$2,505
- − Insurance
- −$835
- − Repairs & maintenance
- −$1,482
- − Management
- −$1,482
- − Depreciation
- −$4,858
- Taxable loss
- −$1,989
- Est. tax savings @ 24.0%
- +$477
- After-tax cash flow
- $1,265/yr
For passive investors: Depreciation is non-cash, so a rental often shows a tax loss while cash-flowing — sheltering income. Rental losses are passive: they offset passive income freely, and up to $25,000/yr can offset ordinary (W-2) income if you actively participate and your MAGI is under $100k (phasing out to $0 by $150k); unused losses carry forward. On sale, claimed depreciation is recaptured at up to 25%, and gains may owe capital-gains tax (a 1031 exchange can defer both). Figures are a year-1 estimate at your 24.0% rate — not tax advice; consult a CPA.
Schools (NCES district)
- District
- Conneaut SD
- NCES district ID
- 4206590
- Math proficiency
- 38% ▼ -7.00%
- Reading proficiency
- 57% ▼ -7.00%
- Median HH income
- $43,946
- Composite
- 40.06/100
- National rank
- #3813
- State rank
- #241 of 539 in PA
Livability — Pymatuning Central
- Score
- 64/100
- State rank
- #1181
- US rank
- #13811
Category grades
Schools grade is shown separately in the Schools card above.
Census & demographics
- Census place
- Pymatuning Central, PA
- Population (ZIP)
- 4,328
Population outlook (Crawford County) Hauer SSP2
- Today (2025)
- 81,399 people
- By 2030
- 77,977 · -4.2%
- By 2040
- 70,659 · -13.2%
- By 2050
- 63,841 · -21.6%
- By 2075
- 50,198 · -38.3%
- By 2100
- 37,898 · -53.4%
Race, ethnicity, and origin ACS 2023
- Neighborhood character
- Predominantly White (95%)
- Race & ethnicity
- White 95% Two or more races 4% Hispanic / Latino 2%
- Common ancestry
- Romanian 4% Lithuanian 2% Slovak 2%
- Foreign-born
- 1% · Canada
- Languages at home
- 96% English-only · German/W. Germanic 3% Spanish 1%
Political lean MEDSL · Crawford
- 2024 margin
- Solid R (+39.2) · D 30.0% · R 69.2%
- 2008→2024 swing
- -28.8pp toward R · 2008: -10.4pp · 2024: -39.2pp
- All cycles
- 2024: R+39.2 2020: R+37.2 2016: R+38.5 2012: R+19.6 2008: R+10.4
Not yet ingested
- Civics
- —
Market trends
- HPI YoY
- ▲ 8.48%
- Current HPI
- 276.8388
- Rent YoY
- —
- Metro
- —
- State GDP YoY
- ▲ 1.68%
- F500 in state
- 34
Industry mix (Fortune 500 HQ in PA)
| Industry | F500 HQs | Revenue |
|---|---|---|
| Healthcare | 2 | $309B |
|
||
| Insurance | 2 | $27B |
|
||
| Telecommunications / Media | 1 | $124B |
|
||
| Industrial Distribution | 1 | $22B |
|
||
| Financial Services | 1 | $20B |
|
||
| Chemicals / Materials | 1 | $18B |
|
||
Price history
-49.4% since first listed4 events — show timeline
- 2026-04-22 Pending — GEBOR
- 2025-10-01 Listed $167,000 GEBOR
- 2024-07-26 Listed $330,000 GEBOR
- 2024-07-26 Listed $330,000 GEBOR
Cash-flow waterfall
monthlySold comps — $/sqft
last 12 mo · ≤1 miLoading sold comps…