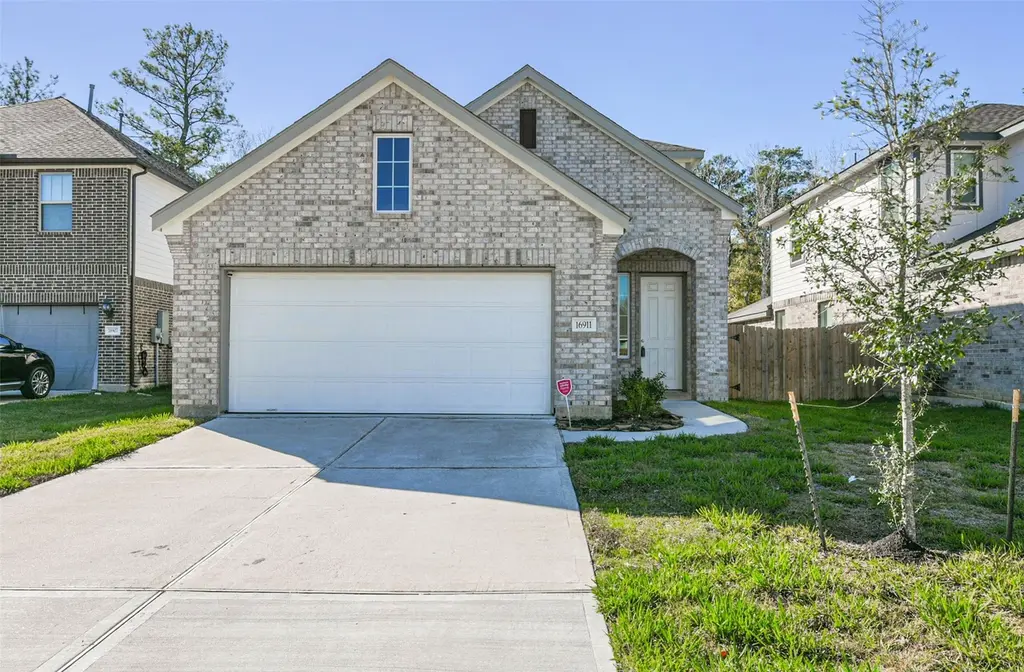
16911 Lagos Ln · Crosby, TX
Flood risk 1/10 · Minimal
- FEMA flood zone
- X (unshaded)
- Chance of flooding over 30 yrs
- 0.0%
- Est. flood insurance / yr
- $507 – $1,088
Fire risk 3/10 · Minor
- Est. fire insurance / yr
- $1,222 – $2,270
Heat risk 9/10 · Severe
- Hot days now (above 110°F)
- 7 days/yr
- Hot days in 30 yrs
- 24 days/yr
Wind risk 9/10 · Severe
- Chance of severe wind over 30 yrs
- 99.0%
Air-quality risk 2/10 · Minimal
- Unhealthy air days now
- 2 days/yr
- Unhealthy air days in 30 yrs
- 2 days/yr
Risk factors via First Street. Map © Google.
Why this score? — see what drove the D grade
The composite is a weighted blend of 9 inputs, each scored 0–100. Each bar is that input's sub-score; the figure is the points it added to the 100-point composite (weight × sub-score).
- ARV discount +14.5/15.0
- Cash flow +7.6/30.0
- 1% rule +4.0/10.0
- Condition / age +4.0/5.0
- Schools +3.5/10.0
- Livability +3.0/5.0
- Rent growth +2.9/5.0
- DSCR +1.7/10.0
- Appreciation +0.0/10.0
$239,900
🖨 Deal sheet (PDF) 📄 Offer letter ✓ Due diligence
Listing remarks MLS
Welcome to this charming 3 bedroom 2 bath home on a quiet street. With a spacious gameroom, high ceilings, and a convenient half bath downstairs, this property is perfect for entertaining guests. The primary bedroom downstairs offers a peaceful retreat from the hustle and bustle of everyday life. Don't miss the opportunity to make this house your home!
Key facts
- 4,948 sq ft lot
- 2 garage spots
- Built 2020
Neighborhood map
What this means for you Summary
Snapshot
- This is a 3-bed/2.5-bath single-family listed at $240k. Condition is rated good.
Deal economics
- At list price, monthly cash flow is $-290 ($-3k/yr) — negative.
- To cash-flow at today's rent, offer at most $189k (21.4% below list).
- To meet the 1% rule (rent ≥ 1% of price), the offer needs to be $216k (10.1% below list).
- Recommended offer: $189k (21.4% below list) — sets the bar for cash-flow.
Location & tenants
- Location reads 59/100 on livability (#1,121 in TX) — a working-class tenant base; expect higher turnover. Strengths: cost of living A+, crime A, housing A; Watch: amenities F, commute F, employment F.
- Crosby ISD (rural): math 39% / reading 40% proficiency, ranked #369 of 826 in TX (top 45%) — families likely to look elsewhere, expect single-tenant / working-renter base with shorter leases.
- Zoned schools: Crosby Middle (math 36% / reading 37%, grade F, #786 of 1,662 statewide, top 48%, 1,549 students, 60% FRL).
- Market conditions: Rents rising (+1.5%/yr); 1189 active listings in the ZIP; 7 comparable units currently listed for rent nearby; rentals at typical pace (median 15d on market — plan ~3-4 weeks tenant-placement turnaround); solid renter incomes; 29,883 units permitted in Harris County in 2024 (8,621 in 5+ unit buildings).
Forward outlook
- Local home prices are declining (-3.0%/yr); year-one equity from $2k of loan paydown is wiped out by about $7k of value loss. Plan a longer hold.
- Harris County population projected at +47% by 2050 — long-run rental-demand tailwind backs the buy-and-hold thesis.
Negotiation context
- It's been on market 95 days — a 9% lower offer ($218k) is reasonable based on typical stale-listing flexibility.
- 6 sale attempts since 3y ago; this cycle's ask is 9496% above the opening price — seller raised mid-cycle; expect resistance to lowballs.
Risks & watch-outs
- Watch-outs: property tax is 2.9% of price.
- Climate carrying-cost: severe wind risk, 99% chance of damaging wind over 30y; extreme-heat days projected 7→24/yr by 2055 (HVAC capex compounding) — expect insurance premiums to compound above CPI over the hold.
Questions for the listing agent
- What do current leases actually rent for vs. the listed asking? Can we see a recent rent roll and the last 12 months of T-12 income?
- It's been on market 95 days. Have you received any prior offers? Is the seller open to a 21% concession, seller financing, or rate buy-down credit?
- Property tax is high relative to price — has the assessment been appealed recently, and will the sale trigger a re-assessment?
- What does the HOA fee cover, when was the last increase, and are there any pending special assessments or reserve-fund shortfalls?
- Why hasn't it sold? Are there any deal-killer items the seller is aware of (foundation, flood, title, zoning, code violations)?
- Is there a deadline driving the sale (1031 exchange, divorce, estate, relocation)? That informs how much negotiation room exists.
- Schools are D-rated, which usually means shorter tenancies and higher turnover. Who's the typical renter profile here, and what's been the actual vacancy rate?
- The area grade is low — what's the realistic commute time and amenity access for the typical tenant pool here? Any planned neighborhood developments (good or bad) we should know about?
- What's the average days-on-market for RENTAL listings here right now (not sales)? A rising rental-DOM trend means longer vacancies and softer asking-rent achievability than the comps imply.
- What's the recent tenant-quality profile in this submarket — average credit score on applications, eviction rate, late-payment / NSF rate, and stable-employment percentage? A property-management company in the area should have these aggregated.
- How much new for-sale + rental construction is in the pipeline within 1–3 miles? Heavy new supply typically softens prices + rents 12–24 months out; constrained supply supports both.
Investment metrics
- 1% rule
- 0.90% ✗
- Cap rate
- 4.84%
- Cash-on-cash
- -5.19%
- DSCR
- 0.77
- GRM
- 9.3
CMA / ARV
- ARV (median comp)
- $283,786
- List price
- $239,900
- Delta
- -15.43%
- Verdict
- UNDERPRICED
- Comps
- 20 within 1.0 mi
Show comp detail 12 sales within ~0.75 mi
| Address | Dist | Beds/Ba | Sqft | Sold | Price | $/sf | Match |
|---|---|---|---|---|---|---|---|
| 17122 Yeoman Way | 0.44mi | 3/2.5 | 2,016 (+6%) | 0mo | $240,000 | $119 | 70 |
| 17226 Broken Back Dr | 0.29mi | 3/2.0 | 1,706 (-11%) | 1mo | $185,000 | $108 | 66 |
| 16658 Bluefin St | 0.48mi | 4/2.0 (+1) | 1,862 (-2%) | 2mo | $279,900 | $150 | 65 |
| 1602 Chart Dr | 0.38mi | 3/3.0 | 2,100 (+10%) | 1mo | $374,999 | $179 | 62 |
| 17458 Jolly Boat Dr | 0.46mi | 3/2.0 | 1,766 (-8%) | 2mo | $245,000 | $139 | 62 |
| 17519 Jolly Boat Dr | 0.55mi | 3/2.0 | 1,766 (-8%) | 1mo | $207,250 | $117 | 59 |
| 710 Razee Ct | 0.58mi | 3/2.0 | 1,710 (-10%) | 0mo | $255,000 | $149 | 54 |
| 1107 Cable Way | 0.55mi | 3/2.0 | 1,688 (-12%) | 1mo | $219,900 | $130 | 52 |
| 631 Aweigh Dr | 0.48mi | 3/2.5 | 1,624 (-15%) | 3mo | $242,000 | $149 | 50 |
| 16107 Long Boat Ct | 0.66mi | 4/2.5 (+1) | 2,050 (+7%) | 3mo | $380,000 | $185 | 49 |
| 17102 Jetty Ct | 0.56mi | 4/2.0 (+1) | 2,082 (+9%) | 4mo | $268,000 | $129 | 49 |
| 17131 Dorsal Way | 0.70mi | 3/2.0 | 1,701 (-11%) | 2mo | $250,000 | $147 | 46 |
Match score weights: distance 35% · size 25% · config 20% · recency 20%. Top-matched comps best support the ARV.
Projected returns pro-forma
-3.0% appreciation · 1.48% rent growth · sell at horizon
- IRR
- -27.1%
- Equity multiple
- 0.10×
- Total profit
- $-60,376
- Equity at exit
- $35,770
- IRR
- -32.6%
- Equity multiple
- -0.32×
- Total profit
- $-88,346
- Equity at exit
- $20,742
Cash invested: $67,172 (down + closing). Projections, not guarantees.
Landlord ↔ Tenant lean methodology
- Overall (STATE)
- 87 Strongly Landlord-Friendly
- State Texas
- 87 Strongly Landlord-Friendly · R+5
- County
- — inherits STATE
- City
- — inherits STATE
ZIP-level market 77532
- Home prices YoY
- -28.6%
- Rents YoY
- 1.5%
- Active inventory
- 1189
- Price-to-rent
- 9.3×
Monthly cashflow live
- Estimated rent
- $2,157 high interval (Pro) →
- Mortgage (P&I)
- −$1,258
- Tax from tax record
- −$578 /mo · $6,941/yr
- Insurance
- −$100
- HOA
- −$58
- Vacancy / Maint / Mgmt
- −$453
- Net cashflow
- $-290
Break-even live
Sensitivity live
| Price | -10% $-155 | -5% $-222 | +0% $-290 | +5% $-358 | +10% $-426 |
|---|---|---|---|---|---|
| Rent | -10% $-461 | -5% $-376 | +0% $-290 | +5% $-205 | +10% $-120 |
| Rate | -1.0pp $-170 | -0.5pp $-229 | base $-290 | +0.5pp $-352 | +1.0pp $-416 |
UW: 25.0% down · 7.5% · 30yr · 1.5% tax · 5.0% vac · 8.0% maint · 8.0% mgmt
Financing live
Cash to close
- Down payment
- $59,975
- Closing costs
- $7,197
- Reserves months
- —
- Total cash needed
- —
Loan-product check · same deal, 3 products live
Conventional
25% down · 7.5% · 30yr
- Down + closing
- —
- Monthly P&I
- —
- Monthly cashflow
- —
- DSCR
- —
- Eligible?
- —
Personal DTI + credit; lowest rate.
DSCR
20% down · 8.5% · 30yr
- Down + closing
- —
- Monthly P&I
- —
- Monthly cashflow
- —
- DSCR
- —
- Eligible?
- —
No personal income docs; deal must DSCR.
Hard money
10% down · 12.0% · 12mo
- Down + closing
- —
- Monthly P&I
- —
- Monthly cashflow
- —
- DSCR
- —
- Eligible?
- —
Short-term bridge; refi at stabilization.
Rent comps 7 comps
| Address | Beds | Baths | Sqft | Rent | $/sqft | DOM | Units | Dist |
|---|---|---|---|---|---|---|---|---|
| 16807 Lisbon Ln Crosby, TX | 3.0 | 2.5 | 2196 | $1,910 | $0.87 | 45d | 1 | 0.11mi |
| 1310 Stem Way Dr Crosby, TX | 4.0 | 2.0 | 2346 | $2,700 | $1.15 | 4d | 1 | 0.41mi |
| 16318 River Wood Ct Crosby, TX | 3.0 | 2.5 | 1681 | $1,946 | $1.16 | 3d | 1 | 0.63mi |
| 430 Fishhawk Way Crosby, TX | 3.0 | 2.0 | 1369 | $1,783 | $1.30 | 0d | 1 | 0.69mi |
| 711 Equinox St Crosby, TX | 3.0 | 2.0 | 1802 | $1,881 | $1.04 | 45d | 1 | 0.72mi |
| 15806 Afore Dr Crosby, TX | 4.0 | 2.0 | 2372 | $1,951 | $0.82 | 17d | 1 | 1.23mi |
| 15722 E Astern Dr Crosby, TX | 3.0 | 2.0 | 1996 | $1,896 | $0.95 | 14d | 1 | 1.40mi |
HOA detail
- Monthly dues
- $58 · $696/yr
Listing history 29 events
-
2026-06-21pricedays on market $239,900 Active 95 DOM
-
2026-06-18days on market $240,000 Active 92 DOM
-
2026-06-17days on market $240,000 Active 91 DOM
-
2026-06-16days on market $240,000 Active 90 DOM
-
2026-06-15days on market $240,000 Active 89 DOM
-
2026-06-13pricedays on market $240,000 Active 87 DOM
-
2026-06-09days on market $248,500 Active 83 DOM
-
2026-06-08days on market $248,500 Active 82 DOM
-
2026-06-07days on market $248,500 Active 81 DOM
-
2026-06-04days on market $248,500 Active 78 DOM
-
2026-06-03days on market $248,500 Active 77 DOM
-
2026-06-02days on market $248,500 Active 76 DOM
-
2026-06-01days on market $248,500 Active 75 DOM
-
2026-05-31days on market $248,500 Active 74 DOM
-
2026-05-14price $248,500 354-char remark
Show marketing remark (354 chars)
Welcome to this charming 3 bedroom 2 bath home on a quiet street. With a spacious gameroom, high ceilings, and a convenient half bath downstairs, this property is perfect for entertaining guests. The primary bedroom downstairs offers a peaceful retreat from the hustle and bustle of everyday life. Don't miss the opportunity to make this house your home!
-
2026-05-02$2,500
-
2026-03-18$254,500 Active 354-char remark
Show marketing remark (354 chars)
Welcome to this charming 3 bedroom 2 bath home on a quiet street. With a spacious gameroom, high ceilings, and a convenient half bath downstairs, this property is perfect for entertaining guests. The primary bedroom downstairs offers a peaceful retreat from the hustle and bustle of everyday life. Don't miss the opportunity to make this house your home!
-
2024-02-27historical $2,050
-
2024-02-20$2,050
-
2024-02-18historical
-
2024-02-06price $269,900
-
2024-02-01historical $2,250
-
2024-01-24status Active
-
2024-01-03historical
-
2023-12-13soldstatus
-
2023-12-08$279,900 Active
-
2023-11-17$2,250
-
2023-11-04historical
-
2023-11-04historical
ⓘ Source: listings_history table (triggers on properties + properties_extension) + one-shot
backfill from property_details.listing_events for pre-trigger history.
Tax reassessment forecast TX · Resets to sale price
- Current annual tax
- $6,941 · $578/mo
- Projected year-2 tax
- $6,941 · $578/mo
- Expected delta
- $0/yr ($0/mo · 0.0%)
ⓘ Screening estimate from a state-policy table — verify with the county assessor before closing.
Climate risk First Street
- Flood 1/10 Low FEMA zone X (unshaded) · 0% chance over 30 yrs
- Wildfire 3/10 Moderate
- Heat 9/10 Extreme 7 d/yr ≥110°F today · 24 d/yr by 30 yrs out
- Wind 9/10 Extreme 99% chance of damaging wind over 30 yrs
- Air quality 2/10 Low 2 unhealthy d/yr today · 2 by 30 yrs out
Nearby sold comps map
Loading sold comps map…
Walkable amenities ~0.75 mi
Loading nearby amenities…
Taxation est. · year 1
- Rental income
- $25,885
- − Mortgage interest
- −$13,438
- − Property taxes
- −$6,941
- − Insurance
- −$1,200
- − Repairs & maintenance
- −$2,071
- − Management
- −$2,071
- − HOA
- −$696
- − Depreciation
- −$6,979
- Taxable loss
- −$7,510
- Est. tax savings @ 24.0%
- +$1,802
- After-tax cash flow
- $-1,681/yr
For passive investors: Depreciation is non-cash, so a rental often shows a tax loss while cash-flowing — sheltering income. Rental losses are passive: they offset passive income freely, and up to $25,000/yr can offset ordinary (W-2) income if you actively participate and your MAGI is under $100k (phasing out to $0 by $150k); unused losses carry forward. On sale, claimed depreciation is recaptured at up to 25%, and gains may owe capital-gains tax (a 1031 exchange can defer both). Figures are a year-1 estimate at your 24.0% rate — not tax advice; consult a CPA.
Condition & rehab AI · 12 photos
This charming 3-bedroom, 2.5-bath home is in excellent condition with a good curb appeal and modern finishes. It's move-in ready and has the potential for further value increases with minor updates.
Value-add opportunities
- Both Painting the exterior brick — Enhances curb appeal and can increase both resale and rental value
- Both Updating the kitchen backsplash — Modernizes the kitchen and can increase both resale and rental value
- Both Adding a smart thermostat — Improves energy efficiency and can increase both resale and rental value
Renovation cost estimate screening
Value-add ROI direction
- Both Painting the exterior brick — Enhances curb appeal and can increase both resale and rental value ↑
- Both Updating the kitchen backsplash — Modernizes the kitchen and can increase both resale and rental value ↑
- Both Adding a smart thermostat — Improves energy efficiency and can increase both resale and rental value ↑
ⓘ Cost ranges are severity-bucket heuristics (US national rule-of-thumb). Get contractor quotes + a written scope before underwriting a rehab budget.
Schools (NCES district)
- District
- Crosby ISD
- NCES district ID
- 4815750
- Math proficiency
- 39% ▼ -13.00%
- Reading proficiency
- 40% ▼ -5.00%
- Median HH income
- $61,079
- Composite
- 35.14/100
- National rank
- #5012
- State rank
- #369 of 826 in TX
Livability — Crosby
- Score
- 59/100
- State rank
- #1121
- US rank
- #19783
Category grades
Schools grade is shown separately in the Schools card above.
Census & demographics
- County
- Harris County · 4,702,590 people
- City population
- 33,780
- Metro
- Houston-The Woodlands-Sugar Land, TX
- Population (ZIP)
- 33,780
- Household income
- $92,201
- Rent vs Own
- Severe rent burden
- 382.0
Population outlook (Harris County) Hauer SSP2
- Today (2025)
- 5,571,493 people
- By 2030
- 6,089,821 · +9.3%
- By 2040
- 7,142,806 · +28.2%
- By 2050
- 8,185,864 · +46.9%
- By 2075
- 10,574,329 · +89.8%
- By 2100
- 12,109,958 · +117.4%
Race, ethnicity, and origin ACS 2023
- Neighborhood character
- Diverse neighborhood (Simpson 0.60)
- Race & ethnicity
- White 54% Hispanic / Latino 31% Two or more races 16% Black 9%
- Hispanic origin (detail)
- Mexican 24%
- Common ancestry
- Lithuanian 4% Romanian 3% Italian 2%
- Foreign-born
- 10% · Canada
- Languages at home
- 78% English-only · Spanish 21%
Political lean MEDSL · Harris
- 2024 margin
- Lean D (+5.5) · D 52.0% · R 46.4% · Other 1.6%
- 2008→2024 swing
- +3.9pp toward D · 2008: 1.6pp · 2024: 5.5pp
- All cycles
- 2024: D+5.5 2020: D+13.3 2016: D+12.4 2012: D+0.1 2008: D+1.6
Not yet ingested
- Civics
- —
Market trends
- HPI YoY
- ▼ -105.63%
- Current HPI
- 264.0126
- Rent YoY
- ▲ 1.48%
- Metro
- Houston-The Woodlands-Sugar Land, TX
- State GDP YoY
- ▲ 3.95%
- F500 in state
- 110
Industry mix (Fortune 500 HQ in TX)
| Industry | F500 HQs | Revenue |
|---|---|---|
| Energy | 16 | $1,198B |
|
||
| Technology | 5 | $198B |
|
||
| Engineering / Construction | 4 | $72B |
|
||
| Energy Services | 3 | $60B |
|
||
| Utilities | 3 | $41B |
|
||
| Healthcare | 2 | $330B |
|
||
Price history
+10944.4% since first listed15 events — show timeline
- 2026-05-14 Price Changed $248,500 HARMLS
- 2026-05-02 Listed for Rent $2,500 HARMLS
- 2026-03-18 Listed $254,500 HARMLS
- 2024-02-27 Rental Removed $2,050 HARMLS
- 2024-02-20 Listed for Rent $2,050 HARMLS
- 2024-02-18 Listing Removed — HARMLS
- 2024-02-06 Price Changed $269,900 HARMLS
- 2024-02-01 Rental Removed $2,250 HARMLS
- 2024-01-24 Relisted — HARMLS
- 2024-01-03 Listing Removed — HARMLS
- 2023-12-13 Sold (Public Records) — Public Records
- 2023-12-08 Listed $279,900 HARMLS
- 2023-11-17 Listed for Rent $2,250 HARMLS
- 2023-11-04 Listing Removed — HARMLS
- 2023-11-04 Coming Soon — HARMLS
Property tax history
+16.5%/yrLatest (2025): $6,941 · +1.4% YoY. Source: county tax records.
Cash-flow waterfall
monthlySold comps — $/sqft
last 12 mo · ≤1 miLoading sold comps…