15607 NE Kelly Rd · Lake Marcel-Stillwater, WA
Flood risk 1/10 · Minimal
- FEMA flood zone
- X (unshaded)
- Chance of flooding over 30 yrs
- 0.0%
- Est. flood insurance / yr
- $507 – $1,088
Fire risk 3/10 · Minor
- Est. fire insurance / yr
- $604 – $1,122
Heat risk 2/10 · Minimal
- Hot days now (above 87°F)
- 7 days/yr
- Hot days in 30 yrs
- 15 days/yr
Wind risk 1/10 · Minimal
- Chance of severe wind over 30 yrs
- —
Air-quality risk 7/10 · Major
- Unhealthy air days now
- 10 days/yr
- Unhealthy air days in 30 yrs
- 13 days/yr
Risk factors via First Street. Map © Google.
Why this score? — see what drove the D+ grade
The composite is a weighted blend of 9 inputs, each scored 0–100. Each bar is that input's sub-score; the figure is the points it added to the 100-point composite (weight × sub-score).
- ARV discount +15.0/15.0
- Cash flow +13.5/30.0
- Schools +6.3/10.0
- DSCR +4.1/10.0
- 1% rule +3.0/10.0
- Rent growth +2.5/5.0
- Livability +2.5/5.0
- Condition / age +2.5/5.0
- Appreciation +0.0/10.0
$479,000
🖨 Deal sheet (PDF) 📄 Offer letter ✓ Due diligence
Listing remarks
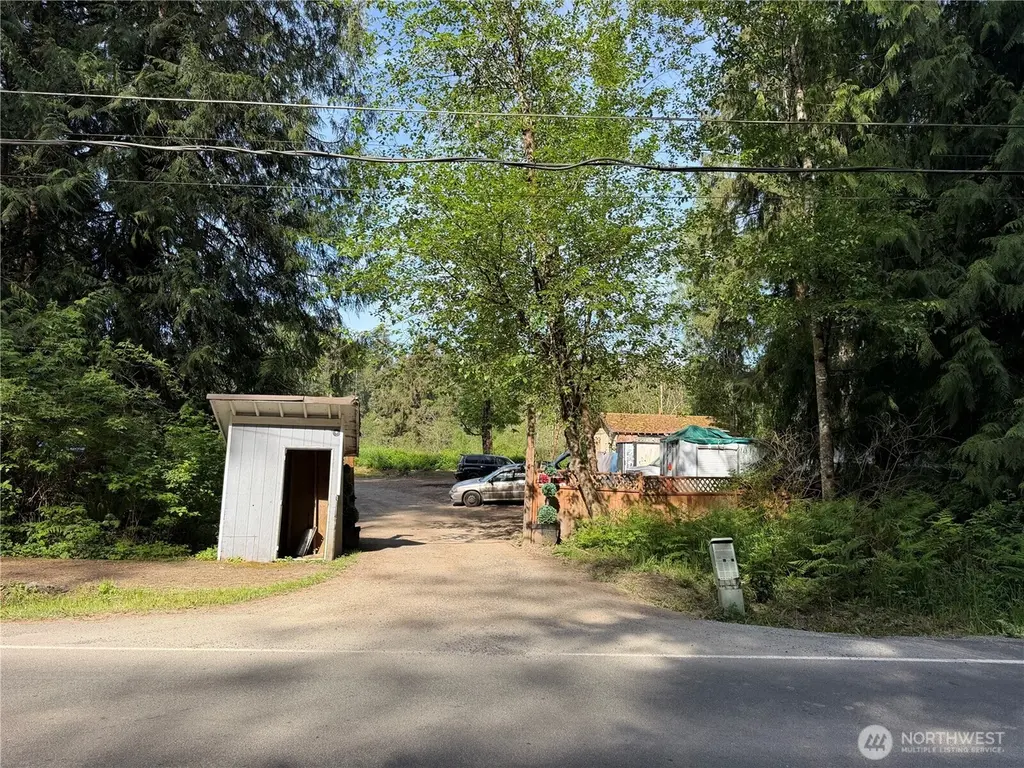
Exceptional opportunity to build your dream home on this beautiful 5+ acre property featuring a private trout and steelhead pond and open, usable land surrounded by natural beauty. With its peaceful setting, water feature, and expansive acreage, this property offers a rare chance for builders, investors, or end users to create a private retreat or future residence in a highly desirable setting. Buyer to verify all building capabilities, zoning, and permitted uses to their satisfaction.
Key facts
- Expansive acreage
- Private retreat
- Usable land
Tags
Property features AI
Finance
- Other: Lot size approximately 5.12 acres
- Financial info: Listing requires cash; Buyer brokerage compensation 2.5%
Exterior
- Parking: Driveway
- Utilities: Private water (see remarks); Septic tank sewer; Electric power
- Home design: Manufactured on land; Double wide; One story; Effective year built 1993; Facing direction: see remarks
- Construction: Built or effectively rebuilt 1993; Foundation details: see remarks; Roof: see remarks; Construction materials: see remarks
- Exterior features: Exterior and construction details: see remarks
Interior
- Bedrooms: 4 bedrooms (all on the main level)
- Bathrooms: 1 full bathroom (main level)
- Heating & cooling: Forced air heating; Forced air cooling; Electric energy source
- Interior features: One-level layout; Manufactured house (double wide)
Neighborhood map
What this means for you Summary
Snapshot
- This is a 4-bed/1.0-bath manufactured listed at $479k.
Deal economics
- At list price, monthly cash flow is $15 ($181/yr) — positive.
- The deal already cash-flows at list — no discount required.
- To meet the 1% rule (rent ≥ 1% of price), the offer needs to be $385k (19.6% below list).
- Recommended offer: $385k (19.6% below list) — sets the bar for 1% rule.
- Cap rate 6.3% vs local median 1.3% in Lake Marcel-Stillwater — top-decile yield for the area; either an underpriced asset or a hidden risk that comps aren't pricing in. Stress-test before assuming the spread holds.
Location & tenants
- Location reads: area grade D — affects rentability + tenant quality, not the cash-flow math above.
- Riverview School District (suburban): math 63% / reading 72% proficiency, ranked #15 of 291 in WA (top 5%) — acceptable for families but not a draw, mixed tenant base, ~2y average lease; only 14% free/reduced lunch — higher-income household profile.
- Zoned schools: Stillwater Elementary (482 students, 20% FRL); Tolt Middle School (644 students, 20% FRL); Cedarcrest High School (943 students, 14% FRL) — zoned schools at 18% FRL track the district average.
- Market conditions: 124 active listings in the ZIP; high-income renter base; 10,555 units permitted in King County in 2024 (7,119 in 5+ unit buildings).
Forward outlook
- Local home prices are declining (-3.0%/yr); year-one equity from $3k of loan paydown is wiped out by about $14k of value loss. Plan a longer hold.
- King County population projected at +44% by 2050 — long-run rental-demand tailwind backs the buy-and-hold thesis.
Negotiation context
- It's been on market 40 days — a 3% lower offer ($465k) is reasonable based on typical stale-listing flexibility.
- 2 sale attempts since 20y ago; this cycle's ask has dropped $120k (20%) from the opening price — seller is motivated, your offer sets the floor, not the list.
- Current owner paid $345k; 39% above their basis — modest negotiation headroom, anchor on the comps not their cost.
Questions for the listing agent
- It's been on market 40 days. Have you received any prior offers? Is the seller open to a 20% concession, seller financing, or rate buy-down credit?
- Is there a deadline driving the sale (1031 exchange, divorce, estate, relocation)? That informs how much negotiation room exists.
- The area grade is low — what's the realistic commute time and amenity access for the typical tenant pool here? Any planned neighborhood developments (good or bad) we should know about?
- What's the average days-on-market for RENTAL listings here right now (not sales)? A rising rental-DOM trend means longer vacancies and softer asking-rent achievability than the comps imply.
- What's the recent tenant-quality profile in this submarket — average credit score on applications, eviction rate, late-payment / NSF rate, and stable-employment percentage? A property-management company in the area should have these aggregated.
- How much new for-sale + rental construction is in the pipeline within 1–3 miles? Heavy new supply typically softens prices + rents 12–24 months out; constrained supply supports both.
Investment metrics
- 1% rule
- 0.80% ✗
- Cap rate
- 6.33%
- Cash-on-cash
- 0.13%
- DSCR
- 1.01
- GRM
- 10.4
CMA / ARV
- ARV (on-the-fly)
- $776,900
- Comps found
- 1
Show comp detail 1 sale within ~0.75 mi
| Address | Dist | Beds/Ba | Sqft | Sold | Price | $/sf | Match |
|---|---|---|---|---|---|---|---|
| 32622 NE 147th St | 0.43mi | 3/2.0 (-1) | 1,782 (+5%) | 17mo | $815,000 | $457 | 49 |
Match score weights: distance 35% · size 25% · config 20% · recency 20%. Top-matched comps best support the ARV.
Projected returns pro-forma
-3.0% appreciation · 3.0% rent growth · sell at horizon
- IRR
- -16.1%
- Equity multiple
- 0.43×
- Total profit
- $-76,776
- Equity at exit
- $71,420
- IRR
- -7.8%
- Equity multiple
- 0.51×
- Total profit
- $-66,092
- Equity at exit
- $41,415
Cash invested: $134,120 (down + closing). Projections, not guarantees.
Landlord ↔ Tenant lean methodology
- Overall (STATE)
- 28 Tenant-Leaning
- State Washington
- 28 Tenant-Leaning · D+8
- County
- — inherits STATE
- City
- — inherits STATE
ZIP-level market 98019
- Active inventory
- 124
- Price-to-rent
- 10.4×
Monthly cashflow live
- Estimated rent
- $3,851 medium interval (Pro) →
- Mortgage (P&I)
- −$2,512
- Tax from tax record
- −$316 /mo · $3,787/yr
- Insurance
- −$200
- HOA
- −$0
- Vacancy / Maint / Mgmt
- −$809
- Net cashflow
- $15
Break-even live
Sensitivity live
| Price | -10% $286 | -5% $151 | +0% $15 | +5% $-121 | +10% $-256 |
|---|---|---|---|---|---|
| Rent | -10% $-289 | -5% $-137 | +0% $15 | +5% $167 | +10% $319 |
| Rate | -1.0pp $256 | -0.5pp $137 | base $15 | +0.5pp $-109 | +1.0pp $-235 |
UW: 25.0% down · 7.5% · 30yr · 1.5% tax · 5.0% vac · 8.0% maint · 8.0% mgmt
Financing live
Cash to close
- Down payment
- $119,750
- Closing costs
- $14,370
- Reserves months
- —
- Total cash needed
- —
Loan-product check · same deal, 3 products live
Conventional
25% down · 7.5% · 30yr
- Down + closing
- —
- Monthly P&I
- —
- Monthly cashflow
- —
- DSCR
- —
- Eligible?
- —
Personal DTI + credit; lowest rate.
DSCR
20% down · 8.5% · 30yr
- Down + closing
- —
- Monthly P&I
- —
- Monthly cashflow
- —
- DSCR
- —
- Eligible?
- —
No personal income docs; deal must DSCR.
Hard money
10% down · 12.0% · 12mo
- Down + closing
- —
- Monthly P&I
- —
- Monthly cashflow
- —
- DSCR
- —
- Eligible?
- —
Short-term bridge; refi at stabilization.
Listing history 20 events
-
2026-06-21days on market $479,000 Active 40 DOM
-
2026-06-18days on market $479,000 Active 37 DOM
-
2026-06-17days on market $479,000 Active 36 DOM
-
2026-06-16days on market $479,000 Active 35 DOM
-
2026-06-15days on market $479,000 Active 34 DOM
-
2026-06-13days on market $479,000 Active 32 DOM
-
2026-06-13days on market $479,000 Active 31 DOM
-
2026-06-09days on market $479,000 Active 28 DOM
-
2026-06-08days on market $479,000 Active 27 DOM
-
2026-06-07days on market $479,000 Active 26 DOM
-
2026-06-04days on market $479,000 Active 23 DOM
-
2026-06-03days on market $479,000 Active 22 DOM
-
2026-06-02days on market $479,000 Active 21 DOM
-
2026-06-01days on market $479,000 Active 20 DOM
-
2026-05-31days on market $479,000 Active 19 DOM
-
2026-05-12$599,000 Active
-
2006-10-26soldstatus $345,000 Closed
-
2006-10-26soldstatus $345,000
-
2006-09-20historical
-
2006-08-21$360,000
ⓘ Source: listings_history table (triggers on properties + properties_extension) + one-shot
backfill from property_details.listing_events for pre-trigger history.
Tax reassessment forecast WA · Resets to sale price
- Current annual tax
- $3,787 · $316/mo
- Projected year-2 tax
- $4,694 · $391/mo
- Expected delta
- +$907/yr (+$76/mo · 24.0%)
ⓘ Screening estimate from a state-policy table — verify with the county assessor before closing.
Climate risk First Street
- Flood 1/10 Low FEMA zone X (unshaded) · 0% chance over 30 yrs
- Wildfire 3/10 Moderate
- Heat 2/10 Low 7 d/yr ≥87°F today · 15 d/yr by 30 yrs out
- Wind 1/10 Low
- Air quality 7/10 Severe 10 unhealthy d/yr today · 13 by 30 yrs out
Nearby sold comps map
Loading sold comps map…
Walkable amenities ~0.75 mi
Loading nearby amenities…
Taxation est. · year 1
- Rental income
- $46,210
- − Mortgage interest
- −$26,831
- − Property taxes
- −$3,787
- − Insurance
- −$2,395
- − Repairs & maintenance
- −$3,697
- − Management
- −$3,697
- − Depreciation
- −$13,935
- Taxable loss
- −$8,132
- Est. tax savings @ 24.0%
- +$1,952
- After-tax cash flow
- $2,132/yr
For passive investors: Depreciation is non-cash, so a rental often shows a tax loss while cash-flowing — sheltering income. Rental losses are passive: they offset passive income freely, and up to $25,000/yr can offset ordinary (W-2) income if you actively participate and your MAGI is under $100k (phasing out to $0 by $150k); unused losses carry forward. On sale, claimed depreciation is recaptured at up to 25%, and gains may owe capital-gains tax (a 1031 exchange can defer both). Figures are a year-1 estimate at your 24.0% rate — not tax advice; consult a CPA.
Schools (NCES district)
- District
- Riverview School District
- NCES district ID
- 5304560
- Math proficiency
- 63% ▲ 5.00%
- Reading proficiency
- 72% ▼ -1.00%
- Median HH income
- $100,574
- Composite
- 63.41/100
- National rank
- #1279
- State rank
- #15 of 291 in WA
Livability — Lake Marcel-Stillwater
No livability data for this city. (Only ~50 U.S. cities are tracked.)
Census & demographics
- County
- King County · 2,251,916 people
- Metro
- Seattle-Tacoma-Bellevue, WA
- Population (ZIP)
- 12,242
- Household income
- $161,212
- Rent vs Own
- Severe rent burden
- 205.0
Population outlook (King County) Hauer SSP2
- Today (2025)
- 2,576,485 people
- By 2030
- 2,803,316 · +8.8%
- By 2040
- 3,255,921 · +26.4%
- By 2050
- 3,706,444 · +43.9%
- By 2075
- 4,746,063 · +84.2%
- By 2100
- 5,407,730 · +109.9%
Race, ethnicity, and origin ACS 2023
- Neighborhood character
- Predominantly White (70%)
- Race & ethnicity
- White 70% Hispanic / Latino 13% Two or more races 11% Asian 10%
- Hispanic origin (detail)
- Mexican 8%
- Common ancestry
- Italian 9% Portuguese 4% Scottish 4%
- Foreign-born
- 16% · Canada, China, Jamaica
- Languages at home
- 84% English-only · Spanish 6% Other Indo-European 3% Other Asian/Pacific 2%
Political lean MEDSL · King
- 2024 margin
- Solid D (+51.7) · D 74.2% · R 22.5% · Other 3.4%
- 2008→2024 swing
- +9.6pp toward D · 2008: 42.1pp · 2024: 51.7pp
- All cycles
- 2024: D+51.7 2020: D+52.7 2016: D+50.4 2012: D+39.9 2008: D+42.1
Not yet ingested
- Civics
- —
Market trends
- HPI YoY
- ▼ -249.87%
- Current HPI
- 343.3702
- Rent YoY
- —
- Metro
- Seattle-Tacoma-Bellevue, WA
- State GDP YoY
- ▲ 4.65%
- F500 in state
- 22
Industry mix (Fortune 500 HQ in WA)
| Industry | F500 HQs | Revenue |
|---|---|---|
| Retail | 2 | $269B |
|
||
| Technology / Retail | 1 | $638B |
|
||
| Technology | 1 | $245B |
|
||
| Telecommunications | 1 | $38B |
|
||
| Food / Beverage | 1 | $36B |
|
||
| Automotive / Trucks | 1 | $34B |
|
||
Price history
+66.4% since first listed5 events — show timeline
- 2026-05-12 Listed $599,000 NWMLS as Distributed by MLS Grid
- 2006-10-26 Sold (Public Records) $345,000 Public Records
- 2006-10-26 Sold (MLS) $345,000 NWMLS as Distributed by MLS Grid
- 2006-09-20 Delisted — NWMLS as Distributed by MLS Grid
- 2006-08-21 Listed $360,000 NWMLS as Distributed by MLS Grid
Property tax history
+2.0%/yrLatest (2025): $3,787 · +4.8% YoY. Source: county tax records.
Cash-flow waterfall
monthlySold comps — $/sqft
last 12 mo · ≤1 miLoading sold comps…