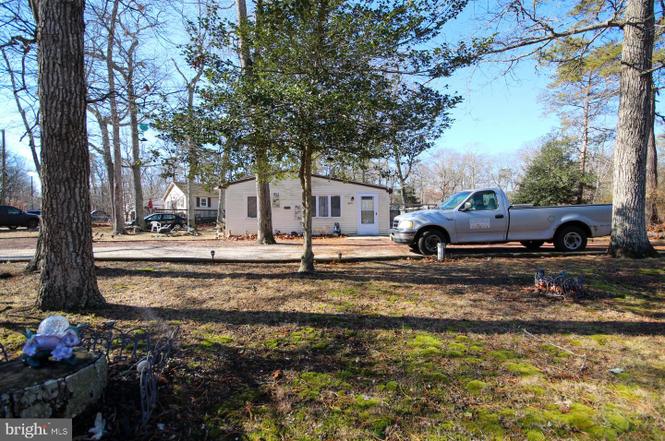
4911 Battle Ln · Laurel Lake, NJ
Flood risk 1/10 · Minimal
- FEMA flood zone
- X (unshaded)
- Chance of flooding over 30 yrs
- 0.0%
- Est. flood insurance / yr
- $507 – $1,088
Fire risk 5/10 · Moderate
- Est. fire insurance / yr
- $526 – $976
Heat risk 7/10 · Major
- Hot days now (above 102°F)
- 7 days/yr
- Hot days in 30 yrs
- 15 days/yr
Wind risk 7/10 · Major
- Chance of severe wind over 30 yrs
- 78.0%
Air-quality risk 3/10 · Minor
- Unhealthy air days now
- 3 days/yr
- Unhealthy air days in 30 yrs
- 5 days/yr
Risk factors via First Street. Map © Google.
Why this score? — see what drove the D+ grade
The composite is a weighted blend of 9 inputs, each scored 0–100. Each bar is that input's sub-score; the figure is the points it added to the 100-point composite (weight × sub-score).
- Cash flow +15.0/30.0
- ARV discount +11.6/15.0
- DSCR +4.6/10.0
- 1% rule +4.4/10.0
- Rent growth +3.0/5.0
- Livability +2.8/5.0
- Condition / age +2.5/5.0
- Schools +1.5/10.0
- Appreciation +0.0/10.0
$169,000
🖨 Deal sheet 📄 Offer letter ✓ Due diligence
Listing remarks
This is a stick built home that qualifies for a mortgage. This 2 bedroom 2 bath home is located on a corner lot. This home has a lot to offer. There’s an open layout with the Living Room, Dining Room and kitchen all open. The two bedrooms are off of the great room. There’s a laundry room off of the main bedroom and the bath is located off the great room. There’s a nice kitchen with lots of room to maneuver and it’s a great home for entertaining and for those that like an open concept. This has off street parking and a lot of yard space to enjoy. It’s a part of Laurel Lakes so there’s a beach and so much more. The lake is amazing and the association fees a
Key facts
- Off street parking
- Laundry room
- Open layout
Tags
Neighborhood map
What this means for you Summary
Snapshot
- This is a 2-bed/1.0-bath single-family listed at $169k.
Deal economics
- At list price, monthly cash flow is $54 ($644/yr) — positive.
- The deal already cash-flows at list — no discount required.
- To meet the 1% rule (rent ≥ 1% of price), the offer needs to be $159k (5.7% below list).
- Recommended offer: $159k (5.7% below list) — sets the bar for 1% rule.
Location & tenants
- Location reads 56/100 on livability (#521 in NJ) — a working-class tenant base; expect higher turnover. Strengths: crime A+, housing A+, cost of living B; Watch: schools F, amenities F, commute F.
- Commercial Township School District (rural): math 5% / reading 29% proficiency, ranked #449 of 472 in NJ (top 95%) — low school quality limits family demand, transient renter base, plan for 1-2y turnover; 65% free/reduced lunch — lower-income household profile, screen leases tightly.
- Market conditions: Rents rising (+1.9%/yr); 296 active listings in the ZIP; 216 units permitted in Cumberland County in 2024 (73 in 5+ unit buildings).
Forward outlook
- Local home prices are declining (-3.0%/yr); year-one equity from $1k of loan paydown is wiped out by about $5k of value loss. Plan a longer hold.
- Cumberland County population projected to shrink 7% by 2050 — rents likely to lag national; underwrite the cash flow, not the appreciation.
Negotiation context
- Only 8 days on market — expect competitive offers; lowballing is unlikely to land.
- 2 sale attempts with the ask held roughly flat each time — persistent listings suggest the price (not the market) is what's stuck; bring a comps-based counter.
- Current owner paid $85k; list at $169k implies a 99% gain — meaningful room to come down on a strong offer.
Risks & watch-outs
- Watch-outs: built in 1958 — expect roof / HVAC / electrical / plumbing capex.
- Climate carrying-cost: major wind risk, 78% chance of damaging wind over 30y; moderate wildfire risk; extreme-heat days projected 7→15/yr by 2055 (HVAC capex compounding) — expect insurance premiums to compound above CPI over the hold.
Questions for the listing agent
- Built in 1958 — when were the roof, HVAC, electrical panel, plumbing, and water heater last replaced?
- Is there a deadline driving the sale (1031 exchange, divorce, estate, relocation)? That informs how much negotiation room exists.
- Schools are F-rated, which usually means shorter tenancies and higher turnover. Who's the typical renter profile here, and what's been the actual vacancy rate?
- The area grade is low — what's the realistic commute time and amenity access for the typical tenant pool here? Any planned neighborhood developments (good or bad) we should know about?
- What's the average days-on-market for RENTAL listings here right now (not sales)? A rising rental-DOM trend means longer vacancies and softer asking-rent achievability than the comps imply.
- What's the recent tenant-quality profile in this submarket — average credit score on applications, eviction rate, late-payment / NSF rate, and stable-employment percentage? A property-management company in the area should have these aggregated.
- How much new for-sale + rental construction is in the pipeline within 1–3 miles? Heavy new supply typically softens prices + rents 12–24 months out; constrained supply supports both.
Investment metrics
- 1% rule
- 0.94% ✗
- Cap rate
- 6.67%
- Cash-on-cash
- 1.36%
- DSCR
- 1.06
- GRM
- 8.8
CMA / ARV
- ARV (on-the-fly)
- $185,840
- Comps found
- 12
Show comp detail 12 sales within ~0.75 mi
| Address | Dist | Beds/Ba | Sqft | Sold | Price | $/sf | Match |
|---|---|---|---|---|---|---|---|
| 122 Mist Rd | 0.12mi | 2/1.0 | 832 (-10%) | 2mo | $70,000 | $84 | 76 |
| 5211 Magnolia Dr | 0.20mi | 3/2.0 (+1) | 960 (+4%) | 7mo | $232,000 | $242 | 68 |
| 5100 Magnolia Dr | 0.14mi | 2/1.0 | 1,009 (+10%) | 13mo | $218,000 | $216 | 66 |
| 36 Walnut Rd | 0.69mi | 3/1.0 (+1) | 960 (+4%) | 1mo | $247,000 | $257 | 54 |
| 110 Daffodil Rd | 0.47mi | 1/2.0 (-1) | 858 (-7%) | 5mo | $187,500 | $219 | 54 |
| 701 Uranus Rd | 0.48mi | 2/1.0 | 1,056 (+15%) | 1mo | $200,100 | $189 | 52 |
| 5601 Briarwood Dr | 0.29mi | 3/2.0 (+1) | 1,040 (+13%) | 9mo | $210,000 | $202 | 48 |
| 232 Jute Rd | 0.60mi | 3/2.0 (+1) | 952 (+4%) | 13mo | $187,500 | $197 | 46 |
| 714 Woodland Dr | 0.66mi | 3/2.0 (+1) | 960 (+4%) | 11mo | $215,450 | $224 | 44 |
| 139 Jute Rd | 0.55mi | 1/1.0 (-1) | 1,016 (+10%) | 13mo | $145,000 | $143 | 42 |
| 173 Point Breeze Dr | 0.47mi | 2/2.0 | 1,050 (+14%) | 14mo | $99,000 | $94 | 39 |
| 119 Olive Rd | 0.64mi | 3/2.0 (+1) | 1,012 (+10%) | 20mo | $144,500 | $143 | 28 |
Match score weights: distance 35% · size 25% · config 20% · recency 20%. Top-matched comps best support the ARV.
Projected returns pro-forma
-3.0% appreciation · 1.94% rent growth · sell at horizon
- IRR
- -15.3%
- Equity multiple
- 0.46×
- Total profit
- $-25,604
- Equity at exit
- $25,198
- IRR
- -8.7%
- Equity multiple
- 0.48×
- Total profit
- $-24,461
- Equity at exit
- $14,612
Cash invested: $47,320 (down + closing). Projections, not guarantees.
Landlord ↔ Tenant lean methodology
- Overall (STATE)
- 21 Tenant-Leaning
- State New Jersey
- 21 Tenant-Leaning · D+6
- County
- — inherits STATE
- City
- — inherits STATE
ZIP-level market 08332
- Home prices YoY
- -28.9%
- Rents YoY
- 1.9%
- Active inventory
- 296
- Price-to-rent
- 8.8×
Monthly cashflow live
- Estimated rent
- $1,593 medium interval (Pro) →
- Mortgage (P&I)
- −$886
- Tax from tax record
- −$248 /mo · $2,980/yr
- Insurance
- −$70
- HOA
- −$0
- Vacancy / Maint / Mgmt
- −$335
- Net cashflow
- $54
Break-even live
UW: 25.0% down · 7.5% · 30yr · 1.5% tax · 5.0% vac · 8.0% maint · 8.0% mgmt
Financing live
Cash to close
- Down payment
- $42,250
- Closing costs
- $5,070
- Reserves months
- —
- Total cash needed
- —
Loan-product check · same deal, 3 products live
Conventional
25% down · 7.5% · 30yr
- Down + closing
- —
- Monthly P&I
- —
- Monthly cashflow
- —
- DSCR
- —
- Eligible?
- —
Personal DTI + credit; lowest rate.
DSCR
20% down · 8.5% · 30yr
- Down + closing
- —
- Monthly P&I
- —
- Monthly cashflow
- —
- DSCR
- —
- Eligible?
- —
No personal income docs; deal must DSCR.
Hard money
10% down · 12.0% · 12mo
- Down + closing
- —
- Monthly P&I
- —
- Monthly cashflow
- —
- DSCR
- —
- Eligible?
- —
Short-term bridge; refi at stabilization.
Listing history 5 events
-
2025-11-28status Pending
-
2025-11-20$169,000 Active
-
2025-04-14historical
-
2025-02-12$185,000 Active
-
2007-01-16soldstatus $85,000
ⓘ Source: listings_history table (triggers on properties + properties_extension) + one-shot
backfill from property_details.listing_events for pre-trigger history.
Tax reassessment forecast NJ · Partial reset (capped growth)
- Current annual tax
- $2,980 · $248/mo
- Projected year-2 tax
- $3,594 · $299/mo
- Expected delta
- +$614/yr (+$51/mo · 20.6%)
ⓘ Screening estimate from a state-policy table — verify with the county assessor before closing.
Climate risk First Street
- Flood 1/10 Low FEMA zone X (unshaded) · 0% chance over 30 yrs
- Wildfire 5/10 Major
- Heat 7/10 Severe 7 d/yr ≥102°F today · 15 d/yr by 30 yrs out
- Wind 7/10 Severe 78% chance of damaging wind over 30 yrs
- Air quality 3/10 Moderate 3 unhealthy d/yr today · 5 by 30 yrs out
Nearby sold comps map
Loading sold comps map…
Walkable amenities ~0.75 mi
Loading nearby amenities…
Taxation est. · year 1
- Rental income
- $19,118
- − Mortgage interest
- −$9,467
- − Property taxes
- −$2,980
- − Insurance
- −$845
- − Repairs & maintenance
- −$1,529
- − Management
- −$1,529
- − Depreciation
- −$4,916
- Taxable loss
- −$2,148
- Est. tax savings @ 24.0%
- +$516
- After-tax cash flow
- $1,159/yr
For passive investors: Depreciation is non-cash, so a rental often shows a tax loss while cash-flowing — sheltering income. Rental losses are passive: they offset passive income freely, and up to $25,000/yr can offset ordinary (W-2) income if you actively participate and your MAGI is under $100k (phasing out to $0 by $150k); unused losses carry forward. On sale, claimed depreciation is recaptured at up to 25%, and gains may owe capital-gains tax (a 1031 exchange can defer both). Figures are a year-1 estimate at your 24.0% rate — not tax advice; consult a CPA.
Schools (NCES district)
- District
- Commercial Township School District
- NCES district ID
- 3403480
- Math proficiency
- 5% ▼ -7.00%
- Reading proficiency
- 29% ▲ 10.00%
- Median HH income
- $45,143
- Composite
- 14.86/100
- National rank
- #9378
- State rank
- #449 of 472 in NJ
Livability — Laurel Lake
- Score
- 56/100
- State rank
- #521
- US rank
- #22397
Category grades
Schools grade is shown separately in the Schools card above.
Census & demographics
- Census place
- Laurel Lake, NJ
- County
- Cumberland County · 80,266 people
- Metro
- Vineland-Bridgeton, NJ
- Population (ZIP)
- 35,228
- Household income
- $67,496
- Rent vs Own
- Severe rent burden
- 1761.0
Population outlook (Cumberland County) Hauer SSP2
- Today (2025)
- 152,743 people
- By 2030
- 150,373 · -1.6%
- By 2040
- 146,881 · -3.8%
- By 2050
- 142,653 · -6.6%
- By 2075
- 129,468 · -15.2%
- By 2100
- 107,456 · -29.6%
Race, ethnicity, and origin ACS 2023
- Neighborhood character
- Diverse neighborhood (Simpson 0.60)
- Race & ethnicity
- White 59% Hispanic / Latino 17% Black 15% Two or more races 11% Asian 2%
- Hispanic origin (detail)
- Mexican 4% Puerto Rican 10%
- Common ancestry
- Romanian 4% Lithuanian 2% Slovak 1%
- Foreign-born
- 7% · Canada
- Languages at home
- 85% English-only · Spanish 11% Other Indo-European 1% Other Asian/Pacific 1%
Political lean MEDSL · Cumberland
- 2024 margin
- Toss-up / Even · D 47.6% · R 51.3% · Other 1.1%
- 2008→2024 swing
- -25.4pp toward R · 2008: 21.6pp · 2024: -3.8pp
- All cycles
- 2024: R+3.8 2020: D+6.0 2016: D+5.3 2012: D+23.1 2008: D+21.6
Not yet ingested
- Civics
- —
Market trends
- HPI YoY
- ▼ -111.45%
- Current HPI
- 274.8011
- Rent YoY
- ▲ 1.94%
- Metro
- Vineland-Bridgeton, NJ
- State GDP YoY
- ▲ 2.05%
- F500 in state
- 34
Industry mix (Fortune 500 HQ in NJ)
| Industry | F500 HQs | Revenue |
|---|---|---|
| Consumer Goods | 3 | $31B |
|
||
| Pharmaceuticals | 2 | $153B |
|
||
| Technology | 2 | $21B |
|
||
| Insurance | 2 | $20B |
|
||
| Healthcare | 2 | $19B |
|
||
| Financial Services | 1 | $70B |
|
||
Price history
+98.8% since first listed5 events — show timeline
- 2025-11-28 Pending — BRIGHT MLS
- 2025-11-20 Listed $169,000 BRIGHT MLS
- 2025-04-14 Listing Removed — BRIGHT MLS
- 2025-02-12 Listed $185,000 BRIGHT MLS
- 2007-01-16 Sold (Public Records) $85,000 Public Records
Property tax history
+3.8%/yrLatest (2025): $2,980 · +4.9% YoY. Source: county tax records.
Cash-flow waterfall
monthlySold comps — $/sqft
last 12 mo · ≤1 miLoading sold comps…