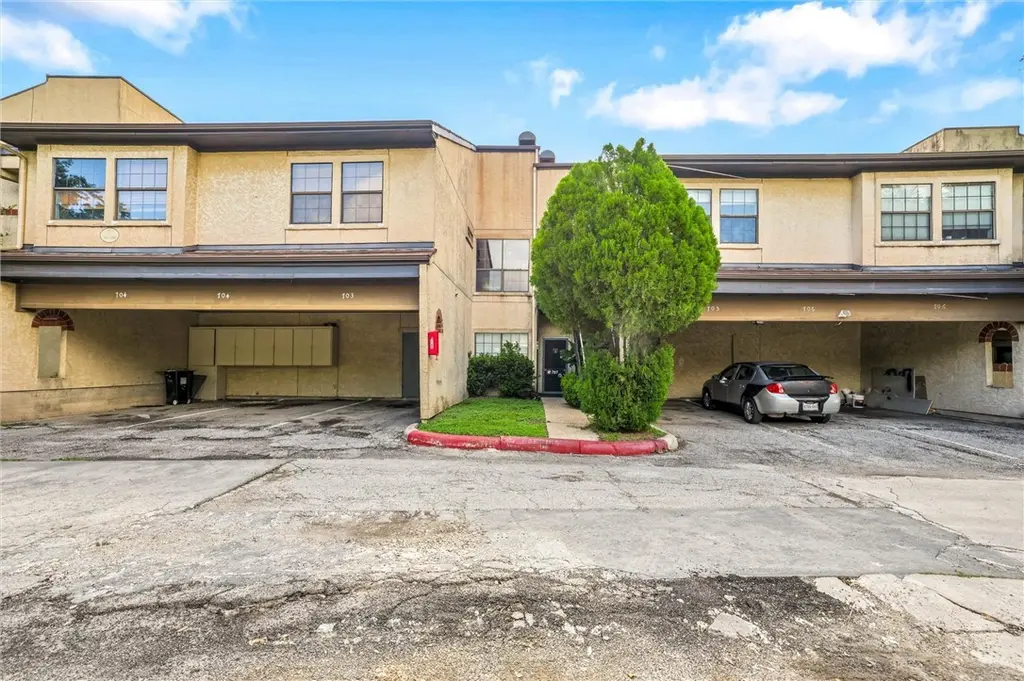
6100 Woodlake Pkwy #706 · San Antonio, TX
Flood risk 1/10 · Minimal
- FEMA flood zone
- X (unshaded)
- Chance of flooding over 30 yrs
- 0.0%
- Est. flood insurance / yr
- $507 – $1,088
Fire risk 4/10 · Minor
- Est. fire insurance / yr
- $1,222 – $2,270
Heat risk 8/10 · Major
- Hot days now (above 108°F)
- 7 days/yr
- Hot days in 30 yrs
- 22 days/yr
Wind risk 8/10 · Major
- Chance of severe wind over 30 yrs
- 80.0%
Air-quality risk 1/10 · Minimal
- Unhealthy air days now
- 0 days/yr
- Unhealthy air days in 30 yrs
- 0 days/yr
Risk factors via First Street. Map © Google.
Why this score? — see what drove the D grade
The composite is a weighted blend of 9 inputs, each scored 0–100. Each bar is that input's sub-score; the figure is the points it added to the 100-point composite (weight × sub-score).
- Cash flow +11.0/30.0
- 1% rule +8.9/10.0
- ARV discount +7.5/15.0
- Livability +4.0/5.0
- DSCR +3.2/10.0
- Rent growth +2.7/5.0
- Condition / age +2.5/5.0
- Schools +2.4/10.0
- Appreciation +0.0/10.0
$99,000
🖨 Deal sheet (PDF) 📄 Offer letter ✓ Due diligence
Listing remarks
Welcome to 6100 Woodlake Pkwy #706 in San Antonio, a comfortable condominium offering 2 bedrooms, 2 full baths, and approximately 1,128 square feet. Built in 1984, this unit provides a practical layout that works well for everyday living, a low-maintenance lifestyle, or an investment opportunity. Enjoy two covered parking spaces, adding extra convenience for owners and guests.
Key facts
- $419 HOA
- 2 garage spots
- Community pool
Tags
Property features AI
Finance
- HOA & community: Homeowners association with monthly fee; HOA fee covers insurance, grounds and structure maintenance, trash, and water; Community amenities include gated entry and pool; Common grounds/area
Exterior
- Parking: Assigned parking; 2-car garage (covered)
- Security: Gated community
- Utilities: Public water; Public sewer
- Home design: Single-story; Stucco construction; Concrete and tile roof; Slab foundation
- Construction: Stucco exterior; Concrete and tile roofing; Slab foundation
- Exterior features: Landscaped grounds; Covered and open patio
Interior
- Kitchen: Electric oven; Electric range; Refrigerator
- Flooring: Tile; Vinyl
- Bathrooms: 2 full bathrooms
- Heating & cooling: Central heating (electric); Central air conditioning
- Interior features: Open floorplan; Tile and vinyl flooring; Fireplace
- Laundry & utility: Washer hookup; Dryer hookup; Washer; Dryer
Neighborhood map
What this means for you Summary
Snapshot
- This is a 2-bed/2.0-bath condo listed at $99k.
Deal economics
- At list price, monthly cash flow is $-41 ($-495/yr) — negative.
- To cash-flow at today's rent, offer at most $92k (7.4% below list).
- Meets the 1% rule at list price ($1k rent vs $99k).
- Recommended offer: $92k (7.4% below list) — sets the bar for cash-flow.
- Cap rate 5.8% vs local median 3.8% in San Antonio — top-decile yield for the area; either an underpriced asset or a hidden risk that comps aren't pricing in. Stress-test before assuming the spread holds.
Location & tenants
- Location reads 80/100 on livability (#31 in TX, #1,616 nationally) — a professional / high-income tenant draw. Strengths: amenities A+, commute A+, cost of living A+; Watch: crime F.
- Judson ISD (suburban): math 21% / reading 33% proficiency, ranked #660 of 826 in TX (top 80%) — low school quality limits family demand, transient renter base, plan for 1-2y turnover.
- Zoned schools: Woodlake El (math 17% / reading 22%, grade F, #3,583 of 4,322 statewide, top 86%, 655 students, 78% FRL); Henry Metzger Middle (math 12% / reading 20%, grade F, #1,543 of 1,662 statewide, top 94%, 953 students, 90% FRL); Karen Wagner H S (math 12% / reading 29%, grade F, #1,389 of 1,632 statewide, top 86%, 2,366 students, 80% FRL) — zoned schools average 83% FRL vs 57% district-wide (26 pts higher); higher-poverty schools than district average — tighter screening recommended.
- Market conditions: Rents flat; 193 active listings in the ZIP; 40 comparable units currently listed for rent nearby; rentals at typical pace (median 22d on market — plan ~3-4 weeks tenant-placement turnaround); 8,308 units permitted in Bexar County in 2024 (2,506 in 5+ unit buildings).
Forward outlook
- Local home prices are declining (-3.0%/yr); year-one equity from $684 of loan paydown is wiped out by about $3k of value loss. Plan a longer hold.
- Bexar County population projected at +50% by 2050 — long-run rental-demand tailwind backs the buy-and-hold thesis.
Negotiation context
- It's been on market 26 days — a 2% lower offer ($98k) is reasonable based on typical stale-listing flexibility.
Risks & watch-outs
- Watch-outs: HOA is 30% of rent.
- Climate carrying-cost: severe wind risk, 80% chance of damaging wind over 30y; extreme-heat days projected 7→22/yr by 2055 (HVAC capex compounding) — expect insurance premiums to compound above CPI over the hold.
Questions for the listing agent
- What do current leases actually rent for vs. the listed asking? Can we see a recent rent roll and the last 12 months of T-12 income?
- What does the HOA fee cover, when was the last increase, and are there any pending special assessments or reserve-fund shortfalls?
- Any open or pending special assessments — roof, HVAC, plumbing, elevator, façade? What's the per-unit balance and payoff schedule, and is the seller paying it off at close or rolling it to the buyer?
- Is there a deadline driving the sale (1031 exchange, divorce, estate, relocation)? That informs how much negotiation room exists.
- Crime grade is F in this area — have there been break-ins, vandalism, or insurance claims at this property in the last 3 years? What carrier currently insures it and at what premium?
- The area grade is low — what's the realistic commute time and amenity access for the typical tenant pool here? Any planned neighborhood developments (good or bad) we should know about?
- What's the average days-on-market for RENTAL listings here right now (not sales)? A rising rental-DOM trend means longer vacancies and softer asking-rent achievability than the comps imply.
- What's the recent tenant-quality profile in this submarket — average credit score on applications, eviction rate, late-payment / NSF rate, and stable-employment percentage? A property-management company in the area should have these aggregated.
- How much new apartment / multifamily construction is in the pipeline within 1–3 miles? Heavy new supply (>2% of stock underway) typically softens rents 12–24 months out; light construction supports rent growth.
Investment metrics
- 1% rule
- 1.39% ✓
- Cap rate
- 5.79%
- Cash-on-cash
- -1.79%
- DSCR
- 0.92
- GRM
- 6.0
CMA / ARV
No comps found within radius.
Projected returns pro-forma
-3.0% appreciation · 0.75% rent growth · sell at horizon
- IRR
- -23.2%
- Equity multiple
- 0.23×
- Total profit
- $-21,420
- Equity at exit
- $14,761
- IRR
- -32.3%
- Equity multiple
- -0.18×
- Total profit
- $-32,784
- Equity at exit
- $8,560
Cash invested: $27,720 (down + closing). Projections, not guarantees.
Landlord ↔ Tenant lean methodology
- Overall (STATE)
- 87 Strongly Landlord-Friendly
- State Texas
- 87 Strongly Landlord-Friendly · R+5
- County
- — inherits STATE
- City
- — inherits STATE
ZIP-level market 78244
- Home prices YoY
- -4.4%
- Rents YoY
- 0.8%
- Active inventory
- 193
- Price-to-rent
- 6.0×
Monthly cashflow live
- Estimated rent
- $1,375 high interval (Pro) →
- Mortgage (P&I)
- −$519
- Tax from tax record
- −$148 /mo · $1,776/yr
- Insurance
- −$41
- HOA
- −$419
- Vacancy / Maint / Mgmt
- −$289
- Net cashflow
- $-41
Break-even live
Sensitivity live
| Price | -10% $15 | -5% $-13 | +0% $-41 | +5% $-69 | +10% $-97 |
|---|---|---|---|---|---|
| Rent | -10% $-150 | -5% $-96 | +0% $-41 | +5% $13 | +10% $67 |
| Rate | -1.0pp $9 | -0.5pp $-16 | base $-41 | +0.5pp $-67 | +1.0pp $-93 |
UW: 25.0% down · 7.5% · 30yr · 1.5% tax · 5.0% vac · 8.0% maint · 8.0% mgmt
Financing live
Cash to close
- Down payment
- $24,750
- Closing costs
- $2,970
- Reserves months
- —
- Total cash needed
- —
Loan-product check · same deal, 3 products live
Conventional
25% down · 7.5% · 30yr
- Down + closing
- —
- Monthly P&I
- —
- Monthly cashflow
- —
- DSCR
- —
- Eligible?
- —
Personal DTI + credit; lowest rate.
DSCR
20% down · 8.5% · 30yr
- Down + closing
- —
- Monthly P&I
- —
- Monthly cashflow
- —
- DSCR
- —
- Eligible?
- —
No personal income docs; deal must DSCR.
Hard money
10% down · 12.0% · 12mo
- Down + closing
- —
- Monthly P&I
- —
- Monthly cashflow
- —
- DSCR
- —
- Eligible?
- —
Short-term bridge; refi at stabilization.
Rent comps 40 comps
| Address | Beds | Baths | Sqft | Rent | $/sqft | DOM | Units | Dist |
|---|---|---|---|---|---|---|---|---|
| 6100 Woodlake Pkwy San Antonio, TX | 1.0 | 1.0 | 910 | $1,550 | $1.70 | 45d | 1 | 0.01mi |
| 7117 Micayla Cv Unit 103 San Antonio, TX | 3.0 | 2.5 | 1219 | $1,350 | $1.11 | 4d | 1 | 0.07mi |
| 6015 Jax Way Unit 102 San Antonio, TX | 3.0 | 2.5 | 1219 | $1,295 | $1.06 | 45d | 1 | 0.09mi |
| 6011 Jax Way #104 San Antonio, TX | 3.0 | 2.5 | 1219 | $1,395 | $1.14 | 45d | 1 | 0.10mi |
| 6002 Jax Way #102 San Antonio, TX | 3.0 | 2.5 | 1219 | $1,350 | $1.11 | 6d | 1 | 0.10mi |
| 7014 Donovan Way #103 San Antonio, TX | 3.0 | 2.5 | 1219 | $1,350 | $1.11 | 19d | 1 | 0.12mi |
| 7105 Micayla Cv #104 San Antonio, TX | 3.0 | 2.5 | 1245 | $1,395 | $1.12 | 45d | 1 | 0.12mi |
| 7105 Micayla Cv #104 San Antonio, TX | 3.0 | 2.5 | 1219 | $1,395 | $1.14 | 16d | 1 | 0.12mi |
| 7105 Micayla Cv #104 San Antonio, TX | 3.0 | 2.5 | 1219 | $1,395 | $1.14 | 0d | 1 | 0.12mi |
| 7102 Micayla Cv Unit 103 San Antonio, TX | 3.0 | 2.5 | 1250 | $1,395 | $1.12 | 6d | 1 | 0.13mi |
| 7102 Micayla Cv Unit 103 San Antonio, TX | 3.0 | 2.5 | 1250 | $1,395 | $1.12 | 0d | 1 | 0.13mi |
| 7010 Donovan Way #101 San Antonio, TX | 3.0 | 2.5 | 1219 | $1,395 | $1.14 | 0d | 1 | 0.13mi |
| 7010 Donovan Way #101 San Antonio, TX | 3.0 | 2.5 | 1219 | $1,395 | $1.14 | 6d | 1 | 0.13mi |
| 5822 Golf Bnd Unit 2 San Antonio, TX | 3.0 | 2.5 | 1325 | $1,325 | $1.00 | 45d | 1 | 0.14mi |
| 7219 Golf Way San Antonio, TX | 3.0 | 2.0 | 1220 | $1,195 | $0.98 | 0d | 1 | 0.14mi |
| 5807 Golf Bnd #2 San Antonio, TX | 3.0 | 2.5 | 1321 | $1,200 | $0.91 | 5d | 1 | 0.15mi |
| 5807 Golf Bnd #2 San Antonio, TX | 3.0 | 2.5 | 1321 | $1,200 | $0.91 | 0d | 1 | 0.15mi |
| 7006 Donovan Way Unit 101 San Antonio, TX | 3.0 | 2.5 | 1219 | $1,395 | $1.14 | 22d | 1 | 0.15mi |
| 7006 Donovan Way Unit 101 San Antonio, TX | 3.0 | 2.5 | 1219 | $1,395 | $1.14 | 0d | 1 | 0.15mi |
| 7006 Donovan Way Unit 101 San Antonio, TX | 3.0 | 2.5 | 1219 | $1,395 | $1.14 | 45d | 1 | 0.15mi |
| 7222 Golf Way #2 San Antonio, TX | 3.0 | 2.0 | 1220 | $1,300 | $1.07 | 0d | 1 | 0.15mi |
| 6011 Karly Way Unit 103 San Antonio, TX | 3.0 | 2.5 | 1219 | $1,295 | $1.06 | 45d | 1 | 0.18mi |
| 6015 Karly Way #101 San Antonio, TX | 2.0 | 2.5 | 1219 | $1,425 | $1.17 | 22d | 1 | 0.19mi |
| 6015 Karly Way #101 San Antonio, TX | 2.0 | 2.5 | 1219 | $1,425 | $1.17 | 0d | 1 | 0.19mi |
| 6015 Karly Way Unit 103 San Antonio, TX | 3.0 | 2.5 | 1219 | $1,295 | $1.06 | 45d | 1 | 0.19mi |
| 6019 Karly Way #101 San Antonio, TX | 3.0 | 2.5 | 1219 | $1,395 | $1.14 | 16d | 1 | 0.19mi |
| 6019 Karly Way #101 San Antonio, TX | 3.0 | 2.5 | 1219 | $1,395 | $1.14 | 0d | 1 | 0.19mi |
| 6019 Karly Way #101 San Antonio, TX | 3.0 | 2.5 | 1219 | $1,395 | $1.14 | 45d | 1 | 0.19mi |
| 5730 Golf Hts Unit 1 San Antonio, TX | 3.0 | 2.5 | 1321 | $1,300 | $0.98 | 0d | 1 | 0.20mi |
| 5607 Golf Mist Unit 1 San Antonio, TX | 3.0 | 2.5 | 1321 | $1,245 | $0.94 | 23d | 1 | 0.24mi |
| 5607 Golf Mist Unit 1 San Antonio, TX | 3.0 | 2.5 | 1321 | $1,295 | $0.98 | 25d | 1 | 0.24mi |
| 7018 Elmbank San Antonio, TX | 2.0 | 1.0 | 1050 | $1,200 | $1.14 | 25d | 1 | 0.25mi |
| 7016 Elmbank San Antonio, TX | 2.0 | 2.0 | 1193 | $1,125 | $0.94 | 5d | 1 | 0.26mi |
| 7017 Silver Cyn Unit 7017-SC San Antonio, TX | 2.0 | 1.0 | 1055 | $1,100 | $1.04 | 45d | 1 | 0.27mi |
| 7323 Golf Vista Blvd San Antonio, TX | 2.0 | 2.0 | 1100 | $1,200 | $1.09 | 25d | 1 | 0.32mi |
| 7027 FM 78 San Antonio, TX | 1.0–3.0 | 1.0–2.0 | 868 | $1,914 | $2.20 | 22d | 10 | 0.34mi |
| 5613 Lochmoor #2 San Antonio, TX | 2.0 | 1.0 | 800 | $1,050 | $1.31 | 45d | 1 | 0.34mi |
| 5613 Lochmoor #2 San Antonio, TX | 2.0 | 1.0 | 800 | $1,050 | $1.31 | 23d | 1 | 0.34mi |
| 5609 Lochmoor Unit 1 San Antonio, TX | 2.0 | 1.0 | 800 | $825 | $1.03 | 45d | 1 | 0.35mi |
| 5607 Lochmoor Unit 2 San Antonio, TX | 2.0 | 1.0 | 825 | $875 | $1.06 | 45d | 1 | 0.35mi |
HOA detail condo
- Monthly dues
- $419 · $5,028/yr
- Assessments
- None detected in remarks — confirm with the listing agent.
Listing history 19 events
-
2026-06-21days on market $99,000 Active 26 DOM
-
2026-06-18days on market $99,000 Active 23 DOM
-
2026-06-17days on market $99,000 Active 22 DOM
-
2026-06-16days on market $99,000 Active 21 DOM
-
2026-06-15days on market $99,000 Active 20 DOM
-
2026-06-13days on market $99,000 Active 18 DOM
-
2026-06-09days on market $99,000 Active 14 DOM
-
2026-06-08days on market $99,000 Active 13 DOM
-
2026-06-07days on market $99,000 Active 12 DOM
-
2026-06-04days on market $99,000 Active 9 DOM
-
2026-06-03days on market $99,000 Active 8 DOM
-
2026-06-02days on market $99,000 Active 7 DOM
-
2026-06-01days on market $99,000 Active 6 DOM
-
2026-05-31days on market $99,000 Active 5 DOM
-
2026-05-21$99,000 Active
-
2026-02-18soldstatus
-
2020-10-21soldstatus
-
2018-07-31soldstatus
-
2009-01-05soldstatus
ⓘ Source: listings_history table (triggers on properties + properties_extension) + one-shot
backfill from property_details.listing_events for pre-trigger history.
Tax reassessment forecast TX · Resets to sale price
- Current annual tax
- $1,776 · $148/mo
- Projected year-2 tax
- $1,812 · $151/mo
- Expected delta
- +$36/yr (+$3/mo · 2.0%)
ⓘ Screening estimate from a state-policy table — verify with the county assessor before closing.
Climate risk First Street
- Flood 1/10 Low FEMA zone X (unshaded) · 0% chance over 30 yrs
- Wildfire 4/10 Moderate
- Heat 8/10 Severe 7 d/yr ≥108°F today · 22 d/yr by 30 yrs out
- Wind 8/10 Severe 80% chance of damaging wind over 30 yrs
- Air quality 1/10 Low 0 unhealthy d/yr today · 0 by 30 yrs out
Nearby sold comps map
Loading sold comps map…
Walkable amenities ~0.75 mi
Loading nearby amenities…
Taxation est. · year 1
- Rental income
- $16,499
- − Mortgage interest
- −$5,546
- − Property taxes
- −$1,776
- − Insurance
- −$495
- − Repairs & maintenance
- −$1,320
- − Management
- −$1,320
- − HOA
- −$5,028
- − Depreciation
- −$2,880
- Taxable loss
- −$1,865
- Est. tax savings @ 24.0%
- +$448
- After-tax cash flow
- $-47/yr
For passive investors: Depreciation is non-cash, so a rental often shows a tax loss while cash-flowing — sheltering income. Rental losses are passive: they offset passive income freely, and up to $25,000/yr can offset ordinary (W-2) income if you actively participate and your MAGI is under $100k (phasing out to $0 by $150k); unused losses carry forward. On sale, claimed depreciation is recaptured at up to 25%, and gains may owe capital-gains tax (a 1031 exchange can defer both). Figures are a year-1 estimate at your 24.0% rate — not tax advice; consult a CPA.
Schools (NCES district)
- District
- Judson ISD
- NCES district ID
- 4824990
- Math proficiency
- 21% ▼ -21.00%
- Reading proficiency
- 33% ▼ -7.00%
- Median HH income
- $57,542
- Composite
- 24.39/100
- National rank
- #7689
- State rank
- #660 of 826 in TX
Livability — San Antonio
- Score
- 80/100
- State rank
- #31
- US rank
- #1616
Category grades
Schools grade is shown separately in the Schools card above.
Census & demographics
- County
- Bexar County · 1,990,555 people
- City population
- 1,806,925
- Metro
- San Antonio-New Braunfels, TX
- Population (ZIP)
- 38,092
- Household income
- $71,128
- Rent vs Own
- Severe rent burden
- 677.0
Population outlook (Bexar County) Hauer SSP2
- Today (2025)
- 2,336,851 people
- By 2030
- 2,560,728 · +9.6%
- By 2040
- 3,020,569 · +29.3%
- By 2050
- 3,493,522 · +49.5%
- By 2075
- 4,668,459 · +99.8%
- By 2100
- 5,533,242 · +136.8%
Race, ethnicity, and origin ACS 2023
- Neighborhood character
- Diverse neighborhood (Simpson 0.68)
- Race & ethnicity
- Hispanic / Latino 46% Black 27% Two or more races 24% White 20% Asian 2%
- Hispanic origin (detail)
- Mexican 38% Puerto Rican 2% Cuban 2%
- Common ancestry
- Slovak 2% Lithuanian 1% Italian 1%
- Foreign-born
- 14% · Canada, Vietnam
- Languages at home
- 68% English-only · Spanish 28% Vietnamese 1% Tagalog/Filipino 1%
Political lean MEDSL · Bexar
- 2024 margin
- Lean D (+9.8) · D 54.3% · R 44.6% · Other 1.1%
- 2008→2024 swing
- +4.2pp toward D · 2008: 5.6pp · 2024: 9.8pp
- All cycles
- 2024: D+9.8 2020: D+18.2 2016: D+13.5 2012: D+4.6 2008: D+5.6
Not yet ingested
- Civics
- —
Market trends
- HPI YoY
- ▼ -11.42%
- Current HPI
- 249.3834
- Rent YoY
- ▲ 0.75%
- Metro
- San Antonio-New Braunfels, TX
- State GDP YoY
- ▲ 3.95%
- F500 in state
- 110
Industry mix (Fortune 500 HQ in TX)
| Industry | F500 HQs | Revenue |
|---|---|---|
| Energy | 16 | $1,198B |
|
||
| Technology | 5 | $198B |
|
||
| Engineering / Construction | 4 | $72B |
|
||
| Energy Services | 3 | $60B |
|
||
| Utilities | 3 | $41B |
|
||
| Healthcare | 2 | $330B |
|
||
Price history
5 events — show timeline
- 2026-05-21 Listed $99,000 CBMLS
- 2026-02-18 Sold (Public Records) — Public Records
- 2020-10-21 Sold (Public Records) — Public Records
- 2018-07-31 Sold (Public Records) — Public Records
- 2009-01-05 Sold (Public Records) — Public Records
Property tax history
+9.6%/yrLatest (2025): $1,776 · -3.1% YoY. Source: county tax records.
Cash-flow waterfall
monthlySold comps — $/sqft
last 12 mo · ≤1 miLoading sold comps…