1093 Bear Creek Rd · Pinson, TN
Flood risk 1/10 · Minimal
- FEMA flood zone
- X (shaded)
- Chance of flooding over 30 yrs
- 0.0%
- Est. flood insurance / yr
- $507 – $1,088
Fire risk 2/10 · Minimal
- Est. fire insurance / yr
- $949 – $1,763
Heat risk 6/10 · Moderate
- Hot days now (above 109°F)
- 7 days/yr
- Hot days in 30 yrs
- 21 days/yr
Wind risk 4/10 · Minor
- Chance of severe wind over 30 yrs
- 19.0%
Air-quality risk 1/10 · Minimal
- Unhealthy air days now
- 0 days/yr
- Unhealthy air days in 30 yrs
- 0 days/yr
Risk factors via First Street. Map © Google.
Why this score? — see what drove the B+ grade
The composite is a weighted blend of 9 inputs, each scored 0–100. Each bar is that input's sub-score; the figure is the points it added to the 100-point composite (weight × sub-score).
- Cash flow +26.7/30.0
- ARV discount +15.0/15.0
- Appreciation +10.0/10.0
- DSCR +9.2/10.0
- 1% rule +5.9/10.0
- Rent growth +2.5/5.0
- Livability +2.5/5.0
- Condition / age +2.5/5.0
- Schools +1.2/10.0
$175,000
🖨 Deal sheet (PDF) 📄 Offer letter ✓ Due diligence
Listing remarks MLS
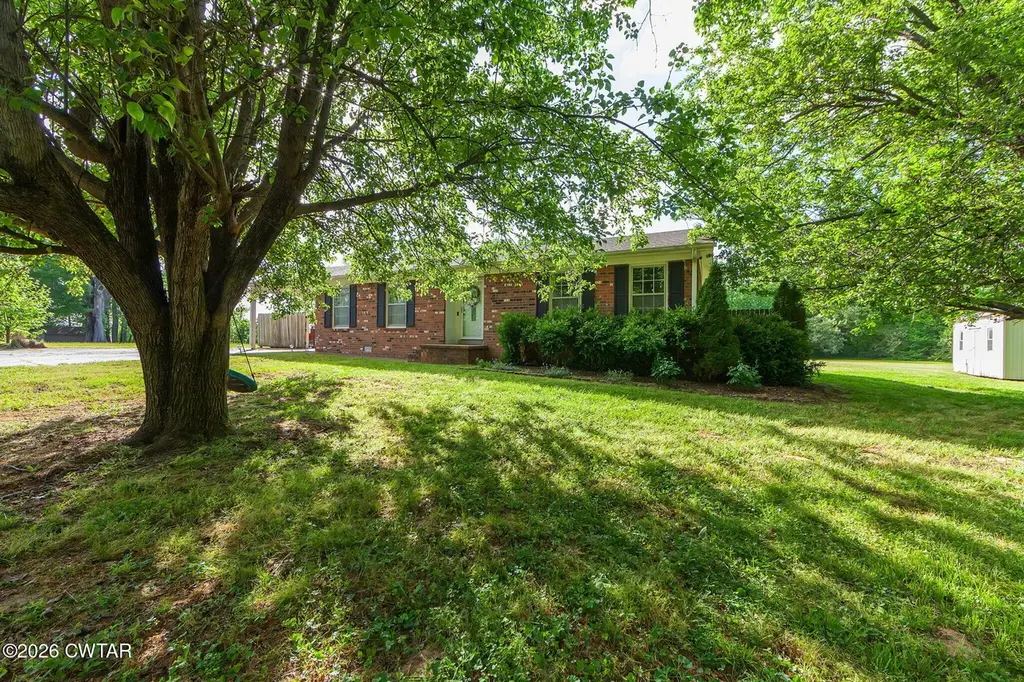
Excellent opportunity to own a move in ready 3-bedroom 1.5-bath home. This amazing property is in a beautiful location perfect for country living. The large backyard is a perfect area to entertain or to relax and enjoy the gorgeous views. The property has a large storage building 12x20 perfect for storing all your outdoor tools. Call today to get your private showing.
Key facts
- Close to town
- Spacious backyard
- Remodeled bathroom
Tags
Property features AI
Exterior
- Parking: 3 total parking spaces; 1 covered carport space; 2 open parking spaces; Open parking pad
- Security: Smoke detectors
- Utilities: Public water; Public sewer; Electricity connected (220 volts)
- Home design: Single family residence; One-level home (1 story); Residential property
- Construction: Brick and other exterior materials; Composition roof; Permanent foundation; Home warranty included
- Exterior features: Rain gutters; Patio; Porch; Storage structure
Interior
- Kitchen: Dishwasher; Electric range; Refrigerator; Stainless steel appliances
- Bedrooms: 3 bedrooms on the main level
- Flooring: Carpet; Ceramic tile
- Bathrooms: 1 full bathroom; 1 half bathroom; 2 bathrooms on the main level
- Heating & cooling: Central heating; Central air; Ceiling fans
- Interior features: Ceiling fans; Eat-in kitchen; Gas starter fireplace
- Laundry & utility: Washer hookup on main level; Electric dryer hookup
Neighborhood map
What this means for you Summary
Snapshot
- This is a 3-bed/2.0-bath single-family listed at $175k.
Deal economics
- At list price, monthly cash flow is $473 ($6k/yr) — positive.
- The deal already cash-flows at list — no discount required.
- Meets the 1% rule at list price ($2k rent vs $175k).
- Recommended offer: $172k (1.5% below list) — sets the bar for market timing.
Location & tenants
- Location reads: area grade B — affects rentability + tenant quality, not the cash-flow math above.
- Madison County (urban): math 10% / reading 17% proficiency, ranked #131 of 139 in TN (top 94%) — low school quality limits family demand, transient renter base, plan for 1-2y turnover; 68% free/reduced lunch — lower-income household profile, screen leases tightly.
- Zoned schools: South Elementary (math 27% / reading 37%, grade F, #369 of 952 statewide, top 42%, 433 students, 0% FRL); West-Bemis Middle School (math 9% / reading 13%, grade F, #252 of 333 statewide, top 76%, 373 students, 0% FRL); South Side High School (math 10% / reading 15%, grade F, #257 of 332 statewide, top 78%, 810 students, 0% FRL) — zoned schools average 0% FRL vs 68% district-wide (68 pts lower); this property's tenant base skews higher-income than the district average.
- Market conditions: 26 active listings in the ZIP; 247 units permitted in Madison County in 2024 (0 in 5+ unit buildings).
Forward outlook
- In year one you build about $19k of equity ($1k loan paydown + $18k appreciation (10.0% local appreciation)).
- Madison County population projected at -12% by 2050 — secular population decline; favor cash flow + early exit over multi-decade hold.
- At projected returns (10.0% appreciation + 3.0% rent growth), your $49k cash investment doubles in ~2 years — after that, you're playing with house money.
- By year 2, paydown + projected appreciation supports a ~$30k cash-out refi (75% LTV) — recoverable capital for the next deal without selling this one.
Negotiation context
- It's been on market 19 days — a 2% lower offer ($172k) is reasonable based on typical stale-listing flexibility.
- 2 sale attempts since 6y ago; this cycle's ask has dropped $55k (24%) from the opening price — seller is motivated, your offer sets the floor, not the list.
- Current owner paid $105k; list at $175k implies a 67% gain — meaningful room to come down on a strong offer.
Risks & watch-outs
- Climate carrying-cost: extreme-heat days projected 7→21/yr by 2055 (HVAC capex compounding) — expect insurance premiums to compound above CPI over the hold.
Questions for the listing agent
- Built in 1976 — when were the roof, HVAC, electrical panel, plumbing, and water heater last replaced?
- Is there a deadline driving the sale (1031 exchange, divorce, estate, relocation)? That informs how much negotiation room exists.
- What's the average days-on-market for RENTAL listings here right now (not sales)? A rising rental-DOM trend means longer vacancies and softer asking-rent achievability than the comps imply.
- What's the recent tenant-quality profile in this submarket — average credit score on applications, eviction rate, late-payment / NSF rate, and stable-employment percentage? A property-management company in the area should have these aggregated.
- How much new for-sale + rental construction is in the pipeline within 1–3 miles? Heavy new supply typically softens prices + rents 12–24 months out; constrained supply supports both.
Investment metrics
- 1% rule
- 1.09% ✓
- Cap rate
- 9.54%
- Cash-on-cash
- 11.58%
- DSCR
- 1.52
- GRM
- 7.6
CMA / ARV
- ARV (on-the-fly)
- $229,038
- Comps found
- 4
Show comp detail 4 sales within ~0.75 mi
| Address | Dist | Beds/Ba | Sqft | Sold | Price | $/sf | Match |
|---|---|---|---|---|---|---|---|
| 1093 Bear Creek Rd | 0.00mi | 3/1.5 | 1,294 (0%) | 0mo | $154,000 | $119 | 98 |
| 20 Ozier Rd | 0.44mi | 3/2.0 | 1,316 (+2%) | 4mo | $233,000 | $177 | 74 |
| 1047 Bear Creek Rd | 0.22mi | 3/1.0 | 1,100 (-15%) | 14mo | $189,900 | $173 | 49 |
| 938 Bear Creek Rd | 0.72mi | 3/2.0 | 1,483 (+15%) | 23mo | $265,000 | $179 | 22 |
Match score weights: distance 35% · size 25% · config 20% · recency 20%. Top-matched comps best support the ARV.
Projected returns pro-forma
10.0% appreciation · 3.0% rent growth · sell at horizon
- IRR
- 32.8%
- Equity multiple
- 3.56×
- Total profit
- $125,352
- Equity at exit
- $157,654
- IRR
- 28.3%
- Equity multiple
- 8.05×
- Total profit
- $345,300
- Equity at exit
- $339,987
Cash invested: $49,000 (down + closing). Projections, not guarantees.
Landlord ↔ Tenant lean methodology
- Overall (STATE)
- 87 Strongly Landlord-Friendly
- State Tennessee
- 87 Strongly Landlord-Friendly · R+13
- County
- — inherits STATE
- City
- — inherits STATE
ZIP-level market 38366
- Home prices YoY
- 4.4%
- Active inventory
- 26
- Price-to-rent
- 7.6×
Monthly cashflow live
- Estimated rent
- $1,911 medium interval (Pro) →
- Mortgage (P&I)
- −$918
- Tax from tax record
- −$46 /mo · $551/yr
- Insurance
- −$73
- HOA
- −$0
- Vacancy / Maint / Mgmt
- −$401
- Net cashflow
- $473
Break-even live
Sensitivity live
| Price | -10% $572 | -5% $522 | +0% $473 | +5% $423 | +10% $374 |
|---|---|---|---|---|---|
| Rent | -10% $322 | -5% $397 | +0% $473 | +5% $548 | +10% $624 |
| Rate | -1.0pp $561 | -0.5pp $517 | base $473 | +0.5pp $428 | +1.0pp $381 |
UW: 25.0% down · 7.5% · 30yr · 1.5% tax · 5.0% vac · 8.0% maint · 8.0% mgmt
Financing live
Cash to close
- Down payment
- $43,750
- Closing costs
- $5,250
- Reserves months
- —
- Total cash needed
- —
Loan-product check · same deal, 3 products live
Conventional
25% down · 7.5% · 30yr
- Down + closing
- —
- Monthly P&I
- —
- Monthly cashflow
- —
- DSCR
- —
- Eligible?
- —
Personal DTI + credit; lowest rate.
DSCR
20% down · 8.5% · 30yr
- Down + closing
- —
- Monthly P&I
- —
- Monthly cashflow
- —
- DSCR
- —
- Eligible?
- —
No personal income docs; deal must DSCR.
Hard money
10% down · 12.0% · 12mo
- Down + closing
- —
- Monthly P&I
- —
- Monthly cashflow
- —
- DSCR
- —
- Eligible?
- —
Short-term bridge; refi at stabilization.
Listing history 12 events
-
2026-05-12status Pending
-
2026-05-07price $175,000
-
2026-05-05price $199,900
-
2026-04-28price $205,000
-
2026-04-27price $215,900
-
2026-04-27price $219,900
-
2026-04-23$229,900 Active
-
2020-04-23soldstatus $105,000
-
2020-04-22soldstatus $105,000 370-char remark
Show marketing remark (370 chars)
Excellent opportunity to own a move in ready 3-bedroom 1.5-bath home. This amazing property is in a beautiful location perfect for country living. The large backyard is a perfect area to entertain or to relax and enjoy the gorgeous views. The property has a large storage building 12x20 perfect for storing all your outdoor tools. Call today to get your private showing.
-
2020-03-12$105,000 370-char remark
Show marketing remark (370 chars)
Excellent opportunity to own a move in ready 3-bedroom 1.5-bath home. This amazing property is in a beautiful location perfect for country living. The large backyard is a perfect area to entertain or to relax and enjoy the gorgeous views. The property has a large storage building 12x20 perfect for storing all your outdoor tools. Call today to get your private showing.
-
2015-04-20soldstatus $83,000
-
2010-12-02soldstatus $80,000
ⓘ Source: listings_history table (triggers on properties + properties_extension) + one-shot
backfill from property_details.listing_events for pre-trigger history.
Tax reassessment forecast TN · Resets to sale price
- Current annual tax
- $551 · $46/mo
- Projected year-2 tax
- $1,242 · $104/mo
- Expected delta
- +$692/yr (+$58/mo · 125.5%)
ⓘ Screening estimate from a state-policy table — verify with the county assessor before closing.
Climate risk First Street
- Flood 1/10 Low FEMA zone X (shaded) · 0% chance over 30 yrs
- Wildfire 2/10 Low
- Heat 6/10 Major 7 d/yr ≥109°F today · 21 d/yr by 30 yrs out
- Wind 4/10 Moderate 19% chance of damaging wind over 30 yrs
- Air quality 1/10 Low 0 unhealthy d/yr today · 0 by 30 yrs out
Nearby sold comps map
Loading sold comps map…
Walkable amenities ~0.75 mi
Loading nearby amenities…
Taxation est. · year 1
- Rental income
- $22,928
- − Mortgage interest
- −$9,803
- − Property taxes
- −$551
- − Insurance
- −$875
- − Repairs & maintenance
- −$1,834
- − Management
- −$1,834
- − Depreciation
- −$5,091
- Taxable income
- $2,940
- Est. tax owed @ 24.0%
- −$706
- After-tax cash flow
- $4,969/yr
For passive investors: Depreciation is non-cash, so a rental often shows a tax loss while cash-flowing — sheltering income. Rental losses are passive: they offset passive income freely, and up to $25,000/yr can offset ordinary (W-2) income if you actively participate and your MAGI is under $100k (phasing out to $0 by $150k); unused losses carry forward. On sale, claimed depreciation is recaptured at up to 25%, and gains may owe capital-gains tax (a 1031 exchange can defer both). Figures are a year-1 estimate at your 24.0% rate — not tax advice; consult a CPA.
Schools (NCES district)
- District
- Madison County
- NCES district ID
- 4702580
- Math proficiency
- 10% ▼ -11.00%
- Reading proficiency
- 17% ▼ -4.00%
- Median HH income
- $42,015
- Composite
- 11.74/100
- National rank
- #9687
- State rank
- #131 of 139 in TN
Livability — Pinson
No livability data for this city. (Only ~50 U.S. cities are tracked.)
Census & demographics
- Census place
- Pinson, TN
- City population
- 2,386
- Population (ZIP)
- 2,386
Population outlook (Madison County) Hauer SSP2
- Today (2025)
- 95,952 people
- By 2030
- 94,264 · -1.8%
- By 2040
- 89,607 · -6.6%
- By 2050
- 84,133 · -12.3%
- By 2075
- 72,215 · -24.7%
- By 2100
- 62,062 · -35.3%
Race, ethnicity, and origin ACS 2023
- Neighborhood character
- Predominantly White (86%)
- Race & ethnicity
- White 86% Two or more races 5% Hispanic / Latino 5% Black 4%
- Common ancestry
- Serbian 4% Portuguese 1% Slovak 1%
- Foreign-born
- 1% · Canada
- Languages at home
- 97% English-only · Spanish 3%
Political lean MEDSL · Madison
- 2024 margin
- R (+18.2) · D 40.3% · R 58.5% · Other 1.2%
- 2008→2024 swing
- +3.4pp toward D · 2008: -21.6pp · 2024: -18.2pp
- All cycles
- 2024: R+18.2 2020: R+12.9 2016: R+15.6 2012: R+8.9 2008: R+21.6
Not yet ingested
- Civics
- —
Market trends
- HPI YoY
- ▲ 10.09%
- Current HPI
- 241.1757
- Rent YoY
- —
- Metro
- —
- State GDP YoY
- ▲ 2.78%
- F500 in state
- 22
Industry mix (Fortune 500 HQ in TN)
| Industry | F500 HQs | Revenue |
|---|---|---|
| Healthcare | 3 | $91B |
|
||
| Retail | 3 | $72B |
|
||
| Transportation / Logistics | 1 | $88B |
|
||
| Paper / Packaging | 1 | $19B |
|
||
| Insurance | 1 | $13B |
|
||
| Energy | 1 | $12B |
|
||
Price history
+118.8% since first listed12 events — show timeline
- 2026-05-12 Pending — CWTAR
- 2026-05-07 Price Changed $175,000 CWTAR
- 2026-05-05 Price Changed $199,900 CWTAR
- 2026-04-28 Price Changed $205,000 CWTAR
- 2026-04-27 Price Changed $215,900 CWTAR
- 2026-04-27 Price Changed $219,900 CWTAR
- 2026-04-23 Listed $229,900 CWTAR
- 2020-04-23 Sold (Public Records) $105,000 Public Records
- 2020-04-22 Sold (MLS) $105,000 CWTAR
- 2020-03-12 Listed $105,000 CWTAR
- 2015-04-20 Sold (Public Records) $83,000 Public Records
- 2010-12-02 Sold (Public Records) $80,000 Public Records
Property tax history
+4.2%/yrLatest (2025): $551 · +0.0% YoY. Source: county tax records.
Cash-flow waterfall
monthlySold comps — $/sqft
last 12 mo · ≤1 miLoading sold comps…