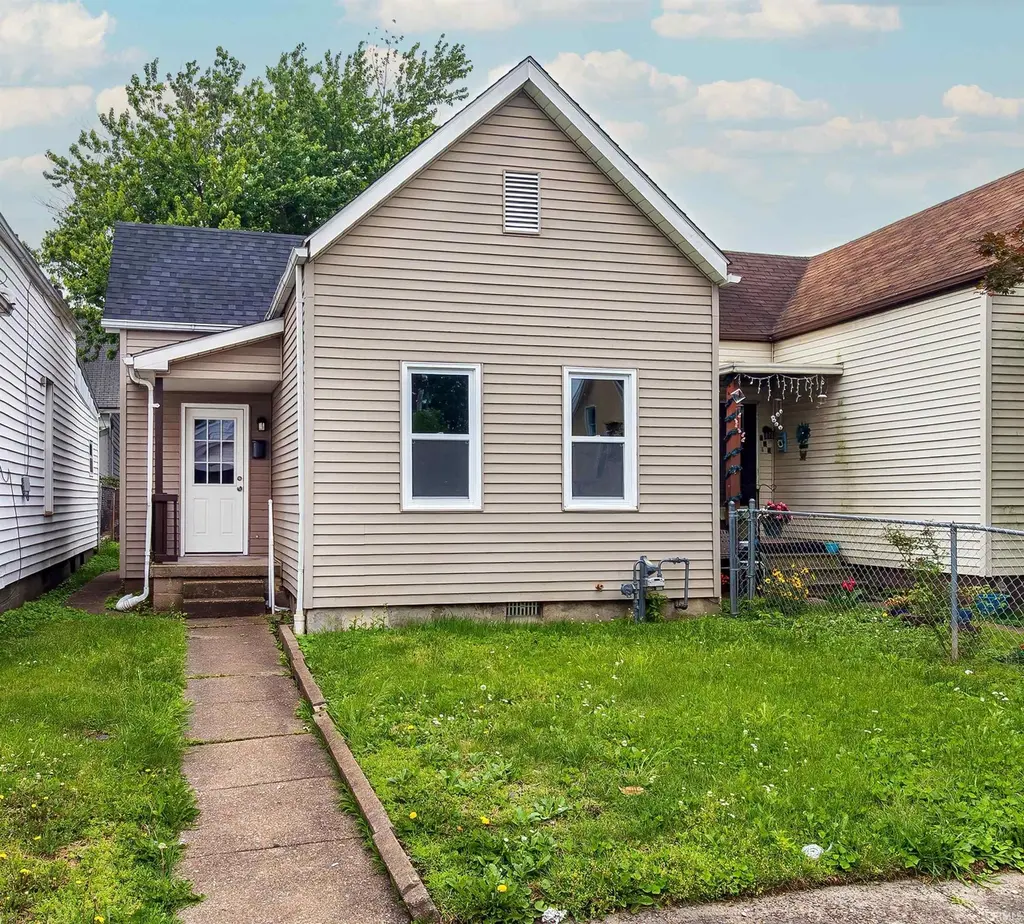
217 E Oregon St · Evansville, IN
Flood risk 1/10 · Minimal
- FEMA flood zone
- X (unshaded)
- Chance of flooding over 30 yrs
- 0.0%
- Est. flood insurance / yr
- $507 – $1,088
Fire risk 1/10 · Minimal
- Est. fire insurance / yr
- $717 – $1,331
Heat risk 5/10 · Moderate
- Hot days now (above 106°F)
- 7 days/yr
- Hot days in 30 yrs
- 19 days/yr
Wind risk 2/10 · Minimal
- Chance of severe wind over 30 yrs
- 4.0%
Air-quality risk 4/10 · Minor
- Unhealthy air days now
- 3 days/yr
- Unhealthy air days in 30 yrs
- 5 days/yr
Risk factors via First Street. Map © Google.
Why this score? — see what drove the C+ grade
The composite is a weighted blend of 9 inputs, each scored 0–100. Each bar is that input's sub-score; the figure is the points it added to the 100-point composite (weight × sub-score).
- Cash flow +30.0/30.0
- DSCR +10.0/10.0
- 1% rule +7.4/10.0
- Rent growth +4.2/5.0
- Schools +3.3/10.0
- Livability +3.2/5.0
- Condition / age +2.5/5.0
- ARV discount +1.8/15.0
- Appreciation +0.0/10.0
$75,000
🖨 Deal sheet 📄 Offer letter ✓ Due diligence
Listing remarks
Completely updated from top to bottom, this move-in ready 1 bed, 1 bath home offers modern finishes and peace of mind with major updates including the roof, HVAC, water heater, and more. Inside, you’ll find a functional layout with a spacious living room, large kitchen, and comfortable bedroom. New kitchen appliances are included as well. Whether you’re looking for an easy first home or an excellent rental investment opportunity, this low-maintenance property is one you won’t want to miss.
Key facts
- Updated water heater
- Modern finishes
- Updated roof
Tags
Property features AI
Finance
- Other: Located in the Wood Lawn / Woodlawn subdivision
Exterior
- Utilities: Public water; Public sewer
- Home design: Single-family residence (site-built); One-story
- Construction: Aluminum and vinyl siding
- Exterior features: Level lot; Lot dimensions approximately 25 x 130
Interior
- Kitchen: Microwave; Refrigerator; Electric range
- Bedrooms: Total of 4 rooms (bedroom count not specified)
- Bathrooms: 1 full bathroom (main level)
- Heating & cooling: Central air conditioning; Natural gas forced-air heating
- Interior features: Microwave; Refrigerator; Electric range; Crawl space basement
- Laundry & utility: Laundry on main level
Neighborhood map
What this means for you Summary
Snapshot
- This is a 1-bed/1.0-bath single-family listed at $75k.
Deal economics
- At list price, monthly cash flow is $291 ($3k/yr) — positive.
- The deal already cash-flows at list — no discount required.
- Meets the 1% rule at list price ($933 rent vs $75k).
- Recommended offer: $74k (1.5% below list) — sets the bar for market timing.
- Cap rate 11.0% vs local median 4.6% in Evansville — top-decile yield for the area; either an underpriced asset or a hidden risk that comps aren't pricing in. Stress-test before assuming the spread holds.
Location & tenants
- Location reads 63/100 on livability (#416 in IN) — a middle-class / working-renter tenant base. Strengths: cost of living A+, housing A+, health & safety A+; Watch: crime F, commute F, employment D-.
- Evansville Vanderburgh School Corporation (urban): math 36% / reading 43% proficiency, ranked #153 of 301 in IN (top 51%) — families likely to look elsewhere, expect single-tenant / working-renter base with shorter leases.
- Zoned schools: Delaware Elementary School (math 22% / reading 16%, grade F, #829 of 994 statewide, top 84%, 338 students, 90% FRL); North Junior High School (math 44% / reading 57%, grade C, #43 of 330 statewide, top 14%, 929 students, 42% FRL); North High School (math 57% / reading 74%, grade B, #29 of 369 statewide, top 8%, 1,674 students, 35% FRL).
- Market conditions: Rents rising fast (+6.7%/yr); 229 active listings in the ZIP; 18 comparable units currently listed for rent nearby; rentals at typical pace (median 21d on market — plan ~3-4 weeks tenant-placement turnaround); 508 units permitted in Vanderburgh County in 2024 (32 in 5+ unit buildings).
- This rent is only 17% of the median local income ($66k/yr) — well below the 30% rent-burden line; pricing power to push rent on renewal without tenant pushback.
Forward outlook
- Local home prices are declining (-3.0%/yr); year-one equity from $519 of loan paydown is wiped out by about $2k of value loss. Plan a longer hold.
- At projected returns (-3.0% appreciation + 6.7% rent growth), your $21k cash investment doubles in ~6 years — after that, you're playing with house money.
Negotiation context
- It's been on market 25 days — a 2% lower offer ($74k) is reasonable based on typical stale-listing flexibility.
- 4 sale attempts with the ask held roughly flat each time — persistent listings suggest the price (not the market) is what's stuck; bring a comps-based counter.
Risks & watch-outs
- Watch-outs: built in 1909 — expect roof / HVAC / electrical / plumbing capex.
- Climate carrying-cost: extreme-heat days projected 7→19/yr by 2055 (HVAC capex compounding) — expect insurance premiums to compound above CPI over the hold.
Questions for the listing agent
- Built in 1909 — when were the roof, HVAC, electrical panel, plumbing, and water heater last replaced?
- Is there a deadline driving the sale (1031 exchange, divorce, estate, relocation)? That informs how much negotiation room exists.
- Schools are D-rated, which usually means shorter tenancies and higher turnover. Who's the typical renter profile here, and what's been the actual vacancy rate?
- Crime grade is F in this area — have there been break-ins, vandalism, or insurance claims at this property in the last 3 years? What carrier currently insures it and at what premium?
- What's the average days-on-market for RENTAL listings here right now (not sales)? A rising rental-DOM trend means longer vacancies and softer asking-rent achievability than the comps imply.
- What's the recent tenant-quality profile in this submarket — average credit score on applications, eviction rate, late-payment / NSF rate, and stable-employment percentage? A property-management company in the area should have these aggregated.
- How much new for-sale + rental construction is in the pipeline within 1–3 miles? Heavy new supply typically softens prices + rents 12–24 months out; constrained supply supports both.
Investment metrics
- 1% rule
- 1.24% ✓
- Cap rate
- 10.95%
- Cash-on-cash
- 16.63%
- DSCR
- 1.74
- GRM
- 6.7
CMA / ARV
- ARV (on-the-fly)
- $66,542
- Comps found
- 12
Show comp detail 12 sales within ~0.75 mi
| Address | Dist | Beds/Ba | Sqft | Sold | Price | $/sf | Match |
|---|---|---|---|---|---|---|---|
| 707 E Missouri St | 0.38mi | 2/1.0 (+1) | 714 (+4%) | 1mo | $23,000 | $32 | 69 |
| 215 E Florida St | 0.20mi | 2/1.0 (+1) | 742 (+8%) | 12mo | $56,000 | $75 | 62 |
| 1309 N Garvin St | 0.32mi | 2/1.0 (+1) | 736 (+7%) | 8mo | $50,000 | $68 | 61 |
| 321 E Tennessee St | 0.27mi | 2/2.0 (+1) | 720 (+5%) | 12mo | $56,000 | $78 | 60 |
| 710 Reis Ave | 0.71mi | 1/1.0 | 720 (+5%) | 2mo | $70,000 | $97 | 57 |
| 15 E Tennessee St | 0.30mi | 2/1.0 (+1) | 752 (+10%) | 10mo | $93,500 | $124 | 57 |
| 802 E Delaware St | 0.49mi | 2/1.0 (+1) | 672 (-2%) | 14mo | $72,500 | $108 | 57 |
| 217 E Eichel Ave | 0.32mi | 2/1.0 (+1) | 760 (+11%) | 11mo | $102,000 | $134 | 53 |
| 717 E Iowa St | 0.43mi | 2/1.0 (+1) | 768 (+12%) | 7mo | $31,700 | $41 | 49 |
| 318 W Florida St | 0.51mi | 2/1.0 (+1) | 756 (+10%) | 6mo | $101,000 | $134 | 49 |
| 913 N Morton Ave | 0.37mi | 2/1.0 (+1) | 594 (-13%) | 10mo | $86,500 | $146 | 47 |
| 524 W Louisiana Ave | 0.66mi | 2/1.0 (+1) | 750 (+9%) | 9mo | $45,000 | $60 | 41 |
Match score weights: distance 35% · size 25% · config 20% · recency 20%. Top-matched comps best support the ARV.
Projected returns pro-forma
-3.0% appreciation · 6.72% rent growth · sell at horizon
- IRR
- 11.5%
- Equity multiple
- 1.48×
- Total profit
- $9,976
- Equity at exit
- $11,183
- IRR
- 23.1%
- Equity multiple
- 3.31×
- Total profit
- $48,479
- Equity at exit
- $6,485
Cash invested: $21,000 (down + closing). Projections, not guarantees.
Landlord ↔ Tenant lean methodology
- Overall (STATE)
- 90 Strongly Landlord-Friendly
- State Indiana
- 90 Strongly Landlord-Friendly · R+11
- County
- — inherits STATE
- City
- — inherits STATE
ZIP-level market 47711
- Home prices YoY
- -32.3%
- Rents YoY
- 6.7%
- Active inventory
- 229
- Price-to-rent
- 6.7×
Monthly cashflow live
- Estimated rent
- $933 high interval (Pro) →
- Mortgage (P&I)
- −$393
- Tax from tax record
- −$21 /mo · $255/yr
- Insurance
- −$31
- HOA
- −$0
- Vacancy / Maint / Mgmt
- −$196
- Net cashflow
- $291
Break-even live
UW: 25.0% down · 7.5% · 30yr · 1.5% tax · 5.0% vac · 8.0% maint · 8.0% mgmt
Financing live
Cash to close
- Down payment
- $18,750
- Closing costs
- $2,250
- Reserves months
- —
- Total cash needed
- —
Loan-product check · same deal, 3 products live
Conventional
25% down · 7.5% · 30yr
- Down + closing
- —
- Monthly P&I
- —
- Monthly cashflow
- —
- DSCR
- —
- Eligible?
- —
Personal DTI + credit; lowest rate.
DSCR
20% down · 8.5% · 30yr
- Down + closing
- —
- Monthly P&I
- —
- Monthly cashflow
- —
- DSCR
- —
- Eligible?
- —
No personal income docs; deal must DSCR.
Hard money
10% down · 12.0% · 12mo
- Down + closing
- —
- Monthly P&I
- —
- Monthly cashflow
- —
- DSCR
- —
- Eligible?
- —
Short-term bridge; refi at stabilization.
Rent comps 18 comps
| Address | Beds | Baths | Sqft | Rent | $/sqft | DOM | Units | Dist |
|---|---|---|---|---|---|---|---|---|
| 109 E Eichel Ave Unit A Evansville, IN | 1.0 | 1.0 | 675 | $745 | $1.10 | 21d | 1 | 0.36mi |
| 200 N Main St Evansville, IN | 2.0 | 1.0–2.0 | 857 | $1,287 | $1.50 | 13d | 7 | 0.49mi |
| 41 W Division St Unit 101 Evansville, IN | 1.0 | 1.0 | 634 | $1,100 | $1.74 | 21d | 1 | 0.65mi |
| 406 Edgar St Unit 1 Evansville, IN | 1.0 | 1.0 | 530 | $1,500 | $2.83 | 21d | 1 | 0.73mi |
| 605 W Michigan St Unit 1 Evansville, IN | 1.0 | 1.0 | 484 | $795 | $1.64 | 21d | 1 | 0.74mi |
| 500 Richardt Ave Evansville, IN | 1.0 | 1.0 | 550 | $700 | $1.27 | 21d | 1 | 0.90mi |
| 24 NW 6th St Apt 103 Evansville, IN | 1.0 | 1.0 | 706 | $1,300 | $1.84 | 21d | 1 | 1.03mi |
| 507 S Evans Ave Evansville, IN | 2.0 | 1.0 | 750 | $795 | $1.06 | 21d | 1 | 1.07mi |
| 329 Main St Evansville, IN | 1.0–2.0 | 1.0–2.0 | 717 | $1,050 | $1.46 | 13d | 1 | 1.18mi |
| 820 Negley Ave Unit B Evansville, IN | 1.0 | 1.0 | 575 | $695 | $1.21 | 21d | 1 | 1.18mi |
| 2511 N Kentucky Ave Unit 23 Evansville, IN | 1.0 | 1.0 | 584 | $650 | $1.11 | 21d | 1 | 1.30mi |
| 101 SE 2nd St Evansville, IN | 1.0 | 1.0 | 530 | $750 | $1.42 | 13d | 1 | 1.35mi |
| 1219 Joan Ave Unit 1219 Evansville, IN | 2.0 | 1.0 | 725 | $845 | $1.17 | 13d | 1 | 1.35mi |
| 1440 E Division St Evansville, IN | 2.0 | 1.0 | 689 | $1,250 | $1.81 | 13d | 1 | 1.37mi |
| 100 SE 1st St Evansville, IN | 1.0–2.0 | 1.0–2.0 | 715 | $1,120 | $1.57 | 13d | 17 | 1.38mi |
| 202 SE 1st St Evansville, IN | 1.0–2.0 | 1.0 | 926 | $1,439 | $1.55 | 21d | 4 | 1.40mi |
| 1111 Stanley Ave Evansville, IN | 2.0 | 1.0 | 670 | $1,000 | $1.49 | 21d | 1 | 1.44mi |
| 1680 E Franklin St #1682 Evansville, IN | 2.0 | 1.0 | 675 | $855 | $1.27 | 21d | 7 | 1.45mi |
Listing history 20 events
-
2026-06-18days on market $75,000 Active 25 DOM
-
2026-06-17days on market $75,000 Active 24 DOM
-
2026-06-16days on market $75,000 Active 23 DOM
-
2026-06-15days on market $75,000 Active 22 DOM
-
2026-06-14days on market $75,000 Active 20 DOM
-
2026-06-13days on market $75,000 Active 19 DOM
-
2026-06-10days on market $75,000 Active 17 DOM
-
2026-06-09days on market $75,000 Active 16 DOM
-
2026-06-08days on market $75,000 Active 15 DOM
-
2026-06-07days on market $75,000 Active 14 DOM
-
2026-06-02days on market $75,000 Active 9 DOM
-
2026-06-01days on market $75,000 Active 8 DOM
-
2026-05-31days on market $75,000 Active 7 DOM
-
2026-05-30days on market $75,000 Active 6 DOM
-
2026-05-25$75,000 Active
-
2026-04-29$950
-
2026-04-28historical $950
-
2026-04-18$950
-
2026-03-09price $85,000
-
2026-02-07$95,000 Active
ⓘ Source: listings_history table (triggers on properties + properties_extension) + one-shot
backfill from property_details.listing_events for pre-trigger history.
Tax reassessment forecast IN · Partial reset (capped growth)
- Current annual tax
- $255 · $21/mo
- Projected year-2 tax
- $446 · $37/mo
- Expected delta
- +$191/yr (+$16/mo · 75.2%)
ⓘ Screening estimate from a state-policy table — verify with the county assessor before closing.
Climate risk First Street
- Flood 1/10 Low FEMA zone X (unshaded) · 0% chance over 30 yrs
- Wildfire 1/10 Low
- Heat 5/10 Major 7 d/yr ≥106°F today · 19 d/yr by 30 yrs out
- Wind 2/10 Low 4% chance of damaging wind over 30 yrs
- Air quality 4/10 Moderate 3 unhealthy d/yr today · 5 by 30 yrs out
Nearby sold comps map
Loading sold comps map…
Walkable amenities ~0.75 mi
Loading nearby amenities…
Taxation est. · year 1
- Rental income
- $11,193
- − Mortgage interest
- −$4,201
- − Property taxes
- −$255
- − Insurance
- −$375
- − Repairs & maintenance
- −$895
- − Management
- −$895
- − Depreciation
- −$2,182
- Taxable income
- $2,389
- Est. tax owed @ 24.0%
- −$573
- After-tax cash flow
- $2,919/yr
For passive investors: Depreciation is non-cash, so a rental often shows a tax loss while cash-flowing — sheltering income. Rental losses are passive: they offset passive income freely, and up to $25,000/yr can offset ordinary (W-2) income if you actively participate and your MAGI is under $100k (phasing out to $0 by $150k); unused losses carry forward. On sale, claimed depreciation is recaptured at up to 25%, and gains may owe capital-gains tax (a 1031 exchange can defer both). Figures are a year-1 estimate at your 24.0% rate — not tax advice; consult a CPA.
Schools (NCES district)
- District
- Evansville Vanderburgh School Corporation
- NCES district ID
- 1803450
- Math proficiency
- 36% ▼ -7.00%
- Reading proficiency
- 43% ▼ -3.00%
- Median HH income
- $43,270
- Composite
- 33.41/100
- National rank
- #5471
- State rank
- #153 of 301 in IN
Livability — Evansville
- Score
- 63/100
- State rank
- #416
- US rank
- #15047
Category grades
Schools grade is shown separately in the Schools card above.
Census & demographics
- Census place
- Evansville, IN
- County
- Vanderburgh County · 146,793 people
- City population
- 146,793
- Metro
- Evansville, IN-KY
- Population (ZIP)
- 30,944
- Household income
- $66,320
- Rent vs Own
- Severe rent burden
- 659.0
Population outlook (Vanderburgh County) Hauer SSP2
- Today (2025)
- 187,038 people
- By 2030
- 188,907 · +1.0%
- By 2040
- 190,272 · +1.7%
- By 2050
- 188,871 · +1.0%
- By 2075
- 180,751 · -3.4%
- By 2100
- 163,015 · -12.8%
Race, ethnicity, and origin ACS 2023
- Neighborhood character
- Predominantly White (85%)
- Race & ethnicity
- White 85% Black 8% Two or more races 5% Hispanic / Latino 2%
- Common ancestry
- Lithuanian 2% Romanian 2% Slovak 1%
- Foreign-born
- 2% · Canada
- Languages at home
- 97% English-only · Spanish 2%
Political lean MEDSL · Vanderburgh
- 2024 margin
- R (+12.7) · D 43.0% · R 55.6% · Other 1.4%
- 2008→2024 swing
- -15.1pp toward R · 2008: 2.5pp · 2024: -12.7pp
- All cycles
- 2024: R+12.7 2020: R+9.6 2016: R+16.9 2012: R+10.8 2008: D+2.5
Not yet ingested
- Civics
- —
Market trends
- HPI YoY
- ▼ -97.98%
- Current HPI
- 205.62
- Rent YoY
- ▲ 6.72%
- Metro
- Evansville, IN-KY
- State GDP YoY
- ▲ 2.90%
- F500 in state
- 18
Industry mix (Fortune 500 HQ in IN)
| Industry | F500 HQs | Revenue |
|---|---|---|
| Industrial Machinery | 2 | $37B |
|
||
| Healthcare | 1 | $177B |
|
||
| Pharmaceuticals | 1 | $45B |
|
||
| Metals / Steel | 1 | $18B |
|
||
| Agriculture | 1 | $17B |
|
||
| Packaging | 1 | $12B |
|
||
Price history
-21.1% since first listed6 events — show timeline
- 2026-05-25 Listed $75,000 IRMLS
- 2026-04-29 Listed for Rent $950 TURBOTENANT
- 2026-04-28 Rental Removed $950 TURBOTENANT
- 2026-04-18 Listed for Rent $950 TURBOTENANT
- 2026-03-09 Price Changed $85,000 IRMLS
- 2026-02-07 Listed $95,000 IRMLS
Property tax history
-4.2%/yrLatest (2024): $255 · +1.1% YoY. Source: county tax records.
Cash-flow waterfall
monthlySold comps — $/sqft
last 12 mo · ≤1 miLoading sold comps…