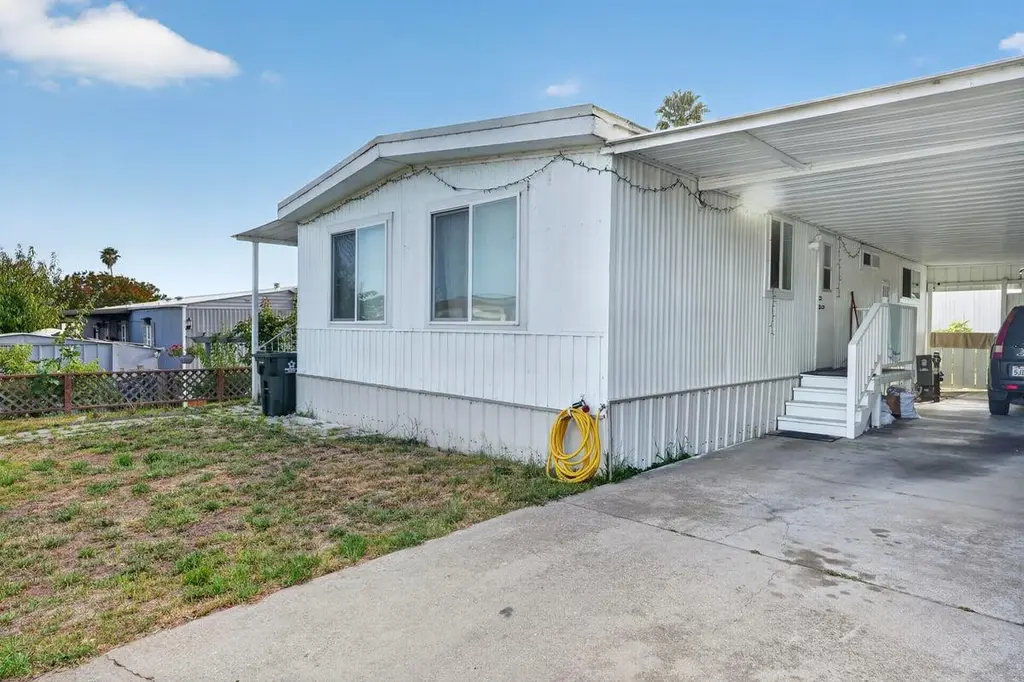
255 E Bolivar #39 · Salinas, CA
Flood risk 1/10 · Minimal
- FEMA flood zone
- X (shaded)
- Chance of flooding over 30 yrs
- 0.0%
- Est. flood insurance / yr
- $507 – $1,088
Fire risk 2/10 · Minimal
- Est. fire insurance / yr
- $659 – $1,223
Heat risk 3/10 · Minor
- Hot days now (above 81°F)
- 5 days/yr
- Hot days in 30 yrs
- 11 days/yr
Wind risk 1/10 · Minimal
- Chance of severe wind over 30 yrs
- —
Air-quality risk 7/10 · Major
- Unhealthy air days now
- 11 days/yr
- Unhealthy air days in 30 yrs
- 11 days/yr
Risk factors via First Street. Map © Google.
Why this score? — see what drove the B- grade
The composite is a weighted blend of 9 inputs, each scored 0–100. Each bar is that input's sub-score; the figure is the points it added to the 100-point composite (weight × sub-score).
- Cash flow +30.0/30.0
- DSCR +10.0/10.0
- 1% rule +8.9/10.0
- ARV discount +7.5/15.0
- Rent growth +3.7/5.0
- Livability +3.2/5.0
- Schools +3.0/10.0
- Condition / age +2.2/5.0
- Appreciation +0.0/10.0
$220,000
🖨 Deal sheet 📄 Offer letter ✓ Due diligence
Listing remarks MLS
3-bedroom, 2-bathroom home offering approximately 1,000 square feet of living space. The layout features a combined kitchen and family room, creating a versatile area for daily living. Residence provides essential amenities and a practical floor plan. For added convenience, a dedicated laundry area with washer and dryer hookups is included, simplifying daily chores. Conveniently situated in North Salinas, Lamplighter Park is close to shopping, restaurants, schools, and major commuter routes. Whether you are just starting out, or looking for an affordable home in a friendly community, this is a fantastic opportunity!
Key facts
- Built 1973
- Listed 20 days
Property features AI
Finance
- Other: Park directions available (inside park, area on Lynwood and Greenway Dr — look for #39)
- HOA & community: Community amenities include billiard room, clubhouse, community pool, outdoor game court, and recreation room; HOA rental restrictions
Exterior
- Parking: Carport with space for 2; Assigned space #39; Monthly space rent $1,285
- Utilities: Septic system connected; Public utilities; Water: other (see remarks)
- Home design: Single-story property
- Construction: Living area listed as 1,000
- Exterior features: Other roof (see remarks); Leased land (park home site)
Interior
- Kitchen: Open kitchen integrated with family room
- Bedrooms: 3 bedrooms
- Bathrooms: 2 full bathrooms
- Heating & cooling: Central forced air heating; Ceiling fan(s)
- Interior features: Kitchen and family room combined; Laundry hookups only; Ceiling fan(s); Central forced air heating
- Laundry & utility: Laundry hookups only
Neighborhood map
What this means for you Summary
Snapshot
- This is a 3-bed/1.0-bath manufactured listed at $220k. Condition is rated fair.
Deal economics
- At list price, monthly cash flow is $893 ($11k/yr) — positive.
- The deal already cash-flows at list — no discount required.
- Meets the 1% rule at list price ($3k rent vs $220k).
- Recommended offer: $217k (1.5% below list) — sets the bar for market timing.
- Cap rate 11.2% vs local median 2.7% in Salinas — top-decile yield for the area; either an underpriced asset or a hidden risk that comps aren't pricing in. Stress-test before assuming the spread holds.
Location & tenants
- Location reads 63/100 on livability (#465 in CA) — a middle-class / working-renter tenant base. Strengths: commute A+, health & safety A+, employment B+; Watch: schools F, crime D-, amenities F.
- Salinas Union High (urban): math 23% / reading 39% proficiency, ranked #998 of 1,400 in CA (top 71%) — families likely to look elsewhere, expect single-tenant / working-renter base with shorter leases; 66% free/reduced lunch — lower-income household profile, screen leases tightly.
- Market conditions: Rents rising fast (+4.9%/yr); 45 active listings in the ZIP; 9 comparable units currently listed for rent nearby; rentals leasing fast (median 14d on market — plan ~1-2 weeks tenant-placement turnaround); solid renter incomes; 530 units permitted in Monterey County in 2024 (50 in 5+ unit buildings).
- This rent runs 38% of the median local income ($98k/yr) — at the standard rent-burdened threshold; future hikes will face affordability resistance.
Forward outlook
- Local home prices are declining (-3.0%/yr); year-one equity from $2k of loan paydown is wiped out by about $7k of value loss. Plan a longer hold.
- Monterey County population projected at +10% by 2050 — modest demand growth; plan on rents tracking national, not racing it.
- At projected returns (-3.0% appreciation + 4.9% rent growth), your $62k cash investment doubles in ~7 years — after that, you're playing with house money.
Negotiation context
- It's been on market 20 days — a 2% lower offer ($217k) is reasonable based on typical stale-listing flexibility.
- 2 sale attempts with the ask held roughly flat each time — persistent listings suggest the price (not the market) is what's stuck; bring a comps-based counter.
Questions for the listing agent
- Have any recent inspections been done? Can we get a copy of the seller's disclosures and any deferred-maintenance estimates?
- Built in 1973 — when were the roof, HVAC, electrical panel, plumbing, and water heater last replaced?
- Is there a deadline driving the sale (1031 exchange, divorce, estate, relocation)? That informs how much negotiation room exists.
- Schools are F-rated, which usually means shorter tenancies and higher turnover. Who's the typical renter profile here, and what's been the actual vacancy rate?
- Crime grade is D in this area — have there been break-ins, vandalism, or insurance claims at this property in the last 3 years? What carrier currently insures it and at what premium?
- What's the average days-on-market for RENTAL listings here right now (not sales)? A rising rental-DOM trend means longer vacancies and softer asking-rent achievability than the comps imply.
- What's the recent tenant-quality profile in this submarket — average credit score on applications, eviction rate, late-payment / NSF rate, and stable-employment percentage? A property-management company in the area should have these aggregated.
- How much new for-sale + rental construction is in the pipeline within 1–3 miles? Heavy new supply typically softens prices + rents 12–24 months out; constrained supply supports both.
Investment metrics
- 1% rule
- 1.39% ✓
- Cap rate
- 11.17%
- Cash-on-cash
- 17.40%
- DSCR
- 1.77
- GRM
- 6.0
CMA / ARV
- ARV (on-the-fly)
- $127,000
- Comps found
- 7
Show comp detail 7 sales within ~0.75 mi
| Address | Dist | Beds/Ba | Sqft | Sold | Price | $/sf | Match |
|---|---|---|---|---|---|---|---|
| 55 SAN JUAN GRADE Rd #18 | 0.55mi | 2/2.0 (-1) | 1,020 (+2%) | 2mo | $130,000 | $127 | 60 |
| 255 E Bolivar St #224 | 0.14mi | 2/2.0 (-1) | 1,080 (+8%) | 23mo | $175,000 | $162 | 52 |
| 55 SAN JUAN GRADE Rd #82 | 0.56mi | 2/2.0 (-1) | 960 (-4%) | 15mo | $150,000 | $156 | 46 |
| 55 San Juan Grade #25 | 0.55mi | 2/2.0 (-1) | 960 (-4%) | 16mo | $42,000 | $44 | 45 |
| 55 San Juan Grade #44 | 0.55mi | 2/2.0 (-1) | 960 (-4%) | 17mo | $138,000 | $144 | 45 |
| 55 San Juan Grade Rd #17 | 0.56mi | 2/2.0 (-1) | 900 (-10%) | 6mo | $80,000 | $89 | 44 |
| 55 San Juan Grade Rd #94 | 0.55mi | 2/2.0 (-1) | 1,144 (+14%) | 17mo | $125,000 | $109 | 27 |
Match score weights: distance 35% · size 25% · config 20% · recency 20%. Top-matched comps best support the ARV.
Projected returns pro-forma
-3.0% appreciation · 4.87% rent growth · sell at horizon
- IRR
- 10.9%
- Equity multiple
- 1.44×
- Total profit
- $27,145
- Equity at exit
- $32,803
- IRR
- 21.4%
- Equity multiple
- 2.98×
- Total profit
- $122,047
- Equity at exit
- $19,022
Cash invested: $61,600 (down + closing). Projections, not guarantees.
Landlord ↔ Tenant lean methodology
- Overall (STATE)
- 18 Strongly Tenant-Friendly
- State California
- 18 Strongly Tenant-Friendly · D+13
- County
- — inherits STATE
- City
- — inherits STATE
ZIP-level market 93906
- Rents YoY
- 4.9%
- Active inventory
- 45
- Price-to-rent
- 6.0×
Monthly cashflow live
- Estimated rent
- $3,055 high interval (Pro) →
- Mortgage (P&I)
- −$1,154
- Tax est. 1.5%
- −$275 /mo · $3,300/yr
- Insurance
- −$92
- HOA
- −$0
- Vacancy / Maint / Mgmt
- −$642
- Net cashflow
- $893
Break-even live
UW: 25.0% down · 7.5% · 30yr · 1.5% tax · 5.0% vac · 8.0% maint · 8.0% mgmt
Financing live
Cash to close
- Down payment
- $55,000
- Closing costs
- $6,600
- Reserves months
- —
- Total cash needed
- —
Loan-product check · same deal, 3 products live
Conventional
25% down · 7.5% · 30yr
- Down + closing
- —
- Monthly P&I
- —
- Monthly cashflow
- —
- DSCR
- —
- Eligible?
- —
Personal DTI + credit; lowest rate.
DSCR
20% down · 8.5% · 30yr
- Down + closing
- —
- Monthly P&I
- —
- Monthly cashflow
- —
- DSCR
- —
- Eligible?
- —
No personal income docs; deal must DSCR.
Hard money
10% down · 12.0% · 12mo
- Down + closing
- —
- Monthly P&I
- —
- Monthly cashflow
- —
- DSCR
- —
- Eligible?
- —
Short-term bridge; refi at stabilization.
Rent comps 9 comps
| Address | Beds | Baths | Sqft | Rent | $/sqft | DOM | Units | Dist |
|---|---|---|---|---|---|---|---|---|
| 2290 N Main St Salinas, CA | 1.0–3.0 | 1.0–2.0 | 985 | $3,611 | $3.67 | 1d | 13 | 0.25mi |
| 2198 Brutus St Salinas, CA | 1.0–2.0 | 1.0–1.5 | 893 | $2,645 | $2.96 | 7d | 2 | 0.31mi |
| 2402 N Main St Salinas, CA | 2.0 | 1.0 | 900 | $2,500 | $2.78 | 13d | 1 | 0.32mi |
| 93 Castro St Salinas, CA | 2.0 | 1.0–2.0 | 828 | $2,400 | $2.90 | 12d | 3 | 0.44mi |
| 18854 Eisenhower St Unit 18854p Salinas, CA | 2.0 | 1.0 | 1000 | $2,700 | $2.70 | 13d | 1 | 0.52mi |
| 306 England Ave Salinas, CA | 3.0 | 2.0 | 1104 | $3,500 | $3.17 | 13d | 1 | 0.74mi |
| 985 Rogge Rd Salinas, CA | 3.0 | 2.5 | 1378 | $3,850 | $2.79 | 13d | 1 | 1.05mi |
| 1823 Cherokee Dr Salinas, CA | 3.0 | 1.5 | 952 | $3,295 | $3.46 | 13d | 1 | 1.09mi |
| 196 E Alvin Dr Salinas, CA | 1.0–2.0 | 1.0 | 735 | $2,650 | $3.61 | 12d | 2 | 1.39mi |
Listing history 16 events
-
2026-06-18days on market $220,000 Active 20 DOM
-
2026-06-17days on market $220,000 Active 19 DOM
-
2026-06-16days on market $220,000 Active 18 DOM
-
2026-06-15days on market $220,000 Active 17 DOM
-
2026-06-14days on market $220,000 Active 15 DOM
-
2026-06-13days on market $220,000 Active 14 DOM
-
2026-06-10days on market $220,000 Active 12 DOM
-
2026-06-09days on market $220,000 Active 11 DOM
-
2026-06-08days on market $220,000 Active 10 DOM
-
2026-06-07days on market $220,000 Active 9 DOM
-
2026-06-03days on market $220,000 Active 5 DOM
-
2026-06-02days on market $220,000 Active 4 DOM
-
2026-06-01days on market $220,000 Active 3 DOM
-
2026-05-31days on market $220,000 Active 2 DOM
-
2026-05-30remarks 623-char remark
-
2026-05-30$220,000 Active 1 DOM
ⓘ Source: listings_history table (triggers on properties + properties_extension) + one-shot
backfill from property_details.listing_events for pre-trigger history.
Climate risk First Street
- Flood 1/10 Low FEMA zone X (shaded) · 0% chance over 30 yrs
- Wildfire 2/10 Low
- Heat 3/10 Moderate 5 d/yr ≥81°F today · 11 d/yr by 30 yrs out
- Wind 1/10 Low
- Air quality 7/10 Severe 11 unhealthy d/yr today · 11 by 30 yrs out
Nearby sold comps map
Loading sold comps map…
Walkable amenities ~0.75 mi
Loading nearby amenities…
Taxation est. · year 1
- Rental income
- $36,663
- − Mortgage interest
- −$12,323
- − Property taxes
- −$3,300
- − Insurance
- −$1,100
- − Repairs & maintenance
- −$2,933
- − Management
- −$2,933
- − Depreciation
- −$6,400
- Taxable income
- $7,673
- Est. tax owed @ 24.0%
- −$1,842
- After-tax cash flow
- $8,878/yr
For passive investors: Depreciation is non-cash, so a rental often shows a tax loss while cash-flowing — sheltering income. Rental losses are passive: they offset passive income freely, and up to $25,000/yr can offset ordinary (W-2) income if you actively participate and your MAGI is under $100k (phasing out to $0 by $150k); unused losses carry forward. On sale, claimed depreciation is recaptured at up to 25%, and gains may owe capital-gains tax (a 1031 exchange can defer both). Figures are a year-1 estimate at your 24.0% rate — not tax advice; consult a CPA.
Condition & rehab AI · 12 photos
This 3-bedroom, 2-bathroom home requires moderate renovations to update the kitchen and bathrooms, and improve the exterior and landscaping. These updates would significantly increase its value for both resale and rental purposes.
Repairs flagged
- Moderate kitchen cabinets — dated and in need of replacement
- Moderate bathroom fixtures — dated and in need of replacement
- Minor exterior siding — slight weathering
- Minor landscaping — bare yard with minimal landscaping
Value-add opportunities
- Both update kitchen cabinets and countertops — modernizing the kitchen would increase both resale and rental value
- Both replace bathroom fixtures — modernizing the bathrooms would increase both resale and rental value
- Both landscape the yard — improved curb appeal would increase both resale and rental value
Renovation cost estimate screening
| Repair item | Severity | Est. cost |
|---|---|---|
| kitchen cabinets · dated and in need of replacement | Moderate | $3,000–15,000 |
| bathroom fixtures · dated and in need of replacement | Moderate | $3,000–15,000 |
| exterior siding · slight weathering | Minor | $500–3,000 |
| landscaping · bare yard with minimal landscaping | Minor | $500–3,000 |
| Total estimated repair cost · 4 items | $7,000–36,000 |
Value-add ROI direction
- Both update kitchen cabinets and countertops — modernizing the kitchen would increase both resale and rental value ↑
- Both replace bathroom fixtures — modernizing the bathrooms would increase both resale and rental value ↑
- Both landscape the yard — improved curb appeal would increase both resale and rental value ↑
ⓘ Cost ranges are severity-bucket heuristics (US national rule-of-thumb). Get contractor quotes + a written scope before underwriting a rehab budget.
Schools (NCES district)
- District
- Salinas Union High
- NCES district ID
- 0633980
- Math proficiency
- 23% ▲ 2.00%
- Reading proficiency
- 39% ▲ 1.00%
- Median HH income
- $50,670
- Composite
- 29.86/100
- National rank
- #11691
- State rank
- #998 of 1400 in CA
Livability — Salinas
- Score
- 63/100
- State rank
- #465
- US rank
- #15876
Category grades
Schools grade is shown separately in the Schools card above.
Census & demographics
- Census place
- Salinas, CA
- County
- Monterey County · 241,191 people
- City population
- 119,069
- Metro
- Salinas, CA
- Population (ZIP)
- 64,199
- Household income
- $97,555
- Rent vs Own
- Severe rent burden
- 1736.0
Population outlook (Monterey County) Hauer SSP2
- Today (2025)
- 458,436 people
- By 2030
- 469,418 · +2.4%
- By 2040
- 489,615 · +6.8%
- By 2050
- 506,696 · +10.5%
- By 2075
- 531,048 · +15.8%
- By 2100
- 519,153 · +13.2%
Race, ethnicity, and origin ACS 2023
- Neighborhood character
- Predominantly Hispanic (76%)
- Race & ethnicity
- Hispanic / Latino 76% Two or more races 13% White 13% Asian 7% Black 2%
- Hispanic origin (detail)
- Mexican 70% Salvadoran 1%
- Common ancestry
- Russian 1% Italian 1% Romanian 1%
- Foreign-born
- 33% · Canada, China
- Languages at home
- 33% English-only · Spanish 60% Tagalog/Filipino 2% Chinese 1%
Political lean MEDSL · Monterey
- 2024 margin
- Strong D (+29.9) · D 63.4% · R 33.5% · Other 3.0%
- 2008→2024 swing
- -8.4pp toward R · 2008: 38.3pp · 2024: 29.9pp
- All cycles
- 2024: D+29.9 2020: D+41.3 2016: D+39.7 2012: D+33.9 2008: D+38.3
Not yet ingested
- Civics
- —
Market trends
- HPI YoY
- ▼ -690.60%
- Current HPI
- 262.5003
- Rent YoY
- ▲ 4.87%
- Metro
- Salinas, CA
- State GDP YoY
- ▲ 3.21%
- F500 in state
- 116
Industry mix (Fortune 500 HQ in CA)
| Industry | F500 HQs | Revenue |
|---|---|---|
| Technology | 27 | $1,492B |
|
||
| Financial Services | 3 | $174B |
|
||
| Retail | 3 | $44B |
|
||
| Insurance | 3 | $26B |
|
||
| Media / Entertainment | 2 | $115B |
|
||
| Pharmaceuticals / Biotech | 2 | $62B |
|
||
Price history
+0.0% since first listed2 events — show timeline
- 2026-05-29 Listed $220,000 MLSListings
- 2026-05-29 Listed $220,000 bridgeMLS, Bay East AOR, or Contra Costa AOR
Cash-flow waterfall
monthlySold comps — $/sqft
last 12 mo · ≤1 miLoading sold comps…