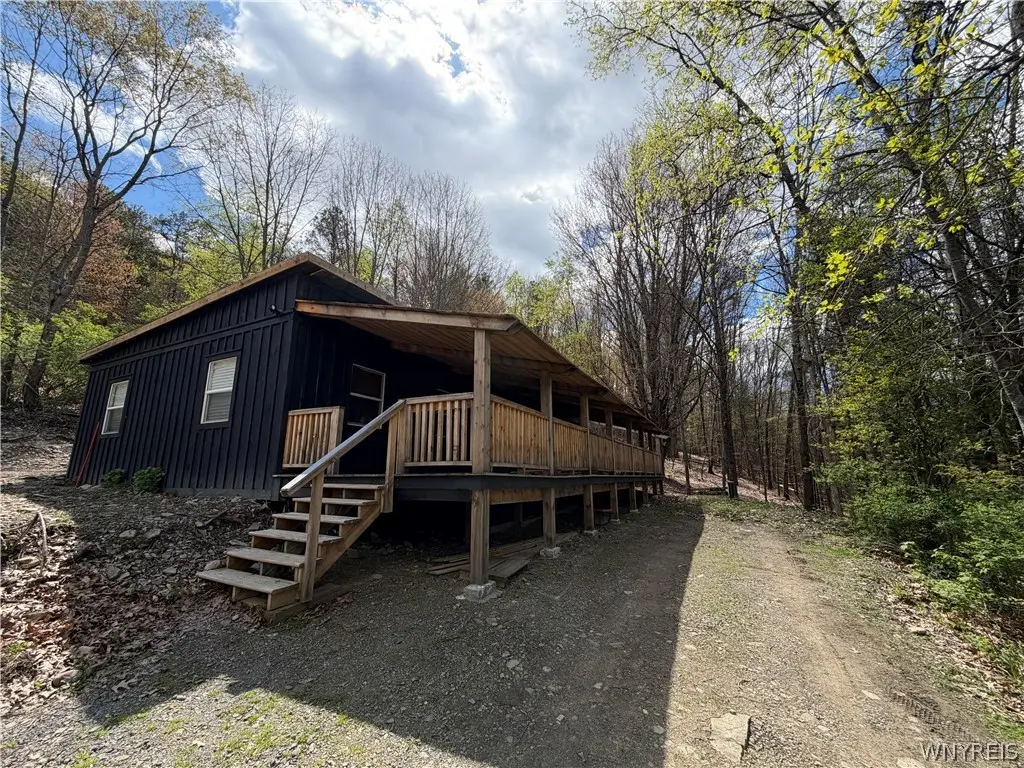
1620 River Rd · Gang Mills, NY
Flood risk 1/10 · Minimal
- FEMA flood zone
- —
- Chance of flooding over 30 yrs
- 0.0%
- Est. flood insurance / yr
- —
Fire risk 4/10 · Minor
- Est. fire insurance / yr
- $691 – $1,283
Heat risk 3/10 · Minor
- Hot days now (above 93°F)
- 7 days/yr
- Hot days in 30 yrs
- 16 days/yr
Wind risk 1/10 · Minimal
- Chance of severe wind over 30 yrs
- 0.0%
Air-quality risk 1/10 · Minimal
- Unhealthy air days now
- 0 days/yr
- Unhealthy air days in 30 yrs
- 0 days/yr
Risk factors via First Street. Map © Google.
Why this score? — see what drove the D- grade
The composite is a weighted blend of 9 inputs, each scored 0–100. Each bar is that input's sub-score; the figure is the points it added to the 100-point composite (weight × sub-score).
- Appreciation +7.7/10.0
- ARV discount +7.5/15.0
- Cash flow +6.6/30.0
- Schools +4.2/10.0
- Livability +3.4/5.0
- Rent growth +2.5/5.0
- Condition / age +2.5/5.0
- 1% rule +1.7/10.0
- DSCR +0.9/10.0
$178,000
🖨 Deal sheet (PDF) 📄 Offer letter ✓ Due diligence
Listing remarks
Located in Lindley, this 3-bedroom, 2-bath home offers ~1,400 sq ft of brand-new construction. A rare opportunity to finalize a modern retreat, the property features fully operational utilities, including well and septic systems. Designed for efficiency with freeze-protected plumbing, the functional layout provides a perfect canvas for your personal style.
Key facts
- 11 acre lot
- Built 2022
- Listed 43 days
Property features AI
Finance
- Financial info: Assessed value listed; Annual tax amount listed
Exterior
- Utilities: Electricity available; Well water; Septic tank
- Home design: Single-story home; Residential multi-use zoning
- Exterior features: Wooded property; Irregular, residential lot; Right-of-way road frontage; See remarks for additional exterior details
Interior
- Bedrooms: 3 bedrooms on the main level
- Bathrooms: 2 full bathrooms on the main level
- Interior features: Single-story layout
Neighborhood map
What this means for you Summary
Snapshot
- This is a 3-bed/2.0-bath manufactured listed at $178k.
Deal economics
- At list price, monthly cash flow is $-293 ($-4k/yr) — negative.
- To cash-flow at today's rent, offer at most $126k (29.1% below list).
- To meet the 1% rule (rent ≥ 1% of price), the offer needs to be $120k (32.8% below list).
- Recommended offer: $120k (32.8% below list) — sets the bar for 1% rule.
Location & tenants
- Location reads 68/100 on livability (#532 in NY) — a middle-class / working-renter tenant base. Strengths: employment A+, housing A+, crime B+; Watch: cost of living C-, health & safety D, amenities F.
- Corning City School District (town): math 44% / reading 53% proficiency, ranked #406 of 590 in NY (top 69%) — families likely to look elsewhere, expect single-tenant / working-renter base with shorter leases.
- Zoned schools: Erwin Valley Elementary School (math 49% / reading 55%, grade C-, #988 of 2,108 statewide, top 49%, 373 students, 33% FRL); Corning-Painted Post Middle School (math 22% / reading 48%, grade F, #480 of 729 statewide, top 66%, 962 students, 46% FRL); Corning-Painted Post High School (math 93% / reading 98%, grade A+, #82 of 1,100 statewide, top 7%, 1,463 students, 36% FRL).
- Zoned-school proficiency averages 61% at this address vs 48% district-wide (+12 pts) — the actual schools serving this property are materially stronger than the Corning City School District average implies; a family-tenant draw the district grade alone would hide.
- Market conditions: 10 active listings in the ZIP; 196 units permitted in Steuben County in 2024 (0 in 5+ unit buildings).
Forward outlook
- In year one you build about $11k of equity ($1k loan paydown + $10k appreciation (5.4% local appreciation)).
- Steuben County population projected at -20% by 2050 — secular population decline; favor cash flow + early exit over multi-decade hold.
- By year 4, paydown + projected appreciation supports a ~$37k cash-out refi (75% LTV) — recoverable capital for the next deal without selling this one.
Negotiation context
- It's been on market 44 days — a 3% lower offer ($173k) is reasonable based on typical stale-listing flexibility.
- Current owner paid $47k; list at $178k implies a 279% gain — meaningful room to come down on a strong offer.
Questions for the listing agent
- What do current leases actually rent for vs. the listed asking? Can we see a recent rent roll and the last 12 months of T-12 income?
- It's been on market 44 days. Have you received any prior offers? Is the seller open to a 33% concession, seller financing, or rate buy-down credit?
- Is there a deadline driving the sale (1031 exchange, divorce, estate, relocation)? That informs how much negotiation room exists.
- Schools are D-rated, which usually means shorter tenancies and higher turnover. Who's the typical renter profile here, and what's been the actual vacancy rate?
- The area grade is low — what's the realistic commute time and amenity access for the typical tenant pool here? Any planned neighborhood developments (good or bad) we should know about?
- What's the average days-on-market for RENTAL listings here right now (not sales)? A rising rental-DOM trend means longer vacancies and softer asking-rent achievability than the comps imply.
- What's the recent tenant-quality profile in this submarket — average credit score on applications, eviction rate, late-payment / NSF rate, and stable-employment percentage? A property-management company in the area should have these aggregated.
- How much new for-sale + rental construction is in the pipeline within 1–3 miles? Heavy new supply typically softens prices + rents 12–24 months out; constrained supply supports both.
Investment metrics
- 1% rule
- 0.67% ✗
- Cap rate
- 4.32%
- Cash-on-cash
- -7.06%
- DSCR
- 0.69
- GRM
- 12.4
CMA / ARV
No comps found within radius.
Projected returns pro-forma
5.43% appreciation · 3.0% rent growth · sell at horizon
- IRR
- 8.1%
- Equity multiple
- 1.54×
- Total profit
- $26,726
- Equity at exit
- $105,503
- IRR
- 9.9%
- Equity multiple
- 2.91×
- Total profit
- $95,086
- Equity at exit
- $186,035
Cash invested: $49,840 (down + closing). Projections, not guarantees.
Landlord ↔ Tenant lean methodology
- Overall (STATE)
- 15 Strongly Tenant-Friendly
- State New York
- 15 Strongly Tenant-Friendly · D+10
- County
- — inherits STATE
- City
- — inherits STATE
ZIP-level market 14858
- Home prices YoY
- 2.1%
- Active inventory
- 10
- Price-to-rent
- 12.4×
Monthly cashflow live
- Estimated rent
- $1,196 medium interval (Pro) →
- Mortgage (P&I)
- −$933
- Tax from tax record
- −$230 /mo · $2,763/yr
- Insurance
- −$74
- HOA
- −$0
- Vacancy / Maint / Mgmt
- −$251
- Net cashflow
- $-293
Break-even live
Sensitivity live
| Price | -10% $-193 | -5% $-243 | +0% $-293 | +5% $-344 | +10% $-394 |
|---|---|---|---|---|---|
| Rent | -10% $-388 | -5% $-340 | +0% $-293 | +5% $-246 | +10% $-199 |
| Rate | -1.0pp $-204 | -0.5pp $-248 | base $-293 | +0.5pp $-339 | +1.0pp $-386 |
UW: 25.0% down · 7.5% · 30yr · 1.5% tax · 5.0% vac · 8.0% maint · 8.0% mgmt
Financing live
Cash to close
- Down payment
- $44,500
- Closing costs
- $5,340
- Reserves months
- —
- Total cash needed
- —
Loan-product check · same deal, 3 products live
Conventional
25% down · 7.5% · 30yr
- Down + closing
- —
- Monthly P&I
- —
- Monthly cashflow
- —
- DSCR
- —
- Eligible?
- —
Personal DTI + credit; lowest rate.
DSCR
20% down · 8.5% · 30yr
- Down + closing
- —
- Monthly P&I
- —
- Monthly cashflow
- —
- DSCR
- —
- Eligible?
- —
No personal income docs; deal must DSCR.
Hard money
10% down · 12.0% · 12mo
- Down + closing
- —
- Monthly P&I
- —
- Monthly cashflow
- —
- DSCR
- —
- Eligible?
- —
Short-term bridge; refi at stabilization.
Listing history 21 events
-
2026-06-19days on market $178,000 Active 44 DOM
-
2026-06-18days on market $178,000 Active 43 DOM
-
2026-06-17days on market $178,000 Active 42 DOM
-
2026-06-16days on market $178,000 Active 41 DOM
-
2026-06-15days on market $178,000 Active 40 DOM
-
2026-06-14days on market $178,000 Active 38 DOM
-
2026-06-12days on market $178,000 Active 37 DOM
-
2026-06-09days on market $178,000 Active 34 DOM
-
2026-06-09price $178,000 Active 33 DOM
-
2026-06-08days on market $188,000 Active 33 DOM
-
2026-06-07days on market $188,000 Active 32 DOM
-
2026-06-05days on market $188,000 Active 29 DOM
-
2026-06-03days on market $188,000 Active 28 DOM
-
2026-06-02days on market $188,000 Active 27 DOM
-
2026-06-01days on market $188,000 Active 26 DOM
-
2026-05-31days on market $188,000 Active 25 DOM
-
2026-05-30days on market $188,000 Active 24 DOM
-
2026-05-20price $188,000 361-char remark
-
2026-05-06$199,900 Active 361-char remark
-
2018-01-18soldstatus $47,000
-
2017-05-24soldstatus $44,000
ⓘ Source: listings_history table (triggers on properties + properties_extension) + one-shot
backfill from property_details.listing_events for pre-trigger history.
Tax reassessment forecast NY · Partial reset (capped growth)
- Current annual tax
- $2,763 · $230/mo
- Projected year-2 tax
- $2,885 · $240/mo
- Expected delta
- +$123/yr (+$10/mo · 4.4%)
ⓘ Screening estimate from a state-policy table — verify with the county assessor before closing.
Climate risk First Street
- Flood 1/10 Low 0% chance over 30 yrs
- Wildfire 4/10 Moderate
- Heat 3/10 Moderate 7 d/yr ≥93°F today · 16 d/yr by 30 yrs out
- Wind 1/10 Low 0% chance of damaging wind over 30 yrs
- Air quality 1/10 Low 0 unhealthy d/yr today · 0 by 30 yrs out
Nearby sold comps map
Loading sold comps map…
Walkable amenities ~0.75 mi
Loading nearby amenities…
Taxation est. · year 1
- Rental income
- $14,348
- − Mortgage interest
- −$9,971
- − Property taxes
- −$2,763
- − Insurance
- −$890
- − Repairs & maintenance
- −$1,148
- − Management
- −$1,148
- − Depreciation
- −$5,178
- Taxable loss
- −$6,749
- Est. tax savings @ 24.0%
- +$1,620
- After-tax cash flow
- $-1,899/yr
For passive investors: Depreciation is non-cash, so a rental often shows a tax loss while cash-flowing — sheltering income. Rental losses are passive: they offset passive income freely, and up to $25,000/yr can offset ordinary (W-2) income if you actively participate and your MAGI is under $100k (phasing out to $0 by $150k); unused losses carry forward. On sale, claimed depreciation is recaptured at up to 25%, and gains may owe capital-gains tax (a 1031 exchange can defer both). Figures are a year-1 estimate at your 24.0% rate — not tax advice; consult a CPA.
Schools (NCES district)
- District
- Corning City School District
- NCES district ID
- 3608400
- Math proficiency
- 44% ▼ -12.00%
- Reading proficiency
- 53% ▲ 4.00%
- Median HH income
- $53,042
- Composite
- 41.8/100
- National rank
- #3392
- State rank
- #406 of 590 in NY
Livability — Gang Mills
- Score
- 68/100
- State rank
- #532
- US rank
- #9596
Category grades
Schools grade is shown separately in the Schools card above.
Census & demographics
- City population
- 10,086
- Population (ZIP)
- 1,405
Population outlook (Steuben County) Hauer SSP2
- Today (2025)
- 93,062 people
- By 2030
- 89,793 · -3.5%
- By 2040
- 82,353 · -11.5%
- By 2050
- 74,286 · -20.2%
- By 2075
- 55,589 · -40.3%
- By 2100
- 37,587 · -59.6%
Race, ethnicity, and origin ACS 2023
- Neighborhood character
- Predominantly White (93%)
- Race & ethnicity
- White 93% Two or more races 5%
- Common ancestry
- Slovak 3% Lithuanian 2% Romanian 2%
- Foreign-born
- 1%
Political lean MEDSL · Steuben
- 2024 margin
- Solid R (+31.8) · D 34.1% · R 65.9%
- 2008→2024 swing
- -15.0pp toward R · 2008: -16.8pp · 2024: -31.8pp
- All cycles
- 2024: R+31.8 2020: R+29.6 2016: R+36.2 2012: R+16.4 2008: R+16.8
Not yet ingested
- Civics
- —
Market trends
- HPI YoY
- ▲ 5.43%
- Current HPI
- 259.0652
- Rent YoY
- —
- Metro
- —
- State GDP YoY
- ▲ 2.60%
- F500 in state
- 92
Industry mix (Fortune 500 HQ in NY)
| Industry | F500 HQs | Revenue |
|---|---|---|
| Financial Services | 10 | $950B |
|
||
| Consumer Goods | 9 | $162B |
|
||
| Insurance | 4 | $225B |
|
||
| Telecommunications | 2 | $144B |
|
||
| Pharmaceuticals | 2 | $112B |
|
||
| Media / Entertainment | 2 | $69B |
|
||
Price history
+304.5% since first listed5 events — show timeline
- 2026-06-08 Price Changed $178,000 WNYREIS
- 2026-05-20 Price Changed $188,000 WNYREIS
- 2026-05-06 Listed $199,900 WNYREIS
- 2018-01-18 Sold (Public Records) $47,000 Public Records
- 2017-05-24 Sold (Public Records) $44,000 Public Records
Property tax history
-5.3%/yrLatest (2025): $2,763 · +2.7% YoY. Source: county tax records.
Cash-flow waterfall
monthlySold comps — $/sqft
last 12 mo · ≤1 miLoading sold comps…