 Triplex
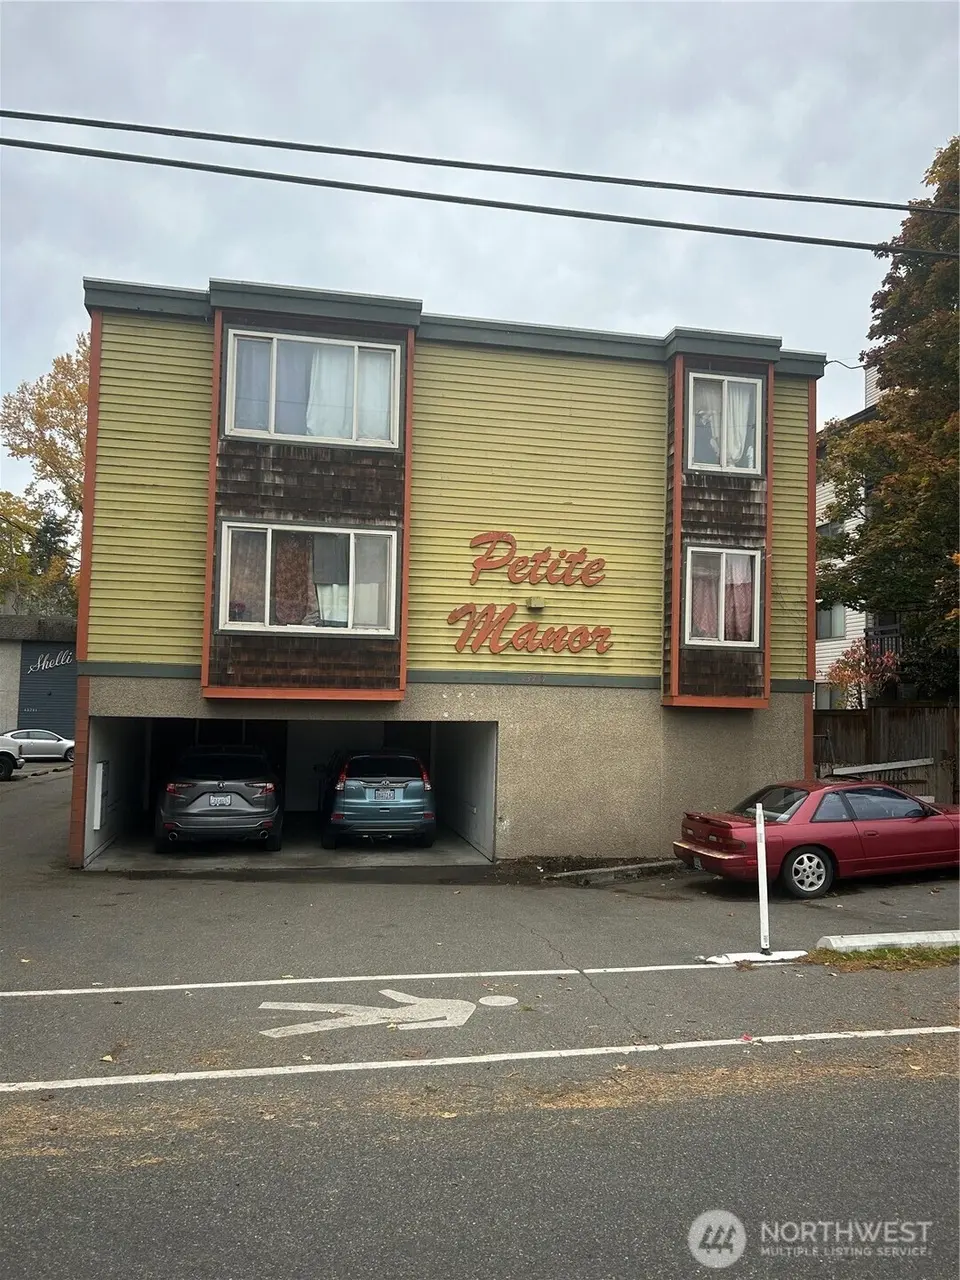
13717 32nd Ave NE · Seattle, WA
Flood risk 1/10 · Minimal
- FEMA flood zone
- X (unshaded)
- Chance of flooding over 30 yrs
- 0.0%
- Est. flood insurance / yr
- $507 – $1,088
Fire risk 1/10 · Minimal
- Est. fire insurance / yr
- $604 – $1,122
Heat risk 3/10 · Minor
- Hot days now (above 86°F)
- 7 days/yr
- Hot days in 30 yrs
- 15 days/yr
Wind risk 1/10 · Minimal
- Chance of severe wind over 30 yrs
- —
Air-quality risk 7/10 · Major
- Unhealthy air days now
- 10 days/yr
- Unhealthy air days in 30 yrs
- 11 days/yr
Risk factors via First Street. Map © Google.
Why this score? — see what drove the D grade
The composite is a weighted blend of 9 inputs, each scored 0–100. Each bar is that input's sub-score; the figure is the points it added to the 100-point composite (weight × sub-score).
- ARV discount +15.0/15.0
- Cash flow +7.4/30.0
- Schools +6.1/10.0
- Livability +3.8/5.0
- Rent growth +2.7/5.0
- Condition / age +2.5/5.0
- 1% rule +1.7/10.0
- DSCR +1.5/10.0
- Appreciation +0.0/10.0
$1,250,000
🖨 Deal sheet 📄 Offer letter ✓ Due diligence
Multi-family units
County records classify this as Multi-Family (5+ Unit). Listing-text estimate: 3 units. estimate disagrees with records
5+ unit building — per-unit beds/baths from public records are typically unavailable; the breakdown below (if shown) is an estimate from the listing text.
Listing remarks
This beautiful property is located in the Lake City neighborhood just a few block from main arterial Lake City Way NE . Lake City Way NE showcases demographic growth with increased housing demand. This property is adequately 100% rented on a sub-normal rent rate. Area features efficient transit options and close to major employment centers. King County Metro serves frequently to Seattle Downtown as well as Bothell Eastside as well as other tourists places such as shopping malls , Burke Gillman trails, University of Washington as well as Seattle Downtown. Well maintained property with new carpet in the common areas . Stable cash flow opportunity. Building is sold as is. Buyer to do the own d
Key facts
- 6,384 sq ft lot
- 4 garage spots
- Built 1969
Neighborhood map
What this means for you Summary
Snapshot
- This is a 3 × 2-bed/1-bath units multifamily listed at $1.25M.
Deal economics
- At list price, monthly cash flow is $-2k ($-20k/yr) — negative. Per door: $-543/mo.
- To cash-flow at today's rent, offer at most $962k (23.0% below list).
- To meet the 1% rule (rent ≥ 1% of price), the offer needs to be $838k (33.0% below list).
- Recommended offer: $838k (33.0% below list) — sets the bar for 1% rule.
- Cap rate 4.7% vs local median 1.6% in Seattle — top-decile yield for the area; either an underpriced asset or a hidden risk that comps aren't pricing in. Stress-test before assuming the spread holds.
Location & tenants
- Location reads 75/100 on livability (#166 in WA, #4,033 nationally) — a middle-class / working-renter tenant base. Strengths: amenities A+, commute A+, employment A+; Watch: crime F, cost of living F.
- Seattle Public Schools (urban): math 64% / reading 72% proficiency, ranked #19 of 291 in WA (top 6%) — acceptable for families but not a draw, mixed tenant base, ~2y average lease.
- Market conditions: Rents flat; 208 active listings in the ZIP; solid renter incomes; 10,555 units permitted in King County in 2024 (7,119 in 5+ unit buildings).
- At $8,377/mo this rent would consume 101% of the median local household income ($100k/yr) (locally 2720% of renters already pay >50% of income on rent) — very limited rent-growth headroom before tenants either downsize or default.
Forward outlook
- Local home prices are declining (-3.0%/yr); year-one equity from $9k of loan paydown is wiped out by about $38k of value loss. Plan a longer hold.
- King County population projected at +44% by 2050 — long-run rental-demand tailwind backs the buy-and-hold thesis.
Negotiation context
- It's been on market 187 days — a 12% lower offer ($1.10M) is reasonable based on typical stale-listing flexibility.
- 2 sale attempts since 23y ago; this cycle's ask has dropped $400k (24%) from the opening price — seller is motivated, your offer sets the floor, not the list.
- Current owner paid $615k; list at $1.25M implies a 103% gain — meaningful room to come down on a strong offer.
Questions for the listing agent
- What do current leases actually rent for vs. the listed asking? Can we see a recent rent roll and the last 12 months of T-12 income?
- It's been on market 187 days. Have you received any prior offers? Is the seller open to a 33% concession, seller financing, or rate buy-down credit?
- Can we see the unit-by-unit rent roll, current vacancy, and any below-market leases? What's the average tenancy length?
- What capital expenditures (roof, boiler, parking lot, exteriors) have been made in the last 5 years, and what's planned in the next 2?
- Built in 1969 — when were the roof, HVAC, electrical panel, plumbing, and water heater last replaced?
- Why hasn't it sold? Are there any deal-killer items the seller is aware of (foundation, flood, title, zoning, code violations)?
- Is there a deadline driving the sale (1031 exchange, divorce, estate, relocation)? That informs how much negotiation room exists.
- Schools are A-rated — typically a magnet for longer-tenancy family renters. What's the average tenant stay here, and is there a school-zone premium baked into asking?
- Crime grade is F in this area — have there been break-ins, vandalism, or insurance claims at this property in the last 3 years? What carrier currently insures it and at what premium?
- The area grade is low — what's the realistic commute time and amenity access for the typical tenant pool here? Any planned neighborhood developments (good or bad) we should know about?
- What's the average days-on-market for RENTAL listings here right now (not sales)? A rising rental-DOM trend means longer vacancies and softer asking-rent achievability than the comps imply.
- What's the recent tenant-quality profile in this submarket — average credit score on applications, eviction rate, late-payment / NSF rate, and stable-employment percentage? A property-management company in the area should have these aggregated.
- How much new apartment / multifamily construction is in the pipeline within 1–3 miles? Heavy new supply (>2% of stock underway) typically softens rents 12–24 months out; light construction supports rent growth.
Investment metrics
- 1% rule
- 0.67% ✗
- Cap rate
- 4.73%
- Cash-on-cash
- -5.58%
- DSCR
- 0.75
- GRM
- 12.4
CMA / ARV
- ARV (median comp)
- $1,722,585
- List price
- $1,250,000
- Delta
- -27.43%
- Verdict
- UNDERPRICED
- Comps
- 2 within 1.0 mi
Projected returns pro-forma
-3.0% appreciation · 0.83% rent growth · sell at horizon
- IRR
- -28.2%
- Equity multiple
- 0.07×
- Total profit
- $-324,276
- Equity at exit
- $186,379
- IRR
- -37.3%
- Equity multiple
- -0.39×
- Total profit
- $-486,711
- Equity at exit
- $108,077
Cash invested: $350,000 (down + closing). Projections, not guarantees.
Landlord ↔ Tenant lean methodology
- Overall (CITY)
- 0 Strongly Tenant-Friendly
- State Washington
- 28 Tenant-Leaning · D+8
- County
- — inherits STATE
- City Seattle
- 0 Strongly Tenant-Friendly · D+52
ZIP-level market 98125
- Rents YoY
- 0.8%
- Active inventory
- 208
- Price-to-rent
- 37.3×
Monthly cashflow live
- Estimated rent
- $8,377 high interval (Pro) →
- Mortgage (P&I)
- −$6,555
- Tax from tax record
- −$1,170 /mo · $14,041/yr
- Insurance
- −$521
- HOA
- −$0
- Vacancy / Maint / Mgmt
- −$1,759
- Net cashflow
- $-1,628
Break-even live
3-unit breakdown (identical units grouped — click to expand)
| Units | Beds | Baths | Est. rent |
|---|---|---|---|
| 3× units | 2 | 1 | $8,376 |
| #1 | 2 | 1 | $2,792 |
| #2 | 2 | 1 | $2,792 |
| #3 | 2 | 1 | $2,792 |
| Total (3 units) | $8,377 | ||
UW: 25.0% down · 7.5% · 30yr · 1.5% tax · 5.0% vac · 8.0% maint · 8.0% mgmt
Financing live
Cash to close
- Down payment
- $312,500
- Closing costs
- $37,500
- Reserves months
- —
- Total cash needed
- —
Loan-product check · same deal, 3 products live
Conventional
25% down · 7.5% · 30yr
- Down + closing
- —
- Monthly P&I
- —
- Monthly cashflow
- —
- DSCR
- —
- Eligible?
- —
Personal DTI + credit; lowest rate.
DSCR
20% down · 8.5% · 30yr
- Down + closing
- —
- Monthly P&I
- —
- Monthly cashflow
- —
- DSCR
- —
- Eligible?
- —
No personal income docs; deal must DSCR.
Hard money
10% down · 12.0% · 12mo
- Down + closing
- —
- Monthly P&I
- —
- Monthly cashflow
- —
- DSCR
- —
- Eligible?
- —
Short-term bridge; refi at stabilization.
Listing history 10 events
-
2026-05-06status Pending
-
2026-04-24price $1,250,000
-
2026-04-13price $1,399,000
-
2026-03-01price $1,490,000
-
2025-10-31$1,650,000 Active
-
2003-12-01soldstatus $615,000
-
2003-11-25soldstatus $614,600
-
2003-10-01historical
-
2003-06-01$635,000
-
1997-05-30soldstatus $400,000
ⓘ Source: listings_history table (triggers on properties + properties_extension) + one-shot
backfill from property_details.listing_events for pre-trigger history.
Tax reassessment forecast WA · Resets to sale price
- Current annual tax
- $14,041 · $1,170/mo
- Projected year-2 tax
- $14,041 · $1,170/mo
- Expected delta
- $0/yr ($0/mo · 0.0%)
ⓘ Screening estimate from a state-policy table — verify with the county assessor before closing.
Climate risk First Street
- Flood 1/10 Low FEMA zone X (unshaded) · 0% chance over 30 yrs
- Wildfire 1/10 Low
- Heat 3/10 Moderate 7 d/yr ≥86°F today · 15 d/yr by 30 yrs out
- Wind 1/10 Low
- Air quality 7/10 Severe 10 unhealthy d/yr today · 11 by 30 yrs out
Nearby sold comps map
Loading sold comps map…
Walkable amenities ~0.75 mi
Loading nearby amenities…
Taxation est. · year 1
- Rental income
- $100,524
- − Mortgage interest
- −$70,019
- − Property taxes
- −$14,041
- − Insurance
- −$6,250
- − Repairs & maintenance
- −$8,042
- − Management
- −$8,042
- − Depreciation
- −$36,364
- Taxable loss
- −$42,234
- Est. tax savings @ 24.0%
- +$10,136
- After-tax cash flow
- $-9,403/yr
For passive investors: Depreciation is non-cash, so a rental often shows a tax loss while cash-flowing — sheltering income. Rental losses are passive: they offset passive income freely, and up to $25,000/yr can offset ordinary (W-2) income if you actively participate and your MAGI is under $100k (phasing out to $0 by $150k); unused losses carry forward. On sale, claimed depreciation is recaptured at up to 25%, and gains may owe capital-gains tax (a 1031 exchange can defer both). Figures are a year-1 estimate at your 24.0% rate — not tax advice; consult a CPA.
Schools (NCES district)
- District
- Seattle Public Schools
- NCES district ID
- 5307710
- Math proficiency
- 64% ▼ -1.00%
- Reading proficiency
- 72% ▬ 0.00%
- Median HH income
- $68,695
- Composite
- 60.76/100
- National rank
- #1649
- State rank
- #19 of 291 in WA
Livability — Seattle
- Score
- 75/100
- State rank
- #166
- US rank
- #4033
Category grades
Schools grade is shown separately in the Schools card above.
Census & demographics
- Census place
- Seattle, WA
- County
- King County · 2,251,916 people
- City population
- 706,262
- Metro
- Seattle-Tacoma-Bellevue, WA
- Population (ZIP)
- 44,520
- Household income
- $99,868
- Rent vs Own
- Severe rent burden
- 2720.0
Population outlook (King County) Hauer SSP2
- Today (2025)
- 2,576,485 people
- By 2030
- 2,803,316 · +8.8%
- By 2040
- 3,255,921 · +26.4%
- By 2050
- 3,706,444 · +43.9%
- By 2075
- 4,746,063 · +84.2%
- By 2100
- 5,407,730 · +109.9%
Race, ethnicity, and origin ACS 2023
- Neighborhood character
- Diverse neighborhood (Simpson 0.61)
- Race & ethnicity
- White 59% Asian 17% Two or more races 10% Hispanic / Latino 9% Black 8%
- Hispanic origin (detail)
- Mexican 5%
- Common ancestry
- Portuguese 5% Italian 3% Slovak 3%
- Foreign-born
- 22% · Canada, China, Vietnam
- Languages at home
- 73% English-only · Spanish 6% Chinese 6% Other Indo-European 3%
Political lean MEDSL · King
- 2024 margin
- Solid D (+51.7) · D 74.2% · R 22.5% · Other 3.4%
- 2008→2024 swing
- +9.6pp toward D · 2008: 42.1pp · 2024: 51.7pp
- All cycles
- 2024: D+51.7 2020: D+52.7 2016: D+50.4 2012: D+39.9 2008: D+42.1
Not yet ingested
- Civics
- —
Market trends
- HPI YoY
- ▼ -1128.18%
- Current HPI
- 337.7979
- Rent YoY
- ▲ 0.83%
- Metro
- Seattle-Tacoma-Bellevue, WA
- State GDP YoY
- ▲ 4.65%
- F500 in state
- 22
Industry mix (Fortune 500 HQ in WA)
| Industry | F500 HQs | Revenue |
|---|---|---|
| Retail | 2 | $269B |
|
||
| Technology / Retail | 1 | $638B |
|
||
| Technology | 1 | $245B |
|
||
| Telecommunications | 1 | $38B |
|
||
| Food / Beverage | 1 | $36B |
|
||
| Automotive / Trucks | 1 | $34B |
|
||
Price history
+212.5% since first listed10 events — show timeline
- 2026-05-06 Pending — NWMLS as Distributed by MLS Grid
- 2026-04-24 Price Changed $1,250,000 NWMLS as Distributed by MLS Grid
- 2026-04-13 Price Changed $1,399,000 NWMLS as Distributed by MLS Grid
- 2026-03-01 Price Changed $1,490,000 NWMLS as Distributed by MLS Grid
- 2025-10-31 Listed $1,650,000 NWMLS as Distributed by MLS Grid
- 2003-12-01 Sold (MLS) $615,000 NWMLS as Distributed by MLS Grid
- 2003-11-25 Sold (Public Records) $614,600 Public Records
- 2003-10-01 Delisted — NWMLS as Distributed by MLS Grid
- 2003-06-01 Listed $635,000 NWMLS as Distributed by MLS Grid
- 1997-05-30 Sold (Public Records) $400,000 Public Records
Property tax history
+5.3%/yrLatest (2025): $14,041 · -6.3% YoY. Source: county tax records.
Cash-flow waterfall
monthlySold comps — $/sqft
last 12 mo · ≤1 miLoading sold comps…