 Multi-family
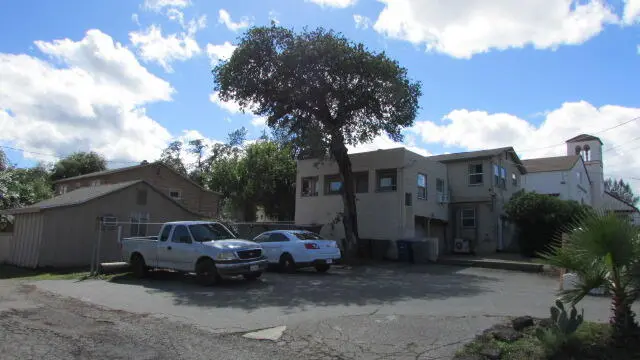
1933 Eureka Way · Redding, CA
Flood risk No data
- FEMA flood zone
- —
- Chance of flooding over 30 yrs
- —
- Est. flood insurance / yr
- —
Fire risk No data
- Est. fire insurance / yr
- —
Heat risk No data
- Hot days now (above threshold)
- —
- Hot days in 30 yrs
- —
Wind risk No data
- Chance of severe wind over 30 yrs
- —
Air-quality risk No data
- Unhealthy air days now
- —
- Unhealthy air days in 30 yrs
- —
Risk factors via First Street. Map © Google.
Why this score? — see what drove the B grade
The composite is a weighted blend of 9 inputs, each scored 0–100. Each bar is that input's sub-score; the figure is the points it added to the 100-point composite (weight × sub-score).
- Cash flow +30.0/30.0
- 1% rule +10.0/10.0
- DSCR +10.0/10.0
- ARV discount +7.5/15.0
- Schools +4.6/10.0
- Rent growth +4.4/5.0
- Livability +3.8/5.0
- Condition / age +2.2/5.0
- Appreciation +0.0/10.0
$997,500
🖨 Deal sheet (PDF) 📄 Offer letter ✓ Due diligence
Multi-family units
County records classify this as Multi-Family (5+ Unit). Listing-text estimate: 1 unit. estimate disagrees with records
5+ unit building — per-unit beds/baths from public records are typically unavailable; the breakdown below (if shown) is an estimate from the listing text.
Listing remarks
Multi-Family Investment Opportunity! Exceptional income-producing property featuring 4 adjoining parcels with a total of 12 rental units plus a profitable self-serve carwash. This versatile investment offers significant upside potential and strong cash-flow opportunities. The property includes mixed units consisting of: 1 three-bedroom unit 2 two-bedroom units 5 one-bedroom units 4 studio apartments This well-balanced combination appeals to a wide range of tenants and supports consistent occupancy. Many of the rental units have undergone recent renovations, while current rents remain slightly below market value, creating room for future income growth. Complex also includes Laundry r
Key facts
- Strong cash flow
- Rental units
- Self serve carwash
Tags
Property features AI
Exterior
- Parking: Off-street parking; On-street parking
- Home design: Residential income property
- Construction: Shingle siding; Stucco; Wood siding
- Exterior features: Off-street and on-street parking available; Additional parcel identifiers associated with the property
Interior
- Heating & cooling: Central cooling; Natural gas heating; Electric heating; Wall furnace
- Interior features: Has heating and cooling; Natural gas and electric heating available; Wall furnace
Neighborhood map
What this means for you Summary
Snapshot
- This is a multifamily listed at $998k. Condition is rated fair.
Deal economics
- At list price, monthly cash flow is $5k ($65k/yr) — positive.
- The deal already cash-flows at list — no discount required.
- Meets the 1% rule at list price ($16k rent vs $998k).
- Recommended offer: $968k (3.0% below list) — sets the bar for market timing.
- Cap rate 12.8% vs local median 3.3% in Redding — top-decile yield for the area; either an underpriced asset or a hidden risk that comps aren't pricing in. Stress-test before assuming the spread holds.
Location & tenants
- Location reads 76/100 on livability (#106 in CA, #3,726 nationally) — a middle-class / working-renter tenant base. Strengths: amenities A+, commute A+, health & safety A+; Watch: employment C-, crime F, cost of living F.
- Shasta Union High (urban): math 41% / reading 67% proficiency, ranked #122 of 517 in CA (top 24%) — acceptable for families but not a draw, mixed tenant base, ~2y average lease; only 16% free/reduced lunch — higher-income household profile.
- Market conditions: Rents rising fast (+7.5%/yr); 331 active listings in the ZIP; 31 comparable units currently listed for rent nearby; rentals at typical pace (median 14d on market — plan ~3-4 weeks tenant-placement turnaround); 246 units permitted in Shasta County in 2024 (0 in 5+ unit buildings).
- At $15,594/mo this rent would consume 258% of the median local household income ($72k/yr) (locally 1458% of renters already pay >50% of income on rent) — very limited rent-growth headroom before tenants either downsize or default.
Forward outlook
- Local home prices are declining (-3.0%/yr); year-one equity from $7k of loan paydown is wiped out by about $30k of value loss. Plan a longer hold.
- Shasta County population projected to shrink 9% by 2050 — rents likely to lag national; underwrite the cash flow, not the appreciation.
- At projected returns (-3.0% appreciation + 7.5% rent growth), your $279k cash investment doubles in ~5 years — after that, you're playing with house money.
Negotiation context
- It's been on market 34 days — a 3% lower offer ($968k) is reasonable based on typical stale-listing flexibility.
- 3 sale attempts since 10y ago; this cycle's ask has dropped $102k (9%) from the opening price — seller is motivated, your offer sets the floor, not the list.
Risks & watch-outs
- Watch-outs: built in 1948 — expect roof / HVAC / electrical / plumbing capex.
Questions for the listing agent
- It's been on market 34 days. Have you received any prior offers? Is the seller open to a 3% concession, seller financing, or rate buy-down credit?
- Have any recent inspections been done? Can we get a copy of the seller's disclosures and any deferred-maintenance estimates?
- Built in 1948 — when were the roof, HVAC, electrical panel, plumbing, and water heater last replaced?
- Is there a deadline driving the sale (1031 exchange, divorce, estate, relocation)? That informs how much negotiation room exists.
- Schools are B-rated — typically a magnet for longer-tenancy family renters. What's the average tenant stay here, and is there a school-zone premium baked into asking?
- Crime grade is F in this area — have there been break-ins, vandalism, or insurance claims at this property in the last 3 years? What carrier currently insures it and at what premium?
- What's the average days-on-market for RENTAL listings here right now (not sales)? A rising rental-DOM trend means longer vacancies and softer asking-rent achievability than the comps imply.
- What's the recent tenant-quality profile in this submarket — average credit score on applications, eviction rate, late-payment / NSF rate, and stable-employment percentage? A property-management company in the area should have these aggregated.
- How much new apartment / multifamily construction is in the pipeline within 1–3 miles? Heavy new supply (>2% of stock underway) typically softens rents 12–24 months out; light construction supports rent growth.
Investment metrics
- 1% rule
- 1.56% ✓
- Cap rate
- 12.82%
- Cash-on-cash
- 23.31%
- DSCR
- 2.04
- GRM
- 5.3
CMA / ARV
No comps found within radius.
Show comp detail 12 sales within ~0.75 mi
| Address | Dist | Beds/Ba | Sqft | Sold | Price | $/sf | Match |
|---|---|---|---|---|---|---|---|
| 1115, 1117 West St | 0.09mi | —/— | — | 13mo | $605,000 | — | 73 |
| 2235 Tehama St | 0.28mi | —/— | — | 7mo | $750,000 | — | 69 |
| 849 West St | 0.32mi | —/— | — | 7mo | $331,000 | — | 67 |
| 1423-1429 Orange Ave | 0.30mi | —/— | — | 12mo | $306,425 | — | 63 |
| 2208 Shasta St | 0.20mi | —/— | — | 18mo | $525,000 | — | 63 |
| 1431-1437 Orange Ave | 0.31mi | —/— | — | 12mo | $400,000 | — | 63 |
| 1415-1421 Orange Ave | 0.30mi | —/— | — | 15mo | $405,000 | — | 61 |
| 1623/25/27 Willis St | 0.34mi | —/— | — | 14mo | $450,000 | — | 60 |
| 1969 8th St St | 0.35mi | —/— | — | 18mo | $750,000 | — | 56 |
| 1635 Willis St | 0.36mi | —/— | — | 19mo | $359,000 | — | 55 |
| 1115-1123 Eureka Way | 0.59mi | —/— | — | 10mo | $750,000 | — | 52 |
| 2123 Waldon St | 0.75mi | 13/— | — | 3mo | $1,250,000 | — | 50 |
Match score weights: distance 35% · size 25% · config 20% · recency 20%. Top-matched comps best support the ARV.
Projected returns pro-forma
-3.0% appreciation · 7.55% rent growth · sell at horizon
- IRR
- 21.4%
- Equity multiple
- 1.93×
- Total profit
- $258,829
- Equity at exit
- $148,730
- IRR
- 32.4%
- Equity multiple
- 4.61×
- Total profit
- $1,007,922
- Equity at exit
- $86,246
Cash invested: $279,300 (down + closing). Projections, not guarantees.
Landlord ↔ Tenant lean methodology
- Overall (STATE)
- 18 Strongly Tenant-Friendly
- State California
- 18 Strongly Tenant-Friendly · D+13
- County
- — inherits STATE
- City
- — inherits STATE
ZIP-level market 96001
- Rents YoY
- 7.5%
- Active inventory
- 331
- Price-to-rent
- 49.5×
Monthly cashflow live
- Estimated rent
- $15,594 high interval (Pro) →
- Mortgage (P&I)
- −$5,231
- Tax est. 1.5%
- −$1,247 /mo · $14,962/yr
- Insurance
- −$416
- HOA
- −$0
- Vacancy / Maint / Mgmt
- −$3,275
- Net cashflow
- $5,426
Break-even live
Sensitivity live
| Price | -10% $6,115 | -5% $5,770 | +0% $5,426 | +5% $5,081 | +10% $4,736 |
|---|---|---|---|---|---|
| Rent | -10% $4,194 | -5% $4,810 | +0% $5,426 | +5% $6,042 | +10% $6,658 |
| Rate | -1.0pp $5,928 | -0.5pp $5,679 | base $5,426 | +0.5pp $5,167 | +1.0pp $4,904 |
12-unit breakdown (identical units grouped — click to expand)
| Units | Beds | Baths | Est. rent |
|---|---|---|---|
| 1× unit | 3 | 1 | $1,680 |
| 2× units | 2 | 1 | $2,900 |
| #2 | 2 | 1 | $1,450 |
| #3 | 2 | 1 | $1,450 |
| 9× units | 1 | 1 | $11,016 |
| #4 | 1 | 1 | $1,224 |
| #5 | 1 | 1 | $1,224 |
| #6 | 1 | 1 | $1,224 |
| #7 | 1 | 1 | $1,224 |
| #8 | 1 | 1 | $1,224 |
| #9 | 1 | 1 | $1,224 |
| #10 | 1 | 1 | $1,224 |
| #11 | 1 | 1 | $1,224 |
| #12 | 1 | 1 | $1,224 |
| Total (12 units) | $15,594 | ||
UW: 25.0% down · 7.5% · 30yr · 1.5% tax · 5.0% vac · 8.0% maint · 8.0% mgmt
Financing live
Cash to close
- Down payment
- $249,375
- Closing costs
- $29,925
- Reserves months
- —
- Total cash needed
- —
Loan-product check · same deal, 3 products live
Conventional
25% down · 7.5% · 30yr
- Down + closing
- —
- Monthly P&I
- —
- Monthly cashflow
- —
- DSCR
- —
- Eligible?
- —
Personal DTI + credit; lowest rate.
DSCR
20% down · 8.5% · 30yr
- Down + closing
- —
- Monthly P&I
- —
- Monthly cashflow
- —
- DSCR
- —
- Eligible?
- —
No personal income docs; deal must DSCR.
Hard money
10% down · 12.0% · 12mo
- Down + closing
- —
- Monthly P&I
- —
- Monthly cashflow
- —
- DSCR
- —
- Eligible?
- —
Short-term bridge; refi at stabilization.
Rent comps 31 comps
| Address | Beds | Baths | Sqft | Rent | $/sqft | DOM | Units | Dist |
|---|---|---|---|---|---|---|---|---|
| 2045 Shasta St Redding, CA | 1.0 | 1.0 | 491 | $1,250 | $2.55 | 14d | 1 | 0.14mi |
| 1144 Willis St Redding, CA | 3.0 | 1.0 | 1350 | $1,700 | $1.26 | 14d | 1 | 0.15mi |
| 1033 West St Unit 1033 Redding, CA | 1.0 | 1.0 | 800 | $1,200 | $1.50 | 21d | 1 | 0.16mi |
| 1435 Willis St Unit 6 Redding, CA | 2.0 | 1.0 | 900 | $1,300 | $1.44 | 14d | 1 | 0.21mi |
| 1980 Tenth St Unit 1990 Redding, CA | 2.0 | 1.0 | — | $1,099 | — | 14d | 1 | 0.23mi |
| 2142 Butte St Redding, CA | 1.0 | 1.0 | — | $2,010 | — | 14d | 1 | 0.26mi |
| 944 West St Unit 1 Redding, CA | 2.0 | 1.0 | 966 | $1,400 | $1.45 | 14d | 1 | 0.26mi |
| 1445 Magnolia Ave Apt 6 Redding, CA | 1.0 | 1.0 | 525 | $1,150 | $2.19 | 14d | 1 | 0.27mi |
| 1538 West St Unit 03 Redding, CA | 1.0 | 1.0 | — | $1,099 | — | 14d | 1 | 0.27mi |
| 1167 Orange Ave Unit 1169 Redding, CA | 1.0 | 1.0 | 713 | $1,250 | $1.75 | 14d | 1 | 0.28mi |
| 1529 Willis St Unit 6 Redding, CA | 2.0 | 1.0 | 849 | $1,545 | $1.82 | 14d | 1 | 0.29mi |
| 1559 Willis St Redding, CA | 1.0 | 1.0 | — | $1,150 | — | 21d | 1 | 0.31mi |
| 2352 Shasta St Redding, CA | 2.0 | 2.0 | 1100 | $2,050 | $1.86 | 14d | 1 | 0.35mi |
| 1616 Willis St Unit 2 Redding, CA | 2.0 | 1.0 | 850 | $1,300 | $1.53 | 14d | 1 | 0.36mi |
| 1623 Magnolia Ave Redding, CA | 1.0 | 1.0 | — | $1,350 | — | 14d | 1 | 0.38mi |
| 760 West St Unit 764 Redding, CA | 1.0 | 1.0 | 600 | $1,029 | $1.72 | 14d | 1 | 0.43mi |
| 715 Mary St Redding, CA | 2.0 | 1.0 | 790 | $1,395 | $1.77 | 14d | 1 | 0.48mi |
| 1907 Grace Ave Apt B Redding, CA | 2.0 | 1.0 | 832 | $1,215 | $1.46 | 21d | 1 | 0.53mi |
| 2391 Placer St Unit B Redding, CA | 3.0 | 2.0 | 1500 | $1,800 | $1.20 | 14d | 1 | 0.55mi |
| 1020 Gilbert St Redding, CA | 2.0 | 1.5 | — | $2,200 | — | 14d | 1 | 0.56mi |
| 1075 Trinity St Redding, CA | 2.0 | 1.0 | 720 | $1,275 | $1.77 | 14d | 1 | 0.58mi |
| 1090 Continental St Unit 20 Redding, CA | 2.0 | 1.0 | 990 | $1,199 | $1.21 | 14d | 1 | 0.65mi |
| 2119 Pine St Redding, CA | 1.0 | 1.0 | 650 | $1,195 | $1.84 | 21d | 1 | 0.80mi |
| 2222 California St Unit 08 Redding, CA | 1.0 | 1.0 | 800 | $1,095 | $1.37 | 14d | 1 | 0.82mi |
| 1895 Benton Dr Redding, CA | 2.0 | 1.0 | — | $962 | — | 14d | 1 | 0.89mi |
| 2487 Court St Apt 9 Redding, CA | 2.0 | 1.0 | 725 | $1,199 | $1.65 | 21d | 1 | 0.97mi |
| 1502 Cottonwood Ave Redding, CA | 3.0 | 2.0 | 1164 | $2,000 | $1.72 | 14d | 1 | 0.98mi |
| 3350 Mountain Oak Dr Redding, CA | 3.0 | 2.5 | 3132 | $4,500 | $1.44 | 21d | 1 | 1.11mi |
| 1465 Benton Dr Unit 03 Redding, CA | 2.0 | 2.0 | — | $1,279 | — | 14d | 1 | 1.15mi |
| 911 Parkview Ave Redding, CA | 1.0 | 1.0 | 800 | $1,350 | $1.69 | 14d | 1 | 1.25mi |
| 540 South St Redding, CA | 1.0 | 1.0 | 536 | $1,295 | $2.42 | 14d | 1 | 1.27mi |
Listing history 20 events
-
2026-06-19days on market $997,500 Active 34 DOM
-
2026-06-18days on market $997,500 Active 33 DOM
-
2026-06-17days on market $997,500 Active 32 DOM
-
2026-06-16days on market $997,500 Active 31 DOM
-
2026-06-15days on market $997,500 Active 30 DOM
-
2026-06-14days on market $997,500 Active 28 DOM
-
2026-06-13pricedays on market $997,500 Active 27 DOM
-
2026-06-10days on market $1,100,000 Active 25 DOM
-
2026-06-09days on market $1,100,000 Active 24 DOM
-
2026-06-08days on market $1,100,000 Active 23 DOM
-
2026-06-07days on market $1,100,000 Active 22 DOM
-
2026-06-05days on market $1,100,000 Active 19 DOM
-
2026-06-03days on market $1,100,000 Active 18 DOM
-
2026-06-02days on market $1,100,000 Active 17 DOM
-
2026-06-01days on market $1,100,000 Active 16 DOM
-
2026-05-31days on market $1,100,000 Active 15 DOM
-
2026-05-30days on market $1,100,000 Active 14 DOM
-
2026-05-11$1,100,000 Active
-
2019-02-25$225,000
-
2016-04-21$239,000
ⓘ Source: listings_history table (triggers on properties + properties_extension) + one-shot
backfill from property_details.listing_events for pre-trigger history.
Nearby sold comps map
Loading sold comps map…
Walkable amenities ~0.75 mi
Loading nearby amenities…
Taxation est. · year 1
- Rental income
- $187,128
- − Mortgage interest
- −$55,876
- − Property taxes
- −$14,962
- − Insurance
- −$4,988
- − Repairs & maintenance
- −$14,970
- − Management
- −$14,970
- − Depreciation
- −$29,018
- Taxable income
- $52,344
- Est. tax owed @ 24.0%
- −$12,563
- After-tax cash flow
- $52,547/yr
For passive investors: Depreciation is non-cash, so a rental often shows a tax loss while cash-flowing — sheltering income. Rental losses are passive: they offset passive income freely, and up to $25,000/yr can offset ordinary (W-2) income if you actively participate and your MAGI is under $100k (phasing out to $0 by $150k); unused losses carry forward. On sale, claimed depreciation is recaptured at up to 25%, and gains may owe capital-gains tax (a 1031 exchange can defer both). Figures are a year-1 estimate at your 24.0% rate — not tax advice; consult a CPA.
Condition & rehab AI · 13 photos
This multi-family property requires significant exterior repairs and maintenance to improve its condition and value. Immediate focus should be on the roof and siding, followed by landscaping and interior cleaning.
Repairs flagged
- Major roof — Signs of wear and potential leaks
- Major exterior siding — Worn and peeling
- Major landscaping — Overgrown and unkempt
Value-add opportunities
- Both Paint exterior and repair roof — Enhances curb appeal and rental value
- Both Landscaping and maintenance — Improves curb appeal and rental value
Renovation cost estimate screening
| Repair item | Severity | Est. cost |
|---|---|---|
| roof · Signs of wear and potential leaks | Major | $15,000–50,000 |
| exterior siding · Worn and peeling | Major | $15,000–50,000 |
| landscaping · Overgrown and unkempt | Major | $15,000–50,000 |
| Total estimated repair cost · 3 items | $45,000–150,000 |
Value-add ROI direction
- Both Paint exterior and repair roof — Enhances curb appeal and rental value ↑
- Both Landscaping and maintenance — Improves curb appeal and rental value ↑
ⓘ Cost ranges are severity-bucket heuristics (US national rule-of-thumb). Get contractor quotes + a written scope before underwriting a rehab budget.
Schools (NCES district)
- District
- Shasta Union High
- NCES district ID
- 0636600
- Math proficiency
- 41% ▲ 3.00%
- Reading proficiency
- 67% ▲ 9.00%
- Median HH income
- $50,080
- Composite
- 46.01/100
- National rank
- #2532
- State rank
- #122 of 517 in CA
Livability — Redding
- Score
- 76/100
- State rank
- #106
- US rank
- #3726
Category grades
Schools grade is shown separately in the Schools card above.
Census & demographics
- Census place
- Redding, CA
- County
- Shasta County · 147,641 people
- City population
- 112,523
- Metro
- Redding, CA
- Population (ZIP)
- 33,817
- Household income
- $72,484
- Rent vs Own
- Severe rent burden
- 1458.0
Population outlook (Shasta County) Hauer SSP2
- Today (2025)
- 179,231 people
- By 2030
- 176,953 · -1.3%
- By 2040
- 169,982 · -5.2%
- By 2050
- 162,547 · -9.3%
- By 2075
- 145,649 · -18.7%
- By 2100
- 123,025 · -31.4%
Race, ethnicity, and origin ACS 2023
- Neighborhood character
- Predominantly White (79%)
- Race & ethnicity
- White 79% Hispanic / Latino 10% Two or more races 10% Asian 2% Native American 1% Black 1%
- Hispanic origin (detail)
- Mexican 6%
- Common ancestry
- Italian 4% Lithuanian 3% Portuguese 2%
- Foreign-born
- 3% · Canada
- Languages at home
- 94% English-only · Spanish 3% Other Indo-European 1% Other Asian/Pacific 1%
Political lean MEDSL · Shasta
- 2024 margin
- Solid R (+36.5) · D 30.5% · R 67.0% · Other 2.5%
- 2008→2024 swing
- -10.7pp toward R · 2008: -25.8pp · 2024: -36.5pp
- All cycles
- 2024: R+36.5 2020: R+33.1 2016: R+37.4 2012: R+30.3 2008: R+25.8
Not yet ingested
- Civics
- —
Market trends
- HPI YoY
- ▼ -199.25%
- Current HPI
- 291.6191
- Rent YoY
- ▲ 7.55%
- Metro
- Redding, CA
- State GDP YoY
- ▲ 3.21%
- F500 in state
- 116
Industry mix (Fortune 500 HQ in CA)
| Industry | F500 HQs | Revenue |
|---|---|---|
| Technology | 27 | $1,492B |
|
||
| Financial Services | 3 | $174B |
|
||
| Retail | 3 | $44B |
|
||
| Insurance | 3 | $26B |
|
||
| Media / Entertainment | 2 | $115B |
|
||
| Pharmaceuticals / Biotech | 2 | $62B |
|
||
Price history
+360.3% since first listed3 events — show timeline
- 2026-05-11 Listed $1,100,000 SAOR
- 2019-02-25 Listed $225,000 SAOR
- 2016-04-21 Listed $239,000 SAOR
Cash-flow waterfall
monthlySold comps — $/sqft
last 12 mo · ≤1 miLoading sold comps…