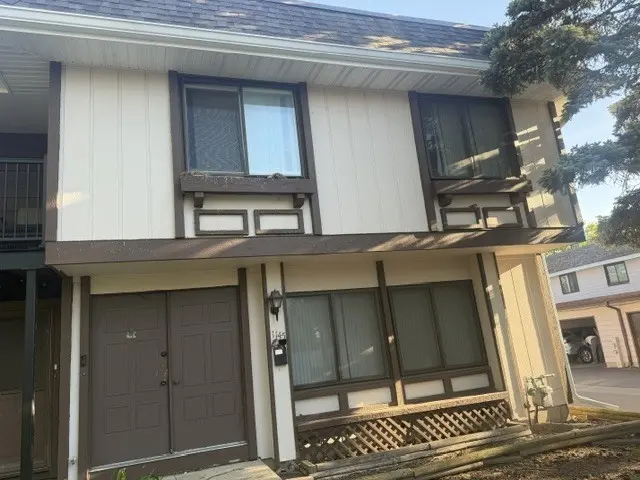
1145 Court G · Hanover Park, IL
Flood risk 1/10 · Minimal
- FEMA flood zone
- X (unshaded)
- Chance of flooding over 30 yrs
- 0.0%
- Est. flood insurance / yr
- $507 – $1,088
Fire risk 1/10 · Minimal
- Est. fire insurance / yr
- $804 – $1,492
Heat risk 3/10 · Minor
- Hot days now (above 102°F)
- 7 days/yr
- Hot days in 30 yrs
- 14 days/yr
Wind risk 2/10 · Minimal
- Chance of severe wind over 30 yrs
- 0.0%
Air-quality risk 3/10 · Minor
- Unhealthy air days now
- 3 days/yr
- Unhealthy air days in 30 yrs
- 3 days/yr
Risk factors via First Street. Map © Google.
Why this score? — see what drove the D- grade
The composite is a weighted blend of 9 inputs, each scored 0–100. Each bar is that input's sub-score; the figure is the points it added to the 100-point composite (weight × sub-score).
- Cash flow +11.9/30.0
- 1% rule +5.0/10.0
- ARV discount +4.3/15.0
- Livability +3.9/5.0
- Schools +3.6/10.0
- DSCR +3.5/10.0
- Rent growth +2.5/5.0
- Condition / age +2.5/5.0
- Appreciation +0.0/10.0
$290,000
🖨 Deal sheet (PDF) 📄 Offer letter ✓ Due diligence
Listing remarks
Check out this large 4 bedroom/2.5 bath townhome! Perfect for owner occupant OR investor. * can also be purchased as part of a portfolio of townhomes in the same area. sold as is.
Key facts
- $268 HOA
- 2 parking spots
- Built 1972
Property features AI
Finance
- Other: Ownership is fee simple with homeowners association
- HOA & community: Monthly association fee of $268; HOA covers clubhouse access, scavenger service and snow removal; Pets allowed (cats and dogs), max pet weight 150 lbs
Exterior
- Parking: 2 parking spaces (total)
- Utilities: Public water; Public sewer
- Home design: Attached single property; Townhouse — 2 story; Entry level is 1
- Construction: Built 51–60 years ago; Construction includes aluminum siding, vinyl siding and brick
- Exterior features: Lot dimensions approximately 29 x 69
Interior
- Kitchen: Kitchen on main level (13 x 11)
- Bedrooms: 4 bedrooms (master on second level); Second-level bedrooms: 16 x 14 (master), 13 x 11, 11 x 9, 11 x 9
- Bathrooms: 2 full bathrooms; 1 half bathroom; Basement has a full bathroom
- Heating & cooling: Natural gas forced air heating; Central air conditioning
- Interior features: Finished full basement; 8 total rooms
- Laundry & utility: Laundry room
Neighborhood map
What this means for you Summary
Snapshot
- This is a 4-bed/2.5-bath townhouse listed at $290k.
Deal economics
- At list price, monthly cash flow is $-76 ($-910/yr) — negative.
- To cash-flow at today's rent, offer at most $277k (4.6% below list).
- To meet the 1% rule (rent ≥ 1% of price), the offer needs to be $289k (0.4% below list).
- Recommended offer: $277k (4.6% below list) — sets the bar for cash-flow.
- Cap rate 6.0% vs local median 4.7% in Hanover Park — meaningfully above typical; check what's discounted (condition, days-on-market, listing class) to confirm the premium yield is real.
Location & tenants
- Location reads 78/100 on livability (#150 in IL, #2,740 nationally) — a middle-class / working-renter tenant base. Strengths: crime A+, employment A+, housing A+; Watch: health & safety D+, amenities F.
- Lake Park Chsd 108 (suburban): math 37% / reading 43% proficiency, ranked #128 of 620 in IL (top 21%) — families likely to look elsewhere, expect single-tenant / working-renter base with shorter leases.
- Zoned schools: Greenbrook Elem School (math 12% / reading 13%, grade F, #1,368 of 2,056 statewide, top 67%, 428 students, 0% FRL); Spring Wood Middle School (math 12% / reading 20%, grade F, #488 of 665 statewide, top 74%, 450 students, 0% FRL); Lake Park High School (math 37% / reading 43%, grade F, #85 of 693 statewide, top 12%, 2,560 students, 0% FRL).
- Zoned-school proficiency averages 23% at this address vs 40% district-wide (-17 pts) — the specific schools serving this property underperform the Lake Park Chsd 108 average; the district grade overstates school quality for this exact location.
- Market conditions: 58 active listings in the ZIP; 4 comparable units currently listed for rent nearby; rentals leasing fast (median 5d on market — plan ~1-2 weeks tenant-placement turnaround); solid renter incomes; 1,378 units permitted in DuPage County in 2024 (594 in 5+ unit buildings).
- This rent runs 38% of the median local income ($92k/yr) — at the standard rent-burdened threshold; future hikes will face affordability resistance.
Forward outlook
- Local home prices are declining (-3.0%/yr); year-one equity from $2k of loan paydown is wiped out by about $9k of value loss. Plan a longer hold.
Negotiation context
- It's been on market 16 days — a 2% lower offer ($286k) is reasonable based on typical stale-listing flexibility.
- Current owner paid $175k; list at $290k implies a 66% gain — meaningful room to come down on a strong offer.
Questions for the listing agent
- What do current leases actually rent for vs. the listed asking? Can we see a recent rent roll and the last 12 months of T-12 income?
- Built in 1972 — when were the roof, HVAC, electrical panel, plumbing, and water heater last replaced?
- What does the HOA fee cover, when was the last increase, and are there any pending special assessments or reserve-fund shortfalls?
- Is there a deadline driving the sale (1031 exchange, divorce, estate, relocation)? That informs how much negotiation room exists.
- Schools are F-rated, which usually means shorter tenancies and higher turnover. Who's the typical renter profile here, and what's been the actual vacancy rate?
- The area grade is low — what's the realistic commute time and amenity access for the typical tenant pool here? Any planned neighborhood developments (good or bad) we should know about?
- What's the average days-on-market for RENTAL listings here right now (not sales)? A rising rental-DOM trend means longer vacancies and softer asking-rent achievability than the comps imply.
- What's the recent tenant-quality profile in this submarket — average credit score on applications, eviction rate, late-payment / NSF rate, and stable-employment percentage? A property-management company in the area should have these aggregated.
- How much new for-sale + rental construction is in the pipeline within 1–3 miles? Heavy new supply typically softens prices + rents 12–24 months out; constrained supply supports both.
Investment metrics
- 1% rule
- 1.00% ✗
- Cap rate
- 5.98%
- Cash-on-cash
- -1.12%
- DSCR
- 0.95
- GRM
- 8.4
CMA / ARV
- ARV (on-the-fly)
- $270,480
- Comps found
- 12
Show comp detail 12 sales within ~0.75 mi
| Address | Dist | Beds/Ba | Sqft | Sold | Price | $/sf | Match |
|---|---|---|---|---|---|---|---|
| 5563 Court F | 0.08mi | 4/2.5 | 1,680 (0%) | 8mo | $275,000 | $164 | 90 |
| 1225 Court C Ave | 0.10mi | 4/2.5 | 1,680 (0%) | 8mo | $270,000 | $161 | 89 |
| 1313 Court P | 0.18mi | 4/2.5 | 1,680 (0%) | 10mo | $290,000 | $173 | 83 |
| 5573 Court F Ct | 0.08mi | 4/2.5 | 1,680 (0%) | 17mo | $241,500 | $144 | 82 |
| 5546 Carmel Dr | 0.06mi | 4/2.5 | 1,680 (0%) | 21mo | $186,100 | $111 | 80 |
| 5704 Tiburon Ct | 0.22mi | 4/2.5 | 1,680 (0%) | 19mo | $285,000 | $170 | 74 |
| 1356 Court Leona Ct | 0.20mi | 4/2.0 | 1,680 (0%) | 19mo | $196,000 | $117 | 73 |
| 1117 Court B Ct | 0.11mi | 3/2.5 (-1) | 1,464 (-13%) | 10mo | $220,000 | $150 | 61 |
| 5536 Montibello Dr | 0.20mi | 3/2.5 (-1) | 1,488 (-11%) | 9mo | $281,000 | $189 | 59 |
| 5504 Court P | 0.26mi | 4/3.5 | 1,830 (+9%) | 19mo | $270,000 | $148 | 53 |
| 1345 Court Leona Dr | 0.18mi | 3/3.5 (-1) | 1,464 (-13%) | 14mo | $265,000 | $181 | 50 |
| 5648 Santa Cruz Dr | 0.17mi | 3/1.5 (-1) | 1,450 (-14%) | 19mo | $232,000 | $160 | 44 |
Match score weights: distance 35% · size 25% · config 20% · recency 20%. Top-matched comps best support the ARV.
Projected returns pro-forma
-3.0% appreciation · 3.0% rent growth · sell at horizon
- IRR
- -18.0%
- Equity multiple
- 0.37×
- Total profit
- $-51,562
- Equity at exit
- $43,240
- IRR
- -10.0%
- Equity multiple
- 0.38×
- Total profit
- $-50,061
- Equity at exit
- $25,074
Cash invested: $81,200 (down + closing). Projections, not guarantees.
Landlord ↔ Tenant lean methodology
- Overall (STATE)
- 43 Moderately Tenant-Leaning
- State Illinois
- 43 Moderately Tenant-Leaning · D+7
- County
- — inherits STATE
- City
- — inherits STATE
ZIP-level market 60133
- Active inventory
- 58
- Price-to-rent
- 8.4×
Monthly cashflow live
- Estimated rent
- $2,887 medium interval (Pro) →
- Mortgage (P&I)
- −$1,521
- Tax from tax record
- −$447 /mo · $5,363/yr
- Insurance
- −$121
- HOA
- −$268
- Vacancy / Maint / Mgmt
- −$606
- Net cashflow
- $-76
Break-even live
Sensitivity live
| Price | -10% $88 | -5% $6 | +0% $-76 | +5% $-158 | +10% $-240 |
|---|---|---|---|---|---|
| Rent | -10% $-304 | -5% $-190 | +0% $-76 | +5% $38 | +10% $152 |
| Rate | -1.0pp $70 | -0.5pp $-2 | base $-76 | +0.5pp $-151 | +1.0pp $-227 |
UW: 25.0% down · 7.5% · 30yr · 1.5% tax · 5.0% vac · 8.0% maint · 8.0% mgmt
Financing live
Cash to close
- Down payment
- $72,500
- Closing costs
- $8,700
- Reserves months
- —
- Total cash needed
- —
Loan-product check · same deal, 3 products live
Conventional
25% down · 7.5% · 30yr
- Down + closing
- —
- Monthly P&I
- —
- Monthly cashflow
- —
- DSCR
- —
- Eligible?
- —
Personal DTI + credit; lowest rate.
DSCR
20% down · 8.5% · 30yr
- Down + closing
- —
- Monthly P&I
- —
- Monthly cashflow
- —
- DSCR
- —
- Eligible?
- —
No personal income docs; deal must DSCR.
Hard money
10% down · 12.0% · 12mo
- Down + closing
- —
- Monthly P&I
- —
- Monthly cashflow
- —
- DSCR
- —
- Eligible?
- —
Short-term bridge; refi at stabilization.
Rent comps 4 comps
| Address | Beds | Baths | Sqft | Rent | $/sqft | DOM | Units | Dist |
|---|---|---|---|---|---|---|---|---|
| 5850 Fresno Ct Unit C Hanover Park, IL | 3.0 | 2.0 | 1062 | $2,500 | $2.35 | 0d | 1 | 0.51mi |
| 5546 W Celebrity Cir Hanover Park, IL | 3.0 | 2.0 | 1336 | $2,850 | $2.13 | 4d | 1 | 0.70mi |
| 6334 Nugget Cir Hanover Park, IL | 3.0 | 2.5 | 1336 | $2,300 | $1.72 | 26d | 1 | 1.13mi |
| 348 Glenwood Dr Bloomingdale, IL | 1.0–3.0 | 1.0–2.0 | 977 | $2,757 | $2.82 | 0d | 31 | 1.40mi |
HOA detail
- Monthly dues
- $268 · $3,216/yr
Listing history 11 events
-
2026-06-21days on market $290,000 Active 16 DOM
-
2026-06-18days on market $290,000 Active 13 DOM
-
2026-06-17days on market $290,000 Active 12 DOM
-
2026-06-16days on market $290,000 Active 11 DOM
-
2026-06-15days on market $290,000 Active 10 DOM
-
2026-06-13days on market $290,000 Active 8 DOM
-
2026-06-13days on market $290,000 Active 7 DOM
-
2026-06-09days on market $290,000 Active 4 DOM
-
2026-06-08days on market $290,000 Active 3 DOM
-
2026-06-07remarks 182-char remark
-
2026-06-07$290,000 Active 2 DOM
ⓘ Source: listings_history table (triggers on properties + properties_extension) + one-shot
backfill from property_details.listing_events for pre-trigger history.
Tax reassessment forecast IL · Partial reset (capped growth)
- Current annual tax
- $5,363 · $447/mo
- Projected year-2 tax
- $5,973 · $498/mo
- Expected delta
- +$610/yr (+$51/mo · 11.4%)
ⓘ Screening estimate from a state-policy table — verify with the county assessor before closing.
Climate risk First Street
- Flood 1/10 Low FEMA zone X (unshaded) · 0% chance over 30 yrs
- Wildfire 1/10 Low
- Heat 3/10 Moderate 7 d/yr ≥102°F today · 14 d/yr by 30 yrs out
- Wind 2/10 Low 0% chance of damaging wind over 30 yrs
- Air quality 3/10 Moderate 3 unhealthy d/yr today · 3 by 30 yrs out
Nearby sold comps map
Loading sold comps map…
Walkable amenities ~0.75 mi
Loading nearby amenities…
Taxation est. · year 1
- Rental income
- $34,644
- − Mortgage interest
- −$16,245
- − Property taxes
- −$5,363
- − Insurance
- −$1,450
- − Repairs & maintenance
- −$2,772
- − Management
- −$2,772
- − HOA
- −$3,216
- − Depreciation
- −$8,436
- Taxable loss
- −$5,609
- Est. tax savings @ 24.0%
- +$1,346
- After-tax cash flow
- $436/yr
For passive investors: Depreciation is non-cash, so a rental often shows a tax loss while cash-flowing — sheltering income. Rental losses are passive: they offset passive income freely, and up to $25,000/yr can offset ordinary (W-2) income if you actively participate and your MAGI is under $100k (phasing out to $0 by $150k); unused losses carry forward. On sale, claimed depreciation is recaptured at up to 25%, and gains may owe capital-gains tax (a 1031 exchange can defer both). Figures are a year-1 estimate at your 24.0% rate — not tax advice; consult a CPA.
Schools (NCES district)
- District
- Lake Park Chsd 108
- NCES district ID
- 1721840
- Math proficiency
- 37% ▼ -16.00%
- Reading proficiency
- 43% ▼ -6.00%
- Median HH income
- $69,790
- Composite
- 36.37/100
- National rank
- #4684
- State rank
- #128 of 620 in IL
Livability — Hanover Park
- Score
- 78/100
- State rank
- #150
- US rank
- #2740
Category grades
Schools grade is shown separately in the Schools card above.
Census & demographics
- Census place
- Hanover Park, IL
- County
- DuPage County · 904,569 people
- City population
- 36,732
- Metro
- Chicago-Naperville-Elgin, IL-IN-WI
- Population (ZIP)
- 36,732
- Household income
- $91,763
- Rent vs Own
- Severe rent burden
- 634.0
Population outlook (DuPage County) Hauer SSP2
- Today (2025)
- 960,187 people
- By 2030
- 965,850 · +0.6%
- By 2040
- 965,812 · +0.6%
- By 2050
- 954,890 · -0.6%
- By 2075
- 910,185 · -5.2%
- By 2100
- 816,255 · -15.0%
Race, ethnicity, and origin ACS 2023
- Neighborhood character
- Highly diverse neighborhood (Simpson 0.71)
- Race & ethnicity
- Hispanic / Latino 39% White 31% Two or more races 20% Asian 19% Black 8%
- Hispanic origin (detail)
- Mexican 28% Puerto Rican 3%
- Common ancestry
- Romanian 6% Lithuanian 2% Italian 1%
- Foreign-born
- 35% · Canada, Jamaica, China
- Languages at home
- 45% English-only · Spanish 33% Other Indo-European 13% Russian/Polish/Slavic 2%
Political lean MEDSL · DuPage
- 2024 margin
- D (+13.3) · D 55.9% · R 42.5% · Other 1.6%
- 2008→2024 swing
- +2.5pp toward D · 2008: 10.8pp · 2024: 13.3pp
- All cycles
- 2024: D+13.3 2020: D+18.1 2016: D+14.1 2012: D+1.0 2008: D+10.8
Not yet ingested
- Civics
- —
Market trends
- HPI YoY
- ▼ -252.78%
- Current HPI
- 254.6863
- Rent YoY
- —
- Metro
- Chicago-Naperville-Elgin, IL-IN-WI
- State GDP YoY
- ▲ 1.59%
- F500 in state
- 60
Industry mix (Fortune 500 HQ in IL)
| Industry | F500 HQs | Revenue |
|---|---|---|
| Insurance | 4 | $201B |
|
||
| Consumer Goods | 4 | $87B |
|
||
| Industrial Machinery | 3 | $64B |
|
||
| Healthcare | 2 | $55B |
|
||
| Retail / Pharmacy | 1 | $148B |
|
||
| Agriculture / Food | 1 | $86B |
|
||
Price history
+339.4% since first listed4 events — show timeline
- 2026-06-05 Listed $290,000 MRED as Distributed by MLS Grid
- 2006-07-21 Sold (Public Records) $175,000 Public Records
- 2001-01-31 Sold (Public Records) $118,000 Public Records
- 1989-10-04 Sold (Public Records) $66,000 Public Records
Property tax history
+2.1%/yrLatest (2024): $5,363 · +5.7% YoY. Source: county tax records.
Cash-flow waterfall
monthlySold comps — $/sqft
last 12 mo · ≤1 miLoading sold comps…