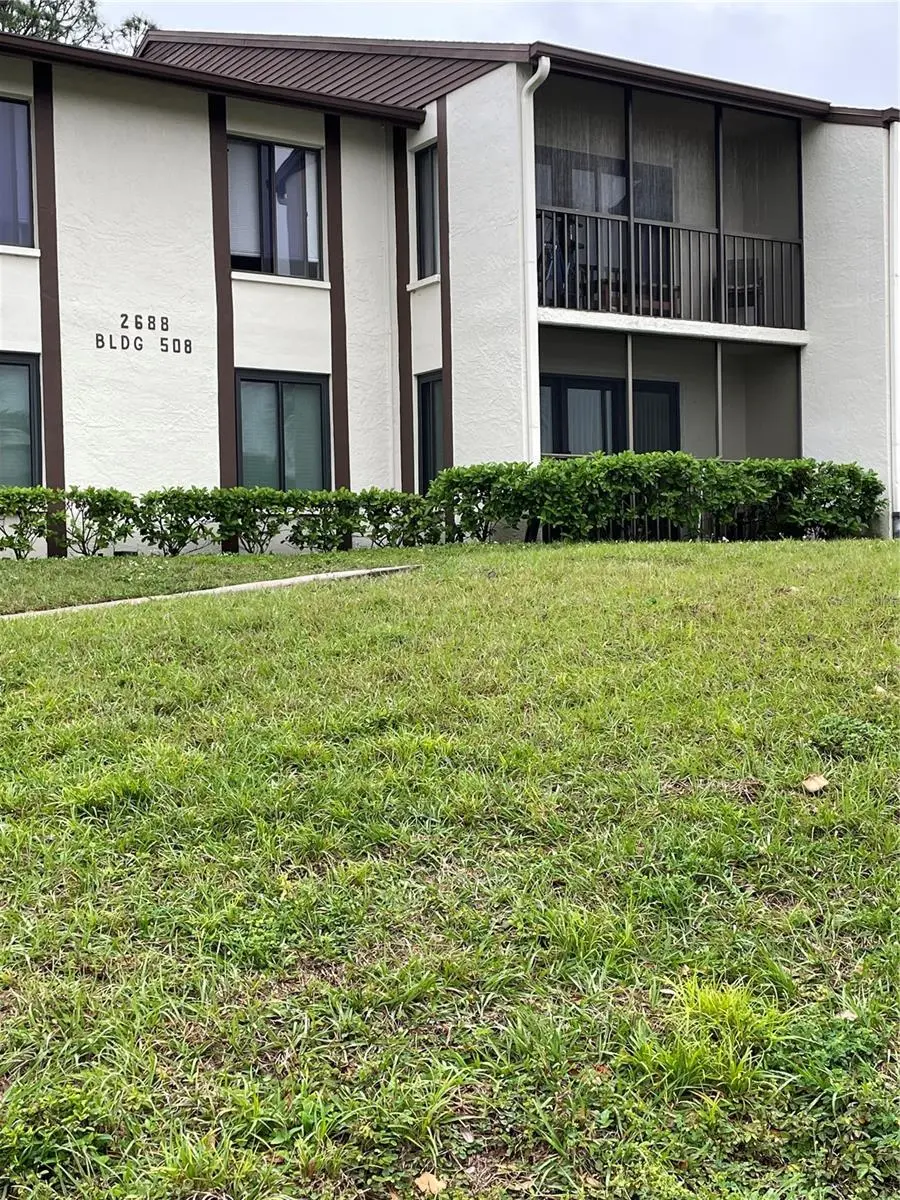
2688 Pine Ridge Way N Unit D2 · Palm Harbor, FL
Flood risk 1/10 · Minimal
- FEMA flood zone
- X (unshaded)
- Chance of flooding over 30 yrs
- 0.0%
- Est. flood insurance / yr
- $507 – $1,088
Fire risk 1/10 · Minimal
- Est. fire insurance / yr
- $947 – $1,759
Heat risk 10/10 · Severe
- Hot days now (above 108°F)
- 7 days/yr
- Hot days in 30 yrs
- 27 days/yr
Wind risk 10/10 · Severe
- Chance of severe wind over 30 yrs
- 99.0%
Air-quality risk 3/10 · Minor
- Unhealthy air days now
- 2 days/yr
- Unhealthy air days in 30 yrs
- 2 days/yr
Risk factors via First Street. Map © Google.
Why this score? — see what drove the D grade
The composite is a weighted blend of 9 inputs, each scored 0–100. Each bar is that input's sub-score; the figure is the points it added to the 100-point composite (weight × sub-score).
- Cash flow +12.6/30.0
- ARV discount +7.5/15.0
- 1% rule +6.9/10.0
- Schools +4.3/10.0
- Livability +4.0/5.0
- DSCR +3.8/10.0
- Condition / age +2.5/5.0
- Rent growth +1.2/5.0
- Appreciation +0.0/10.0
$169,500
🖨 Deal sheet (PDF) 📄 Offer letter ✓ Due diligence
Listing remarks
Come see this beautifully maintained 2 bedroom, 2 bathroom, fully furnished (optional) second floor condo in desirable Pine Ridge in Palm Harbor. This unit boasts an open concept with plenty of natural light in the spacious living room connecting to the north facing lanai for morning coffee or evening relaxing. The primary bedroom has an en-suite bathroom and walk-in closet for convenience and privacy. The second bedroom has several possibilities as a bedroom, hobby space, or maybe an office. This home also has a full laundry room. The location is close to the pool, spa, shuffleboard courts and clubhouse, or take a walk on the trail. Pine Ridge is close to shopping, dining and the Gulf coas
Key facts
- Walk-in closet
- Corner unit
- En-suite bathroom
Tags
Property features AI
Finance
- Other: Senior community; Association contact: Susan Aller
- Financial info: Total monthly association fees $421.78; total annual fees $5,061.36; Lease restrictions apply
- HOA & community: Monthly HOA fee of $421.78; HOA fee includes cable TV, internet, common area taxes, pool, escrow reserves, maintenance (structure & grounds), management, private road, recreational facilities, sewer, trash, and water; Association-owned recreation, clubhouse, pool, shuffleboard court, spa/hot tub, street lights; Buyer approval required for association; Association approval required; Pets allowed (dogs and cats) with limits; max pet weight 25 lbs
Exterior
- Parking: Private maintained road access
- Utilities: Public water; Public sewer; Electricity connected; Cable connected; High-speed internet / broadband available; Sewer connected; Water connected
- Home design: Condominium; Residential property; One story; Facing north; Unit on floor 1 (upstairs unit described in directions)
- Construction: Block and stucco construction; Shingle roof; Slab foundation; Built with building number 508
- Exterior features: Balcony; Exterior lighting; Sliding doors
Interior
- Kitchen: Dishwasher; Range; Range hood; Refrigerator; Electric water heater
- Bedrooms: 2 bedrooms
- Flooring: Ceramic tile
- Bathrooms: 2 full bathrooms
- Heating & cooling: Central heating (electric); Central air conditioning
- Interior features: Eat-in kitchen; Living room/dining room combo; Thermostat; Window treatments
- Laundry & utility: Laundry room; Washer; Dryer
Neighborhood map
What this means for you Summary
Snapshot
- This is a 2-bed/2.0-bath condo listed at $170k.
Deal economics
- At list price, monthly cash flow is $-21 ($-257/yr) — negative.
- To cash-flow at today's rent, offer at most $166k (2.2% below list).
- Meets the 1% rule at list price ($2k rent vs $170k).
- Recommended offer: $159k (6.0% below list) — sets the bar for market timing.
- Cap rate 6.1% vs local median 3.1% in Palm Harbor — top-decile yield for the area; either an underpriced asset or a hidden risk that comps aren't pricing in. Stress-test before assuming the spread holds.
Location & tenants
- Location reads 81/100 on livability (#95 in FL, #1,470 nationally) — a professional / high-income tenant draw. Strengths: housing A+, commute A, crime A-; Watch: amenities F.
- Pinellas (suburban): math 51% / reading 51% proficiency, ranked #31 of 73 in FL (top 42%) — acceptable for families but not a draw, mixed tenant base, ~2y average lease.
- Zoned schools: Highland Lakes Elementary School (math 67% / reading 65%, grade B+, #492 of 2,144 statewide, top 23%, 529 students, 44% FRL); Joseph L. Carwise Middle School (math 66% / reading 57%, grade B+, #124 of 571 statewide, top 22%, 1,098 students, 38% FRL); Palm Harbor University High (math 54% / reading 72%, grade B-, #89 of 667 statewide, top 14%, 2,474 students, 26% FRL).
- Zoned-school proficiency averages 64% at this address vs 51% district-wide (+12 pts) — the actual schools serving this property are materially stronger than the Pinellas average implies; a family-tenant draw the district grade alone would hide.
- Market conditions: Rents falling (-5.2%/yr); 378 active listings in the ZIP; 38 comparable units currently listed for rent nearby; rentals at typical pace (median 14d on market — plan ~3-4 weeks tenant-placement turnaround); 2,676 units permitted in Pinellas County in 2024 (1,422 in 5+ unit buildings).
Forward outlook
- Local home prices are declining (-3.0%/yr); year-one equity from $1k of loan paydown is wiped out by about $5k of value loss. Plan a longer hold.
- Pinellas County population projected at +14% by 2050 — modest demand growth; plan on rents tracking national, not racing it.
Negotiation context
- It's been on market 80 days — a 6% lower offer ($159k) is reasonable based on typical stale-listing flexibility.
- 2 sale attempts; this cycle's ask has dropped $14k (8%) from the opening price — seller is motivated, your offer sets the floor, not the list.
- Current owner paid $52k; list at $170k implies a 229% gain — meaningful room to come down on a strong offer.
Risks & watch-outs
- Watch-outs: HOA is 21% of rent.
- Climate carrying-cost: severe wind risk, 99% chance of damaging wind over 30y; extreme-heat days projected 7→27/yr by 2055 (HVAC capex compounding) — expect insurance premiums to compound above CPI over the hold.
Questions for the listing agent
- What do current leases actually rent for vs. the listed asking? Can we see a recent rent roll and the last 12 months of T-12 income?
- It's been on market 80 days. Have you received any prior offers? Is the seller open to a 6% concession, seller financing, or rate buy-down credit?
- What does the HOA fee cover, when was the last increase, and are there any pending special assessments or reserve-fund shortfalls?
- Any open or pending special assessments — roof, HVAC, plumbing, elevator, façade? What's the per-unit balance and payoff schedule, and is the seller paying it off at close or rolling it to the buyer?
- Why hasn't it sold? Are there any deal-killer items the seller is aware of (foundation, flood, title, zoning, code violations)?
- Is there a deadline driving the sale (1031 exchange, divorce, estate, relocation)? That informs how much negotiation room exists.
- Schools are A-rated — typically a magnet for longer-tenancy family renters. What's the average tenant stay here, and is there a school-zone premium baked into asking?
- The area grade is low — what's the realistic commute time and amenity access for the typical tenant pool here? Any planned neighborhood developments (good or bad) we should know about?
- What's the average days-on-market for RENTAL listings here right now (not sales)? A rising rental-DOM trend means longer vacancies and softer asking-rent achievability than the comps imply.
- What's the recent tenant-quality profile in this submarket — average credit score on applications, eviction rate, late-payment / NSF rate, and stable-employment percentage? A property-management company in the area should have these aggregated.
- How much new apartment / multifamily construction is in the pipeline within 1–3 miles? Heavy new supply (>2% of stock underway) typically softens rents 12–24 months out; light construction supports rent growth.
Investment metrics
- 1% rule
- 1.19% ✓
- Cap rate
- 6.14%
- Cash-on-cash
- -0.54%
- DSCR
- 0.98
- GRM
- 7.0
CMA / ARV
No comps found within radius.
Projected returns pro-forma
-3.0% appreciation · 0.0% rent growth · sell at horizon
- IRR
- -21.8%
- Equity multiple
- 0.27×
- Total profit
- $-34,424
- Equity at exit
- $25,273
- IRR
- -31.1%
- Equity multiple
- -0.12×
- Total profit
- $-53,292
- Equity at exit
- $14,655
Cash invested: $47,460 (down + closing). Projections, not guarantees.
Landlord ↔ Tenant lean methodology
- Overall (STATE)
- 87 Strongly Landlord-Friendly
- State Florida
- 87 Strongly Landlord-Friendly · R+3
- County
- — inherits STATE
- City
- — inherits STATE
ZIP-level market 34684
- Rents YoY
- -5.2%
- Active inventory
- 378
- Price-to-rent
- 7.0×
Monthly cashflow live
- Estimated rent
- $2,011 high interval (Pro) →
- Mortgage (P&I)
- −$889
- Tax from tax record
- −$230 /mo · $2,759/yr
- Insurance
- −$71
- HOA
- −$421
- Vacancy / Maint / Mgmt
- −$422
- Net cashflow
- $-21
Break-even live
Sensitivity live
| Price | -10% $75 | -5% $27 | +0% $-21 | +5% $-69 | +10% $-117 |
|---|---|---|---|---|---|
| Rent | -10% $-180 | -5% $-101 | +0% $-21 | +5% $58 | +10% $137 |
| Rate | -1.0pp $64 | -0.5pp $22 | base $-21 | +0.5pp $-65 | +1.0pp $-110 |
UW: 25.0% down · 7.5% · 30yr · 1.5% tax · 5.0% vac · 8.0% maint · 8.0% mgmt
Financing live
Cash to close
- Down payment
- $42,375
- Closing costs
- $5,085
- Reserves months
- —
- Total cash needed
- —
Loan-product check · same deal, 3 products live
Conventional
25% down · 7.5% · 30yr
- Down + closing
- —
- Monthly P&I
- —
- Monthly cashflow
- —
- DSCR
- —
- Eligible?
- —
Personal DTI + credit; lowest rate.
DSCR
20% down · 8.5% · 30yr
- Down + closing
- —
- Monthly P&I
- —
- Monthly cashflow
- —
- DSCR
- —
- Eligible?
- —
No personal income docs; deal must DSCR.
Hard money
10% down · 12.0% · 12mo
- Down + closing
- —
- Monthly P&I
- —
- Monthly cashflow
- —
- DSCR
- —
- Eligible?
- —
Short-term bridge; refi at stabilization.
Rent comps 38 comps
| Address | Beds | Baths | Sqft | Rent | $/sqft | DOM | Units | Dist |
|---|---|---|---|---|---|---|---|---|
| 144 Stafford Cir Palm Harbor, FL | 2.0 | 2.0 | 1264 | $2,295 | $1.82 | 6d | 1 | 0.10mi |
| 2575 Pine Ridge Way S Unit A2 Palm Harbor, FL | 2.0 | 2.0 | 1104 | $1,590 | $1.44 | 26d | 1 | 0.15mi |
| 2523 Pine Ridge Way S Unit C2 Palm Harbor, FL | 2.0 | 2.0 | 1038 | $1,650 | $1.59 | 0d | 1 | 0.18mi |
| 1624 Heather Pl Palm Harbor, FL | 2.0 | 2.0 | 1248 | $2,295 | $1.84 | 26d | 1 | 0.31mi |
| 1801 E Orangeside Rd Palm Harbor, FL | 3.0 | 2.0 | 1369 | $2,575 | $1.88 | 26d | 1 | 0.32mi |
| 1691 E Orangecrest Ave Palm Harbor, FL | 2.0 | 2.0 | 1193 | $2,600 | $2.18 | 18d | 1 | 0.37mi |
| 2481 Malcolm Dr Palm Harbor, FL | 2.0 | 2.0 | 1319 | $2,600 | $1.97 | 19d | 1 | 0.42mi |
| 2833 Orange Tree Cir N Unit C Palm Harbor, FL | 2.0 | 2.0 | 960 | $1,845 | $1.92 | 26d | 1 | 0.46mi |
| 2700 Nebraska Ave Unit 4-106 Palm Harbor, FL | 1.0 | 1.0 | 730 | $1,400 | $1.92 | 26d | 1 | 0.54mi |
| 2334 Citrus Hill Rd Palm Harbor, FL | 2.0 | 2.0 | 1189 | $2,350 | $1.98 | 6d | 1 | 0.61mi |
| 3266 Haviland Ct Palm Harbor, FL | 3.0 | 2.0 | 1210 | $1,895 | $1.57 | 26d | 1 | 0.64mi |
| 2914 Cypress Green Dr Palm Harbor, FL | 3.0 | 2.0 | 1245 | $2,600 | $2.09 | 21d | 1 | 0.81mi |
| 2690 Coral Landings Blvd Palm Harbor, FL | 2.0–3.0 | 2.0 | 1135 | $1,700 | $1.50 | 14d | 2 | 0.85mi |
| 2945 Grovewood Blvd Unit A Palm Harbor, FL | 2.0 | 2.0 | 1030 | $1,775 | $1.72 | 19d | 1 | 0.93mi |
| 35820 U.S. 19 Unit B1 Palm Harbor, FL | 2.0 | 2.0 | 1116 | $2,245 | $2.01 | 6d | 1 | 0.96mi |
| 35820 U.S. 19 Unit C1 Palm Harbor, FL | 3.0 | 2.0 | 1404 | $2,781 | $1.98 | 6d | 1 | 0.96mi |
| 35820 U.S. 19 Unit A2 Palm Harbor, FL | 1.0 | 1.0 | 740 | $1,884 | $2.55 | 6d | 1 | 0.96mi |
| 899 Cleland Ct Palm Harbor, FL | 2.0 | 2.0 | 1230 | $1,695 | $1.38 | 0d | 1 | 0.97mi |
| 2690 Coral Landings Blvd #415 Palm Harbor, FL | 3.0 | 2.0 | 1351 | $2,000 | $1.48 | 21d | 1 | 0.98mi |
| 3023 Beecher Dr E Unit D Palm Harbor, FL | 3.0 | 2.5 | 1425 | $2,400 | $1.68 | 19d | 1 | 0.98mi |
| 2130 Bancroft Pl Unit E Palm Harbor, FL | 2.0 | 2.0 | 1030 | $1,850 | $1.80 | 5d | 1 | 1.01mi |
| 2130 Bancroft Pl Unit E Palm Harbor, FL | 2.0 | 2.0 | 1030 | $1,860 | $1.81 | 9d | 1 | 1.01mi |
| 3121 Beecher Dr E Unit A Palm Harbor, FL | 2.0 | 2.0 | 976 | $2,100 | $2.15 | 9d | 1 | 1.01mi |
| 248 St Ives Dr #248 Palm Harbor, FL | 3.0 | 2.0 | 1350 | $2,300 | $1.70 | 6d | 1 | 1.11mi |
| 36090 US Highway 19 N Palm Harbor, FL | 1.0–3.0 | 1.0–2.0 | 1046 | $2,534 | $2.42 | 0d | 65 | 1.11mi |
| 3277 Fox Chase Cir N #211 Palm Harbor, FL | 2.0 | 2.0 | 825 | $1,495 | $1.81 | 26d | 1 | 1.11mi |
| 3300 Fox Chase Cir N Palm Harbor, FL | 2.0 | 2.0 | 906 | $2,625 | $2.90 | 0d | 2 | 1.12mi |
| 245 Lake Tarpon Dr Palm Harbor, FL | 2.0 | 2.0 | 1000 | $1,995 | $2.00 | 0d | 1 | 1.12mi |
| 245 Lake Tarpon Dr Palm Harbor, FL | 2.0 | 2.0 | 1000 | $1,995 | $2.00 | 4d | 1 | 1.12mi |
| 47 Delaware Ct #10 Palm Harbor, FL | 2.0 | 2.0 | 1008 | $1,800 | $1.79 | 22d | 1 | 1.22mi |
| 274 Beach Ct #42 Palm Harbor, FL | 2.0 | 2.0 | 1056 | $1,600 | $1.52 | 26d | 1 | 1.28mi |
| 4000 Poinciana Ct Palm Harbor, FL | 3.0 | 2.0 | 1298 | $2,600 | $2.00 | 5d | 1 | 1.29mi |
| 3462 Maclaren Dr Palm Harbor, FL | 2.0 | 2.0 | 1076 | $2,150 | $2.00 | 9d | 1 | 1.32mi |
| 21 Lake Shore Dr Palm Harbor, FL | 3.0 | 2.0 | 1434 | $2,895 | $2.02 | 6d | 1 | 1.34mi |
| 65 Lake Shore Dr Palm Harbor, FL | 2.0 | 1.0 | 868 | $1,700 | $1.96 | 19d | 1 | 1.37mi |
| 72 Lake Shore Dr Palm Harbor, FL | 3.0 | 2.0 | 1100 | $1,800 | $1.64 | 19d | 1 | 1.38mi |
| 218 Maple Ave Palm Harbor, FL | 3.0 | 2.0 | 1374 | $2,600 | $1.89 | 19d | 1 | 1.40mi |
| 2400 Clubside Ct Palm Harbor, FL | 1.0–3.0 | 1.0–2.0 | 1129 | $1,928 | $1.71 | 0d | 37 | 1.48mi |
HOA detail condo
- Monthly dues
- $421 · $5,052/yr
- Likely covers
- pool
- Assessments
- None detected in remarks — confirm with the listing agent.
Listing history 19 events
-
2026-06-22days on market $169,500 Active 80 DOM
-
2026-06-19price $169,500 Active 77 DOM
-
2026-06-18days on market $183,900 Active 77 DOM
-
2026-06-17days on market $183,900 Active 76 DOM
-
2026-06-16days on market $183,900 Active 75 DOM
-
2026-06-15days on market $183,900 Active 74 DOM
-
2026-06-13days on market $183,900 Active 72 DOM
-
2026-06-09days on market $183,900 Active 68 DOM
-
2026-06-08days on market $183,900 Active 67 DOM
-
2026-06-07days on market $183,900 Active 66 DOM
-
2026-06-04days on market $183,900 Active 63 DOM
-
2026-06-03days on market $183,900 Active 62 DOM
-
2026-06-01days on market $183,900 Active 60 DOM
-
2026-05-31days on market $183,900 Active 59 DOM
-
2026-04-02$183,900 Active
-
2025-06-10historical
-
2025-03-07$194,900 Active
-
1997-05-20soldstatus $51,500
-
1983-09-01soldstatus $48,500
ⓘ Source: listings_history table (triggers on properties + properties_extension) + one-shot
backfill from property_details.listing_events for pre-trigger history.
Tax reassessment forecast FL · Resets to sale price
- Current annual tax
- $2,759 · $230/mo
- Projected year-2 tax
- $2,759 · $230/mo
- Expected delta
- $0/yr ($0/mo · 0.0%)
ⓘ Screening estimate from a state-policy table — verify with the county assessor before closing.
Climate risk First Street
- Flood 1/10 Low FEMA zone X (unshaded) · 0% chance over 30 yrs
- Wildfire 1/10 Low
- Heat 10/10 Extreme 7 d/yr ≥108°F today · 27 d/yr by 30 yrs out
- Wind 10/10 Extreme 99% chance of damaging wind over 30 yrs
- Air quality 3/10 Moderate 2 unhealthy d/yr today · 2 by 30 yrs out
Nearby sold comps map
Loading sold comps map…
Walkable amenities ~0.75 mi
Loading nearby amenities…
Taxation est. · year 1
- Rental income
- $24,137
- − Mortgage interest
- −$9,495
- − Property taxes
- −$2,759
- − Insurance
- −$848
- − Repairs & maintenance
- −$1,931
- − Management
- −$1,931
- − HOA
- −$5,052
- − Depreciation
- −$4,931
- Taxable loss
- −$2,809
- Est. tax savings @ 24.0%
- +$674
- After-tax cash flow
- $417/yr
For passive investors: Depreciation is non-cash, so a rental often shows a tax loss while cash-flowing — sheltering income. Rental losses are passive: they offset passive income freely, and up to $25,000/yr can offset ordinary (W-2) income if you actively participate and your MAGI is under $100k (phasing out to $0 by $150k); unused losses carry forward. On sale, claimed depreciation is recaptured at up to 25%, and gains may owe capital-gains tax (a 1031 exchange can defer both). Figures are a year-1 estimate at your 24.0% rate — not tax advice; consult a CPA.
Schools (NCES district)
- District
- Pinellas
- NCES district ID
- 1201560
- Math proficiency
- 51% ▼ -5.00%
- Reading proficiency
- 51% ▼ -3.00%
- Median HH income
- $46,270
- Composite
- 43.27/100
- National rank
- #3046
- State rank
- #31 of 73 in FL
Livability — Palm Harbor
- Score
- 81/100
- State rank
- #95
- US rank
- #1470
Category grades
Schools grade is shown separately in the Schools card above.
Census & demographics
- Census place
- Palm Harbor, FL
- County
- Pinellas County · 939,478 people
- City population
- 79,072
- Metro
- Tampa-St. Petersburg-Clearwater, FL
- Population (ZIP)
- 27,029
- Household income
- $72,145
- Rent vs Own
- Severe rent burden
- 1495.0
Population outlook (Pinellas County) Hauer SSP2
- Today (2025)
- 1,027,532 people
- By 2030
- 1,063,586 · +3.5%
- By 2040
- 1,125,020 · +9.5%
- By 2050
- 1,168,637 · +13.7%
- By 2075
- 1,265,188 · +23.1%
- By 2100
- 1,260,357 · +22.7%
Race, ethnicity, and origin ACS 2023
- Neighborhood character
- Predominantly White (81%)
- Race & ethnicity
- White 81% Hispanic / Latino 10% Two or more races 8% Asian 4% Black 3%
- Hispanic origin (detail)
- Puerto Rican 2% Cuban 2%
- Common ancestry
- Lithuanian 5% Romanian 5% Scotch-Irish 3%
- Foreign-born
- 13% · Canada, Jamaica, China
- Languages at home
- 84% English-only · Spanish 6% Russian/Polish/Slavic 3% Other Indo-European 2%
Political lean MEDSL · Pinellas
- 2024 margin
- Lean R (+5.2) · D 46.9% · R 52.1%
- 2008→2024 swing
- -13.5pp toward R · 2008: 8.3pp · 2024: -5.2pp
- All cycles
- 2024: R+5.2 2020: D+0.2 2016: R+1.1 2012: D+5.6 2008: D+8.3
Not yet ingested
- Civics
- —
Market trends
- HPI YoY
- ▼ -296.23%
- Current HPI
- 301.651
- Rent YoY
- ▼ -5.17%
- Metro
- Tampa-St. Petersburg-Clearwater, FL
- State GDP YoY
- ▲ 3.28%
- F500 in state
- 36
Industry mix (Fortune 500 HQ in FL)
| Industry | F500 HQs | Revenue |
|---|---|---|
| Industrial Technology | 2 | $29B |
|
||
| Insurance | 2 | $17B |
|
||
| Retail | 1 | $60B |
|
||
| Technology Distribution | 1 | $58B |
|
||
| Homebuilding | 1 | $35B |
|
||
| Technology Manufacturing | 1 | $35B |
|
||
Price history
+279.2% since first listed5 events — show timeline
- 2026-04-02 Listed $183,900 Stellar MLS as Distributed by MLS Grid
- 2025-06-10 Listing Removed — Stellar MLS as Distributed by MLS Grid
- 2025-03-07 Listed $194,900 Stellar MLS as Distributed by MLS Grid
- 1997-05-20 Sold (Public Records) $51,500 Public Records
- 1983-09-01 Sold (Public Records) $48,500 Public Records
Property tax history
+6.2%/yrLatest (2025): $2,759 · +8.2% YoY. Source: county tax records.
Cash-flow waterfall
monthlySold comps — $/sqft
last 12 mo · ≤1 miLoading sold comps…