21291 W Wind Spirit Ln · Congress, AZ
Flood risk 1/10 · Minimal
- FEMA flood zone
- X (unshaded)
- Chance of flooding over 30 yrs
- 0.0%
- Est. flood insurance / yr
- $507 – $1,088
Fire risk 4/10 · Minor
- Est. fire insurance / yr
- $610 – $1,132
Heat risk 7/10 · Major
- Hot days now (above 107°F)
- 6 days/yr
- Hot days in 30 yrs
- 15 days/yr
Wind risk 1/10 · Minimal
- Chance of severe wind over 30 yrs
- —
Air-quality risk 1/10 · Minimal
- Unhealthy air days now
- 0 days/yr
- Unhealthy air days in 30 yrs
- 0 days/yr
Risk factors via First Street. Map © Google.
Why this score? — see what drove the C+ grade
The composite is a weighted blend of 9 inputs, each scored 0–100. Each bar is that input's sub-score; the figure is the points it added to the 100-point composite (weight × sub-score).
- Cash flow +20.9/30.0
- ARV discount +7.5/15.0
- Appreciation +6.9/10.0
- DSCR +6.6/10.0
- 1% rule +5.6/10.0
- Schools +5.0/10.0
- Livability +3.3/5.0
- Rent growth +2.5/5.0
- Condition / age +2.5/5.0
$97,000
🖨 Deal sheet 📄 Offer letter ✓ Due diligence
Listing remarks MLS
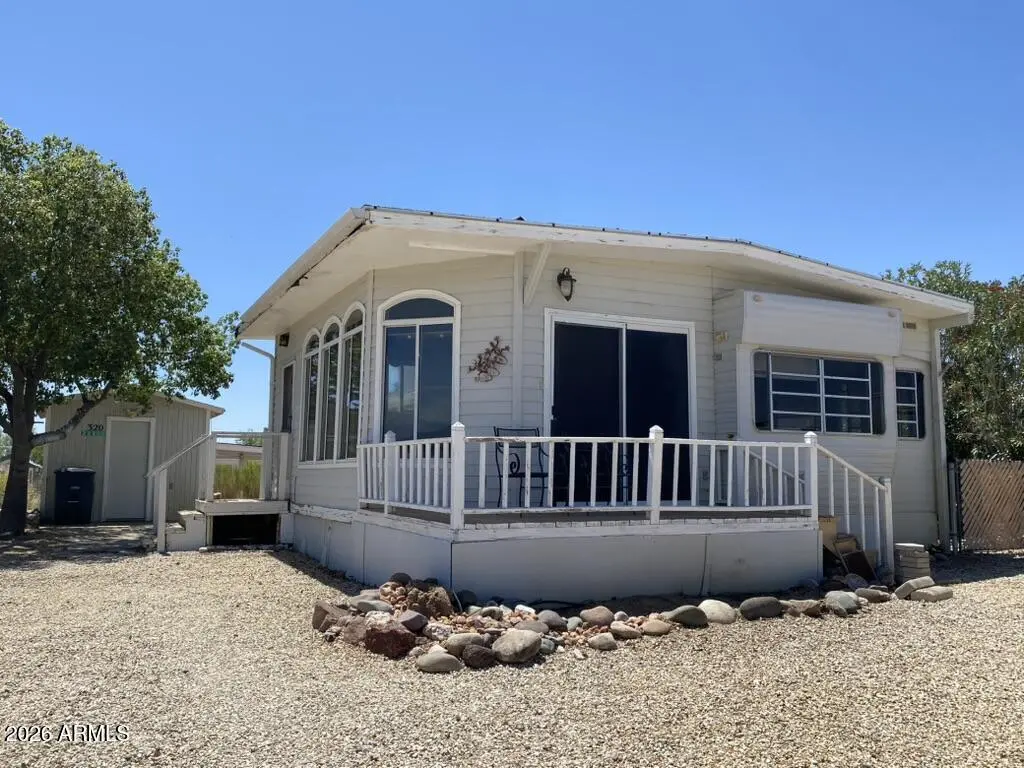
Needs a little TLC, but very livable. 1 br, 1 ba, 12x20 addition, has separate shed with work bench. 12x12 gazebo, what a place for the price, in Arizona.
Key facts
- 3,575 sq ft lot
- Built 1979
- Listed 29 days
Property features AI
Finance
- HOA & community: Has association; annual fee for grounds maintenance; Community features include pickleball courts and coin-op/community laundry
Exterior
- Utilities: Private sewer; Private water company
- Home design: Manufactured/mobile home; Fee simple ownership; Asphalt road access
- Construction: Aluminum siding; Wood frame construction; Painted exterior; Composition roof
- Exterior features: Storage; Shed(s); Gravel/stone front and back; Private maintained road
Interior
- Kitchen: Laminate counters
- Bedrooms: Possible 1 bedroom
- Flooring: Laminate flooring
- Bathrooms: 1 full bathroom
- Heating & cooling: Propane heating; Evaporative cooling
- Interior features: High-speed internet available; 3/4 bath in master bedroom; Laminate counters
- Laundry & utility: No laundry in unit (none)
Neighborhood map
What this means for you Summary
Snapshot
- This is a 1-bed/1.0-bath manufactured listed at $97k.
Deal economics
- At list price, monthly cash flow is $135 ($2k/yr) — positive.
- The deal already cash-flows at list — no discount required.
- Meets the 1% rule at list price ($1k rent vs $97k).
- Recommended offer: $96k (1.5% below list) — sets the bar for market timing.
Location & tenants
- Location reads 66/100 on livability (#75 in AZ) — a middle-class / working-renter tenant base. Strengths: crime A+, cost of living A+, housing A+; Watch: employment D, amenities F, commute F.
- Congress Elementary District (4479) (rural): math 60% / reading 55% proficiency, ranked #91 of 501 in AZ (top 18%) — acceptable for families but not a draw, mixed tenant base, ~2y average lease.
- Zoned schools: Congress Elementary School (math 44% / reading 34%, grade F, #398 of 1,109 statewide, top 37%, 102 students, 74% FRL) — zoned schools average 74% FRL vs 59% district-wide (16 pts higher); higher-poverty schools than district average — tighter screening recommended.
- Zoned-school proficiency averages 40% at this address vs 58% district-wide (-18 pts) — the specific schools serving this property underperform the Congress Elementary District (4479) average; the district grade overstates school quality for this exact location.
- Market conditions: 110 active listings in the ZIP; 2,062 units permitted in Yavapai County in 2024 (98 in 5+ unit buildings).
Forward outlook
- In year one you build about $4k of equity ($671 loan paydown + $4k appreciation (3.8% local appreciation)).
- Yavapai County population projected at +10% by 2050 — modest demand growth; plan on rents tracking national, not racing it.
- At projected returns (3.8% appreciation + 3.0% rent growth), your $27k cash investment doubles in ~5 years — after that, you're playing with house money.
- By year 8, paydown + projected appreciation supports a ~$32k cash-out refi (75% LTV) — recoverable capital for the next deal without selling this one.
Negotiation context
- It's been on market 29 days — a 2% lower offer ($96k) is reasonable based on typical stale-listing flexibility.
- 2 sale attempts since 9y ago with the ask held roughly flat each time — persistent listings suggest the price (not the market) is what's stuck; bring a comps-based counter.
- Current owner paid $32k; list at $97k implies a 198% gain — meaningful room to come down on a strong offer.
Risks & watch-outs
- Climate carrying-cost: extreme-heat days projected 6→15/yr by 2055 (HVAC capex compounding) — expect insurance premiums to compound above CPI over the hold.
Questions for the listing agent
- Built in 1979 — when were the roof, HVAC, electrical panel, plumbing, and water heater last replaced?
- What does the HOA fee cover, when was the last increase, and are there any pending special assessments or reserve-fund shortfalls?
- Is there a deadline driving the sale (1031 exchange, divorce, estate, relocation)? That informs how much negotiation room exists.
- Schools are B-rated — typically a magnet for longer-tenancy family renters. What's the average tenant stay here, and is there a school-zone premium baked into asking?
- What's the average days-on-market for RENTAL listings here right now (not sales)? A rising rental-DOM trend means longer vacancies and softer asking-rent achievability than the comps imply.
- What's the recent tenant-quality profile in this submarket — average credit score on applications, eviction rate, late-payment / NSF rate, and stable-employment percentage? A property-management company in the area should have these aggregated.
- How much new for-sale + rental construction is in the pipeline within 1–3 miles? Heavy new supply typically softens prices + rents 12–24 months out; constrained supply supports both.
Investment metrics
- 1% rule
- 1.06% ✓
- Cap rate
- 7.96%
- Cash-on-cash
- 5.94%
- DSCR
- 1.26
- GRM
- 7.8
CMA / ARV
No comps found within radius.
Projected returns pro-forma
3.77% appreciation · 3.0% rent growth · sell at horizon
- IRR
- 15.0%
- Equity multiple
- 1.89×
- Total profit
- $24,302
- Equity at exit
- $47,901
- IRR
- 16.2%
- Equity multiple
- 3.57×
- Total profit
- $69,727
- Equity at exit
- $77,342
Cash invested: $27,160 (down + closing). Projections, not guarantees.
Landlord ↔ Tenant lean methodology
- Overall (STATE)
- 87 Strongly Landlord-Friendly
- State Arizona
- 87 Strongly Landlord-Friendly · R+3
- County
- — inherits STATE
- City
- — inherits STATE
ZIP-level market 85332
- Home prices YoY
- 0.7%
- Active inventory
- 110
- Price-to-rent
- 7.8×
Monthly cashflow live
- Estimated rent
- $1,030 medium interval (Pro) →
- Mortgage (P&I)
- −$509
- Tax from tax record
- −$66 /mo · $798/yr
- Insurance
- −$40
- HOA
- −$64
- Vacancy / Maint / Mgmt
- −$216
- Net cashflow
- $135
Break-even live
UW: 25.0% down · 7.5% · 30yr · 1.5% tax · 5.0% vac · 8.0% maint · 8.0% mgmt
Financing live
Cash to close
- Down payment
- $24,250
- Closing costs
- $2,910
- Reserves months
- —
- Total cash needed
- —
Loan-product check · same deal, 3 products live
Conventional
25% down · 7.5% · 30yr
- Down + closing
- —
- Monthly P&I
- —
- Monthly cashflow
- —
- DSCR
- —
- Eligible?
- —
Personal DTI + credit; lowest rate.
DSCR
20% down · 8.5% · 30yr
- Down + closing
- —
- Monthly P&I
- —
- Monthly cashflow
- —
- DSCR
- —
- Eligible?
- —
No personal income docs; deal must DSCR.
Hard money
10% down · 12.0% · 12mo
- Down + closing
- —
- Monthly P&I
- —
- Monthly cashflow
- —
- DSCR
- —
- Eligible?
- —
Short-term bridge; refi at stabilization.
HOA detail
- Monthly dues
- $64 · $768/yr
Listing history 17 events
-
2026-06-18days on market $97,000 Active 29 DOM
-
2026-06-17days on market $97,000 Active 28 DOM
-
2026-06-16days on market $97,000 Active 27 DOM
-
2026-06-15days on market $97,000 Active 26 DOM
-
2026-06-13days on market $97,000 Active 24 DOM
-
2026-06-09days on market $97,000 Active 20 DOM
-
2026-06-08days on market $97,000 Active 19 DOM
-
2026-06-07days on market $97,000 Active 18 DOM
-
2026-06-04days on market $97,000 Active 15 DOM
-
2026-06-03days on market $97,000 Active 14 DOM
-
2026-06-02days on market $97,000 Active 13 DOM
-
2026-06-01days on market $97,000 Active 12 DOM
-
2026-05-31days on market $97,000 Active 11 DOM
-
2026-05-20$97,000 Active
-
2017-08-01soldstatus $32,500 154-char remark
Show marketing remark (154 chars)
Needs a little TLC, but very livable. 1 br, 1 ba, 12x20 addition, has separate shed with work bench. 12x12 gazebo, what a place for the price, in Arizona.
-
2017-02-24$38,000 154-char remark
Show marketing remark (154 chars)
Needs a little TLC, but very livable. 1 br, 1 ba, 12x20 addition, has separate shed with work bench. 12x12 gazebo, what a place for the price, in Arizona.
-
2000-02-09soldstatus $8,000
ⓘ Source: listings_history table (triggers on properties + properties_extension) + one-shot
backfill from property_details.listing_events for pre-trigger history.
Tax reassessment forecast AZ · Resets to sale price
- Current annual tax
- $798 · $66/mo
- Projected year-2 tax
- $798 · $66/mo
- Expected delta
- $0/yr ($0/mo · 0.0%)
ⓘ Screening estimate from a state-policy table — verify with the county assessor before closing.
Climate risk First Street
- Flood 1/10 Low FEMA zone X (unshaded) · 0% chance over 30 yrs
- Wildfire 4/10 Moderate
- Heat 7/10 Severe 6 d/yr ≥107°F today · 15 d/yr by 30 yrs out
- Wind 1/10 Low
- Air quality 1/10 Low 0 unhealthy d/yr today · 0 by 30 yrs out
Nearby sold comps map
Loading sold comps map…
Walkable amenities ~0.75 mi
Loading nearby amenities…
Taxation est. · year 1
- Rental income
- $12,366
- − Mortgage interest
- −$5,434
- − Property taxes
- −$798
- − Insurance
- −$485
- − Repairs & maintenance
- −$989
- − Management
- −$989
- − HOA
- −$768
- − Depreciation
- −$2,822
- Taxable income
- $81
- Est. tax owed @ 24.0%
- −$20
- After-tax cash flow
- $1,595/yr
For passive investors: Depreciation is non-cash, so a rental often shows a tax loss while cash-flowing — sheltering income. Rental losses are passive: they offset passive income freely, and up to $25,000/yr can offset ordinary (W-2) income if you actively participate and your MAGI is under $100k (phasing out to $0 by $150k); unused losses carry forward. On sale, claimed depreciation is recaptured at up to 25%, and gains may owe capital-gains tax (a 1031 exchange can defer both). Figures are a year-1 estimate at your 24.0% rate — not tax advice; consult a CPA.
Schools (NCES district)
- District
- Congress Elementary District (4479)
- NCES district ID
- 0402220
- Math proficiency
- 60% ▼ -5.00%
- Reading proficiency
- 55% ▼ -5.00%
- Median HH income
- $40,613
- Composite
- 49.83/100
- National rank
- #4193
- State rank
- #91 of 501 in AZ
Livability — Congress
- Score
- 66/100
- State rank
- #75
- US rank
- #11962
Category grades
Schools grade is shown separately in the Schools card above.
Census & demographics
- Census place
- Congress, AZ
- Population (ZIP)
- 1,777
Population outlook (Yavapai County) Hauer SSP2
- Today (2025)
- 241,389 people
- By 2030
- 249,523 · +3.4%
- By 2040
- 259,966 · +7.7%
- By 2050
- 264,736 · +9.7%
- By 2075
- 269,334 · +11.6%
- By 2100
- 256,505 · +6.3%
Race, ethnicity, and origin ACS 2023
- Neighborhood character
- Predominantly White (92%)
- Race & ethnicity
- White 92% Two or more races 4% Hispanic / Latino 2%
- Common ancestry
- Slovak 4% Scottish 3% Lithuanian 2%
- Foreign-born
- 1%
- Languages at home
- 96% English-only · German/W. Germanic 2% Spanish 1%
Political lean MEDSL · Yavapai
- 2024 margin
- Solid R (+33.9) · D 32.6% · R 66.5%
- 2008→2024 swing
- -9.5pp toward R · 2008: -24.4pp · 2024: -33.9pp
- All cycles
- 2024: R+33.9 2020: R+29.3 2016: R+31.4 2012: R+30.7 2008: R+24.4
Not yet ingested
- Civics
- —
Market trends
- HPI YoY
- ▲ 3.77%
- Current HPI
- 513.0899
- Rent YoY
- —
- Metro
- —
- State GDP YoY
- ▲ 4.54%
- F500 in state
- 20
Industry mix (Fortune 500 HQ in AZ)
| Industry | F500 HQs | Revenue |
|---|---|---|
| Technology | 2 | $13B |
|
||
| Mining / Metals | 1 | $23B |
|
||
| Environmental Services | 1 | $16B |
|
||
| Metals / Steel | 1 | $14B |
|
||
| Technology Distribution | 1 | $9B |
|
||
| Homebuilding | 1 | $8B |
|
||
Price history
+1112.5% since first listed4 events — show timeline
- 2026-05-20 Listed $97,000 ARMLS
- 2017-08-01 Sold (MLS) $32,500 ARMLS
- 2017-02-24 Listed $38,000 ARMLS
- 2000-02-09 Sold (Public Records) $8,000 Public Records
Property tax history
+38.6%/yrLatest (2025): $798 · +10.1% YoY. Source: county tax records.
Cash-flow waterfall
monthlySold comps — $/sqft
last 12 mo · ≤1 miLoading sold comps…