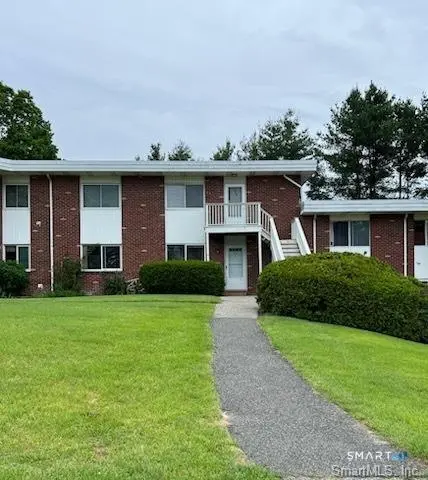
42 Candlewood Lake Rd S #2 · Chimney Point, CT
Flood risk 1/10 · Minimal
- FEMA flood zone
- X
- Chance of flooding over 30 yrs
- 0.0%
- Est. flood insurance / yr
- $507 – $1,088
Fire risk 1/10 · Minimal
- Est. fire insurance / yr
- $829 – $1,539
Heat risk 5/10 · Moderate
- Hot days now (above 98°F)
- 7 days/yr
- Hot days in 30 yrs
- 16 days/yr
Wind risk 4/10 · Minor
- Chance of severe wind over 30 yrs
- 21.0%
Air-quality risk 3/10 · Minor
- Unhealthy air days now
- 3 days/yr
- Unhealthy air days in 30 yrs
- 4 days/yr
Risk factors via First Street. Map © Google.
Why this score? — see what drove the D grade
The composite is a weighted blend of 9 inputs, each scored 0–100. Each bar is that input's sub-score; the figure is the points it added to the 100-point composite (weight × sub-score).
- Cash flow +13.0/30.0
- ARV discount +7.5/15.0
- 1% rule +5.5/10.0
- DSCR +3.9/10.0
- Schools +3.6/10.0
- Rent growth +2.5/5.0
- Livability +2.5/5.0
- Condition / age +2.5/5.0
- Appreciation +0.0/10.0
$175,000
🖨 Deal sheet 📄 Offer letter ✓ Due diligence
Listing remarks MLS
Great southern New Milford location, easy commute, large living room & dining room w/ slider to balcony. Freshly painted, ready to go, immediate occupancy. Owner financing considered.
Key facts
- Plenty of parking
- Private balconey
- Laundry on site
Tags
Property features AI
Finance
- Other: Part of a 40-unit building
- HOA & community: Monthly HOA fee; HOA covers grounds maintenance, trash pickup, and snow removal; Pets allowed per association rules
Exterior
- Utilities: Public water; Public sewer
- Home design: Condominium in a multi-unit complex (Candlewood Lake)
- Construction: Brick construction
- Exterior features: Vinyl siding; Level lot
Interior
- Kitchen: Oven/Range; Refrigerator; Dishwasher
- Bedrooms: 1 bedroom
- Bathrooms: 1 full bathroom
- Heating & cooling: Baseboard heat (electric); Wall-mounted cooling unit; 40-gallon hot water tank
- Interior features: One-level unit; No basement
Neighborhood map
What this means for you Summary
Snapshot
- This is a 1-bed/1.0-bath condo listed at $175k.
Deal economics
- At list price, monthly cash flow is $-10 ($-114/yr) — negative.
- To cash-flow at today's rent, offer at most $173k (1.0% below list).
- Meets the 1% rule at list price ($2k rent vs $175k).
- Recommended offer: $173k (1.0% below list) — sets the bar for cash-flow.
Location & tenants
- Location reads: area grade D — affects rentability + tenant quality, not the cash-flow math above.
- New Milford School District (suburban): math 29% / reading 47% proficiency, ranked #100 of 153 in CT (top 65%) — families likely to look elsewhere, expect single-tenant / working-renter base with shorter leases; only 15% free/reduced lunch — higher-income household profile.
- Zoned schools: Hill And Plain School (377 students, 47% FRL); New Milford High School (math 33% / reading 62%, grade D, #91 of 194 statewide, top 47%, 1,247 students, 31% FRL) — zoned schools average 39% FRL vs 15% district-wide (24 pts higher); higher-poverty schools than district average — tighter screening recommended.
- Market conditions: 147 active listings in the ZIP; solid renter incomes; 1,151 units permitted in Western Connecticut Planning Region in 2024 (714 in 5+ unit buildings).
Forward outlook
- Local home prices are declining (-3.0%/yr); year-one equity from $1k of loan paydown is wiped out by about $5k of value loss. Plan a longer hold.
Negotiation context
- Only 2 days on market — expect competitive offers; lowballing is unlikely to land.
- 4 sale attempts since 12y ago with the ask held roughly flat each time — persistent listings suggest the price (not the market) is what's stuck; bring a comps-based counter.
- Current owner paid $72k; list at $175k implies a 141% gain — meaningful room to come down on a strong offer.
Risks & watch-outs
- Climate carrying-cost: extreme-heat days projected 7→16/yr by 2055 (HVAC capex compounding) — expect insurance premiums to compound above CPI over the hold.
Questions for the listing agent
- What do current leases actually rent for vs. the listed asking? Can we see a recent rent roll and the last 12 months of T-12 income?
- Built in 1968 — when were the roof, HVAC, electrical panel, plumbing, and water heater last replaced?
- What does the HOA fee cover, when was the last increase, and are there any pending special assessments or reserve-fund shortfalls?
- Any open or pending special assessments — roof, HVAC, plumbing, elevator, façade? What's the per-unit balance and payoff schedule, and is the seller paying it off at close or rolling it to the buyer?
- Is there a deadline driving the sale (1031 exchange, divorce, estate, relocation)? That informs how much negotiation room exists.
- The area grade is low — what's the realistic commute time and amenity access for the typical tenant pool here? Any planned neighborhood developments (good or bad) we should know about?
- What's the average days-on-market for RENTAL listings here right now (not sales)? A rising rental-DOM trend means longer vacancies and softer asking-rent achievability than the comps imply.
- What's the recent tenant-quality profile in this submarket — average credit score on applications, eviction rate, late-payment / NSF rate, and stable-employment percentage? A property-management company in the area should have these aggregated.
- How much new apartment / multifamily construction is in the pipeline within 1–3 miles? Heavy new supply (>2% of stock underway) typically softens rents 12–24 months out; light construction supports rent growth.
Investment metrics
- 1% rule
- 1.05% ✓
- Cap rate
- 6.23%
- Cash-on-cash
- -0.23%
- DSCR
- 0.99
- GRM
- 7.9
CMA / ARV
No comps found within radius.
Projected returns pro-forma
-3.0% appreciation · 3.0% rent growth · sell at horizon
- IRR
- -16.6%
- Equity multiple
- 0.41×
- Total profit
- $-28,782
- Equity at exit
- $26,093
- IRR
- -8.1%
- Equity multiple
- 0.49×
- Total profit
- $-25,101
- Equity at exit
- $15,131
Cash invested: $49,000 (down + closing). Projections, not guarantees.
Landlord ↔ Tenant lean methodology
- Overall (STATE)
- 27 Tenant-Leaning
- State Connecticut
- 27 Tenant-Leaning · D+7
- County
- — inherits STATE
- City
- — inherits STATE
ZIP-level market 06776
- Active inventory
- 147
- Price-to-rent
- 7.9×
Monthly cashflow live
- Estimated rent
- $1,839 medium interval (Pro) →
- Mortgage (P&I)
- −$918
- Tax from tax record
- −$139 /mo · $1,672/yr
- Insurance
- −$73
- HOA
- −$332
- Vacancy / Maint / Mgmt
- −$386
- Net cashflow
- $-10
Break-even live
UW: 25.0% down · 7.5% · 30yr · 1.5% tax · 5.0% vac · 8.0% maint · 8.0% mgmt
Financing live
Cash to close
- Down payment
- $43,750
- Closing costs
- $5,250
- Reserves months
- —
- Total cash needed
- —
Loan-product check · same deal, 3 products live
Conventional
25% down · 7.5% · 30yr
- Down + closing
- —
- Monthly P&I
- —
- Monthly cashflow
- —
- DSCR
- —
- Eligible?
- —
Personal DTI + credit; lowest rate.
DSCR
20% down · 8.5% · 30yr
- Down + closing
- —
- Monthly P&I
- —
- Monthly cashflow
- —
- DSCR
- —
- Eligible?
- —
No personal income docs; deal must DSCR.
Hard money
10% down · 12.0% · 12mo
- Down + closing
- —
- Monthly P&I
- —
- Monthly cashflow
- —
- DSCR
- —
- Eligible?
- —
Short-term bridge; refi at stabilization.
HOA detail condo
- Monthly dues
- $332 · $3,984/yr
- Assessments
- None detected in remarks — confirm with the listing agent.
Listing history 13 events
-
2026-05-06status Under Contract
-
2026-05-05historical Under Contract - Continue to Show
-
2026-05-04$175,000 Active
-
2025-07-24historical $1,675
-
2025-07-15price $1,675
-
2025-07-10price $1,775
-
2025-06-27$1,850
-
2017-07-07soldstatus $72,500 187-char remark
Show marketing remark (187 chars)
Great southern New Milford location, easy commute, large living room & dining room w/ slider to balcony. Freshly painted, ready to go, immediate occupancy. Owner financing considered.
-
2017-07-07soldstatus $72,500
Show marketing remark (187 chars)
Great southern New Milford location, easy commute, large living room & dining room w/ slider to balcony. Freshly painted, ready to go, immediate occupancy. Owner financing considered.
-
2017-06-21$72,500 187-char remark
Show marketing remark (187 chars)
Great southern New Milford location, easy commute, large living room & dining room w/ slider to balcony. Freshly painted, ready to go, immediate occupancy. Owner financing considered.
-
2015-02-06historical
-
2014-07-02$69,500
-
2001-10-22soldstatus $35,000
ⓘ Source: listings_history table (triggers on properties + properties_extension) + one-shot
backfill from property_details.listing_events for pre-trigger history.
Tax reassessment forecast CT · Partial reset (capped growth)
- Current annual tax
- $1,672 · $139/mo
- Projected year-2 tax
- $2,708 · $226/mo
- Expected delta
- +$1,036/yr (+$86/mo · 62.0%)
ⓘ Screening estimate from a state-policy table — verify with the county assessor before closing.
Climate risk First Street
- Flood 1/10 Low FEMA zone X · 0% chance over 30 yrs
- Wildfire 1/10 Low
- Heat 5/10 Major 7 d/yr ≥98°F today · 16 d/yr by 30 yrs out
- Wind 4/10 Moderate 21% chance of damaging wind over 30 yrs
- Air quality 3/10 Moderate 3 unhealthy d/yr today · 4 by 30 yrs out
Nearby sold comps map
Loading sold comps map…
Walkable amenities ~0.75 mi
Loading nearby amenities…
Taxation est. · year 1
- Rental income
- $22,062
- − Mortgage interest
- −$9,803
- − Property taxes
- −$1,672
- − Insurance
- −$875
- − Repairs & maintenance
- −$1,765
- − Management
- −$1,765
- − HOA
- −$3,984
- − Depreciation
- −$5,091
- Taxable loss
- −$2,892
- Est. tax savings @ 24.0%
- +$694
- After-tax cash flow
- $580/yr
For passive investors: Depreciation is non-cash, so a rental often shows a tax loss while cash-flowing — sheltering income. Rental losses are passive: they offset passive income freely, and up to $25,000/yr can offset ordinary (W-2) income if you actively participate and your MAGI is under $100k (phasing out to $0 by $150k); unused losses carry forward. On sale, claimed depreciation is recaptured at up to 25%, and gains may owe capital-gains tax (a 1031 exchange can defer both). Figures are a year-1 estimate at your 24.0% rate — not tax advice; consult a CPA.
Schools (NCES district)
- District
- New Milford School District
- NCES district ID
- 0902850
- Math proficiency
- 29% ▼ -22.00%
- Reading proficiency
- 47% ▼ -11.00%
- Median HH income
- $81,576
- Composite
- 35.78/100
- National rank
- #4839
- State rank
- #100 of 153 in CT
Livability — Chimney Point
No livability data for this city. (Only ~50 U.S. cities are tracked.)
Census & demographics
- County
- Litchfield County · 81,203 people
- Metro
- Torrington, CT
- Population (ZIP)
- 27,010
- Household income
- $104,112
- Rent vs Own
- Severe rent burden
- 627.0
Population outlook (Western Connecticut County) Hauer SSP2
- By 2040
- 685,031
Race, ethnicity, and origin ACS 2023
- Neighborhood character
- Predominantly White (77%)
- Race & ethnicity
- White 77% Hispanic / Latino 12% Two or more races 7% Black 4% Asian 4%
- Hispanic origin (detail)
- Puerto Rican 4% Dominican 2%
- Common ancestry
- Romanian 4% Lithuanian 3% Italian 2%
- Foreign-born
- 12% · Canada, China
- Languages at home
- 86% English-only · Spanish 6% Other Indo-European 3% Chinese 1%
Political lean MEDSL · Western Connecticut
- 2024 margin
- D (+19.1) · D 58.8% · R 39.7% · Other 1.6%
- All cycles
- 2024: D+19.1
Not yet ingested
- Civics
- —
Market trends
- HPI YoY
- ▼ -264.52%
- Current HPI
- 305.6036
- Rent YoY
- —
- Metro
- Torrington, CT
- State GDP YoY
- ▲ 1.06%
- F500 in state
- 38
Industry mix (Fortune 500 HQ in CT)
| Industry | F500 HQs | Revenue |
|---|---|---|
| Industrial Machinery | 4 | $38B |
|
||
| Insurance | 3 | $71B |
|
||
| Financial Services | 2 | $25B |
|
||
| Transportation / Logistics | 2 | $18B |
|
||
| Healthcare | 1 | $247B |
|
||
| Telecommunications | 1 | $55B |
|
||
Price history
+400.0% since first listed13 events — show timeline
- 2026-05-06 Pending — Smart MLS
- 2026-05-05 Contingent — Smart MLS
- 2026-05-04 Listed $175,000 Smart MLS
- 2025-07-24 Rental Removed $1,675 SMARTMLS
- 2025-07-15 Price Changed $1,675 SMARTMLS
- 2025-07-10 Price Changed $1,775 SMARTMLS
- 2025-06-27 Listed for Rent $1,850 SMARTMLS
- 2017-07-07 Sold (Public Records) $72,500 Public Records
- 2017-07-07 Sold (MLS) $72,500 Smart MLS
- 2017-06-21 Listed $72,500 Smart MLS
- 2015-02-06 Listing Removed — Smart MLS
- 2014-07-02 Listed $69,500 Smart MLS
- 2001-10-22 Sold (Public Records) $35,000 Public Records
Property tax history
+0.8%/yrLatest (2023): $1,672 · +2.3% YoY. Source: county tax records.
Cash-flow waterfall
monthlySold comps — $/sqft
last 12 mo · ≤1 miLoading sold comps…