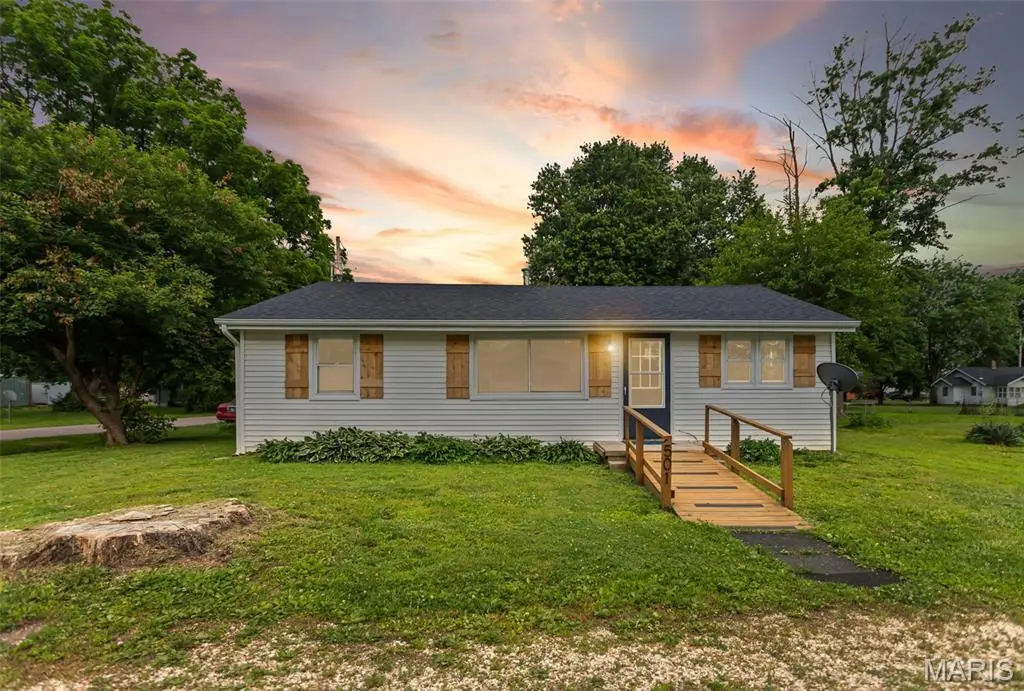
501 Commerce St · Pleasant Hill, IL
Flood risk 5/10 · Moderate
- FEMA flood zone
- X
- Chance of flooding over 30 yrs
- 0.27%
- Est. flood insurance / yr
- $507 – $1,088
Fire risk 1/10 · Minimal
- Est. fire insurance / yr
- $804 – $1,492
Heat risk 4/10 · Minor
- Hot days now (above 107°F)
- 7 days/yr
- Hot days in 30 yrs
- 19 days/yr
Wind risk 2/10 · Minimal
- Chance of severe wind over 30 yrs
- 1.0%
Air-quality risk 1/10 · Minimal
- Unhealthy air days now
- 0 days/yr
- Unhealthy air days in 30 yrs
- 0 days/yr
Risk factors via First Street. Map © Google.
Why this score? — see what drove the C- grade
The composite is a weighted blend of 9 inputs, each scored 0–100. Each bar is that input's sub-score; the figure is the points it added to the 100-point composite (weight × sub-score).
- Cash flow +19.6/30.0
- ARV discount +7.5/15.0
- DSCR +6.2/10.0
- Appreciation +6.0/10.0
- 1% rule +4.8/10.0
- Livability +3.2/5.0
- Rent growth +2.5/5.0
- Condition / age +2.5/5.0
- Schools +1.3/10.0
$99,000
🖨 Deal sheet 📄 Offer letter ✓ Due diligence
Listing remarks
Move right into this beautifully updated 3 bedroom, 1 ranch home conveniently located a corner lot in the heart of Pleasant Hill. Offering the ease of one level living, this home features numerous recent updates, including new flooring, an updated kitchen, a remodeled bathroom, new plumbing, and a new roof - all completed within the last year! Brand new stainless steel frig and stove included! Inside, you'll find stylish finishes throughout, including beautiful barnwood-style doors that add warmth and character to the home. The functional floor plan provides comfortable living spaces, while the handicap-accessible ramp offers added convenience and accessibility. Outside, enjoy the oversize
Key facts
- New plumbing
- Remodeled bathroom
- Updated kitchen
Tags
Property features AI
Finance
- Other: Living area recorded at 963 (Assessor); Above-grade finished area recorded as 936 (Assessor)
Exterior
- Parking: Off-street parking
- Utilities: Community water; Public sewer; Electricity (Ameren); Natural gas connected; Water connected; Sewer connected; Electricity connected
- Home design: Single-family residence; One story; Private ownership
- Construction: Vinyl siding; Shingle roof; Crawl space foundation; Built/verified by assessor
- Exterior features: Ramp entry; City lot; Corner lot; Level lot; Asphalt road access; No fencing
Interior
- Kitchen: Stainless steel appliances; Electric oven; Refrigerator
- Bedrooms: Three bedrooms on the main level
- Flooring: Carpet; Laminate
- Bathrooms: One full bathroom on the main level
- Heating & cooling: Forced air heating; Central air conditioning
- Interior features: Insulated windows; Accessible approach with ramp; Updated/remodeled condition
- Laundry & utility: Main-level laundry room
Neighborhood map
What this means for you Summary
Snapshot
- This is a 3-bed/1.0-bath other listed at $99k.
Deal economics
- At list price, monthly cash flow is $114 ($1k/yr) — positive.
- The deal already cash-flows at list — no discount required.
- To meet the 1% rule (rent ≥ 1% of price), the offer needs to be $97k (2.4% below list).
- Recommended offer: $97k (2.4% below list) — sets the bar for 1% rule.
Location & tenants
- Location reads 65/100 on livability (#649 in IL) — a middle-class / working-renter tenant base. Strengths: crime A+, cost of living A+, housing A+; Watch: amenities F, commute F, employment F.
- Pleasant Hill CUSD 3 (rural): math 6% / reading 15% proficiency, ranked #821 of 919 in IL (top 89%) — low school quality limits family demand, transient renter base, plan for 1-2y turnover.
- Zoned schools: Pleasant Hill Elem School (math 2% / reading 12%, grade F, #1,673 of 2,056 statewide, top 84%, 278 students, 0% FRL); Pleasant Hill High School (math 5% / reading 5%, grade F, #614 of 693 statewide, top 95%, 98 students, 0% FRL) — zoned schools average 0% FRL vs 40% district-wide (40 pts lower); this property's tenant base skews higher-income than the district average.
- Market conditions: 4 active listings in the ZIP; 20 units permitted in Pike County in 2024 (0 in 5+ unit buildings).
Forward outlook
- In year one you build about $3k of equity ($684 loan paydown + $2k appreciation (2.0% local appreciation)).
- Pike County population projected at -19% by 2050 — secular population decline; favor cash flow + early exit over multi-decade hold.
- At projected returns (2.0% appreciation + 3.0% rent growth), your $28k cash investment doubles in ~6 years — after that, you're playing with house money.
Negotiation context
- It's been on market 19 days — a 2% lower offer ($98k) is reasonable based on typical stale-listing flexibility.
Risks & watch-outs
- Climate carrying-cost: moderate flood risk — expect insurance premiums to compound above CPI over the hold.
Questions for the listing agent
- Built in 1963 — when were the roof, HVAC, electrical panel, plumbing, and water heater last replaced?
- Is there a deadline driving the sale (1031 exchange, divorce, estate, relocation)? That informs how much negotiation room exists.
- Schools are F-rated, which usually means shorter tenancies and higher turnover. Who's the typical renter profile here, and what's been the actual vacancy rate?
- What's the average days-on-market for RENTAL listings here right now (not sales)? A rising rental-DOM trend means longer vacancies and softer asking-rent achievability than the comps imply.
- What's the recent tenant-quality profile in this submarket — average credit score on applications, eviction rate, late-payment / NSF rate, and stable-employment percentage? A property-management company in the area should have these aggregated.
- How much new for-sale + rental construction is in the pipeline within 1–3 miles? Heavy new supply typically softens prices + rents 12–24 months out; constrained supply supports both.
Investment metrics
- 1% rule
- 0.98% ✗
- Cap rate
- 7.68%
- Cash-on-cash
- 4.95%
- DSCR
- 1.22
- GRM
- 8.5
CMA / ARV
No comps found within radius.
Projected returns pro-forma
2.01% appreciation · 3.0% rent growth · sell at horizon
- IRR
- 9.4%
- Equity multiple
- 1.51×
- Total profit
- $14,121
- Equity at exit
- $39,105
- IRR
- 12.5%
- Equity multiple
- 2.68×
- Total profit
- $46,653
- Equity at exit
- $56,355
Cash invested: $27,720 (down + closing). Projections, not guarantees.
Landlord ↔ Tenant lean methodology
- Overall (STATE)
- 43 Moderately Tenant-Leaning
- State Illinois
- 43 Moderately Tenant-Leaning · D+7
- County
- — inherits STATE
- City
- — inherits STATE
ZIP-level market 62366
- Home prices YoY
- 1.7%
- Active inventory
- 4
- Price-to-rent
- 8.5×
Monthly cashflow live
- Estimated rent
- $966 medium interval (Pro) →
- Mortgage (P&I)
- −$519
- Tax from tax record
- −$88 /mo · $1,059/yr
- Insurance
- −$41
- HOA
- −$0
- Vacancy / Maint / Mgmt
- −$203
- Net cashflow
- $114
Break-even live
UW: 25.0% down · 7.5% · 30yr · 1.5% tax · 5.0% vac · 8.0% maint · 8.0% mgmt
Financing live
Cash to close
- Down payment
- $24,750
- Closing costs
- $2,970
- Reserves months
- —
- Total cash needed
- —
Loan-product check · same deal, 3 products live
Conventional
25% down · 7.5% · 30yr
- Down + closing
- —
- Monthly P&I
- —
- Monthly cashflow
- —
- DSCR
- —
- Eligible?
- —
Personal DTI + credit; lowest rate.
DSCR
20% down · 8.5% · 30yr
- Down + closing
- —
- Monthly P&I
- —
- Monthly cashflow
- —
- DSCR
- —
- Eligible?
- —
No personal income docs; deal must DSCR.
Hard money
10% down · 12.0% · 12mo
- Down + closing
- —
- Monthly P&I
- —
- Monthly cashflow
- —
- DSCR
- —
- Eligible?
- —
Short-term bridge; refi at stabilization.
Listing history 15 events
-
2026-06-18days on market $99,000 Active 19 DOM
-
2026-06-17days on market $99,000 Active 18 DOM
-
2026-06-16days on market $99,000 Active 17 DOM
-
2026-06-15days on market $99,000 Active 16 DOM
-
2026-06-13days on market $99,000 Active 14 DOM
-
2026-06-12days on market $99,000 Active 13 DOM
-
2026-06-09days on market $99,000 Active 10 DOM
-
2026-06-08days on market $99,000 Active 9 DOM
-
2026-06-07days on market $99,000 Active 8 DOM
-
2026-06-05days on market $99,000 Active 6 DOM
-
2026-06-04days on market $99,000 Active 4 DOM
-
2026-06-02days on market $99,000 Active 3 DOM
-
2026-06-01days on market $99,000 Active 2 DOM
-
2026-05-31remarks 699-char remark
-
2026-05-31$99,000 Active 1 DOM
ⓘ Source: listings_history table (triggers on properties + properties_extension) + one-shot
backfill from property_details.listing_events for pre-trigger history.
Tax reassessment forecast IL · Partial reset (capped growth)
- Current annual tax
- $1,059 · $88/mo
- Projected year-2 tax
- $1,653 · $138/mo
- Expected delta
- +$594/yr (+$50/mo · 56.1%)
ⓘ Screening estimate from a state-policy table — verify with the county assessor before closing.
Climate risk First Street
- Flood 5/10 Major FEMA zone X · 27% chance over 30 yrs
- Wildfire 1/10 Low
- Heat 4/10 Moderate 7 d/yr ≥107°F today · 19 d/yr by 30 yrs out
- Wind 2/10 Low 100% chance of damaging wind over 30 yrs
- Air quality 1/10 Low 0 unhealthy d/yr today · 0 by 30 yrs out
Nearby sold comps map
Loading sold comps map…
Walkable amenities ~0.75 mi
Loading nearby amenities…
Taxation est. · year 1
- Rental income
- $11,592
- − Mortgage interest
- −$5,546
- − Property taxes
- −$1,059
- − Insurance
- −$495
- − Repairs & maintenance
- −$927
- − Management
- −$927
- − Depreciation
- −$2,880
- Taxable loss
- −$243
- Est. tax savings @ 24.0%
- +$58
- After-tax cash flow
- $1,431/yr
For passive investors: Depreciation is non-cash, so a rental often shows a tax loss while cash-flowing — sheltering income. Rental losses are passive: they offset passive income freely, and up to $25,000/yr can offset ordinary (W-2) income if you actively participate and your MAGI is under $100k (phasing out to $0 by $150k); unused losses carry forward. On sale, claimed depreciation is recaptured at up to 25%, and gains may owe capital-gains tax (a 1031 exchange can defer both). Figures are a year-1 estimate at your 24.0% rate — not tax advice; consult a CPA.
Schools (NCES district)
- District
- Pleasant Hill CUSD 3
- NCES district ID
- 1731890
- Math proficiency
- 6% ▬ 0.00%
- Reading proficiency
- 15% ▬ 0.00%
- Median HH income
- $43,199
- Composite
- 13.0/100
- National rank
- #14528
- State rank
- #821 of 919 in IL
Livability — Pleasant Hill
- Score
- 65/100
- State rank
- #649
- US rank
- #13267
Category grades
Schools grade is shown separately in the Schools card above.
Census & demographics
- Census place
- Pleasant Hill, IL
- Population (ZIP)
- 1,514
Population outlook (Pike County) Hauer SSP2
- Today (2025)
- 15,069 people
- By 2030
- 14,505 · -3.7%
- By 2040
- 13,340 · -11.5%
- By 2050
- 12,159 · -19.3%
- By 2075
- 9,227 · -38.8%
- By 2100
- 6,064 · -59.8%
Race, ethnicity, and origin ACS 2023
- Neighborhood character
- Predominantly White (98%)
- Race & ethnicity
- White 98% Two or more races 2%
- Common ancestry
- Italian 2% Portuguese 2% Slovak 1%
- Languages at home
- 95% English-only · German/W. Germanic 5%
Political lean MEDSL · Pike
- 2024 margin
- Solid R (+63.7) · D 17.4% · R 81.1% · Other 1.6%
- 2008→2024 swing
- -44.9pp toward R · 2008: -18.8pp · 2024: -63.7pp
- All cycles
- 2024: R+63.7 2020: R+60.9 2016: R+58.2 2012: R+35.4 2008: R+18.8
Not yet ingested
- Civics
- —
Market trends
- HPI YoY
- ▲ 2.01%
- Current HPI
- 120.7737
- Rent YoY
- —
- Metro
- —
- State GDP YoY
- ▲ 1.59%
- F500 in state
- 60
Industry mix (Fortune 500 HQ in IL)
| Industry | F500 HQs | Revenue |
|---|---|---|
| Insurance | 4 | $201B |
|
||
| Consumer Goods | 4 | $87B |
|
||
| Industrial Machinery | 3 | $64B |
|
||
| Healthcare | 2 | $55B |
|
||
| Retail / Pharmacy | 1 | $148B |
|
||
| Agriculture / Food | 1 | $86B |
|
||
Price history
1 event — show timeline
- 2026-05-30 Listed $99,000 MARIS as Distributed by MLS Grid
Property tax history
+9.4%/yrLatest (2024): $1,059 · +1.2% YoY. Source: county tax records.
Cash-flow waterfall
monthlySold comps — $/sqft
last 12 mo · ≤1 miLoading sold comps…