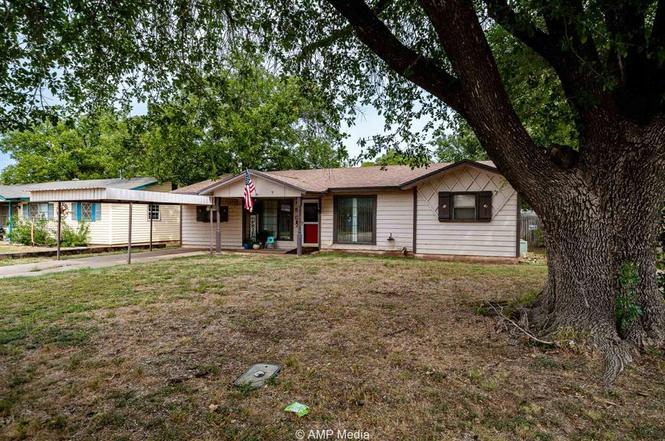
507 Hill Cir · Stamford, TX
Flood risk 1/10 · Minimal
- FEMA flood zone
- X (unshaded)
- Chance of flooding over 30 yrs
- 0.0%
- Est. flood insurance / yr
- $507 – $1,088
Fire risk 5/10 · Moderate
- Est. fire insurance / yr
- $1,222 – $2,270
Heat risk 7/10 · Major
- Hot days now (above 107°F)
- 6 days/yr
- Hot days in 30 yrs
- 19 days/yr
Wind risk 4/10 · Minor
- Chance of severe wind over 30 yrs
- 9.0%
Air-quality risk 1/10 · Minimal
- Unhealthy air days now
- 0 days/yr
- Unhealthy air days in 30 yrs
- 0 days/yr
Risk factors via First Street. Map © Google.
Why this score? — see what drove the B+ grade
The composite is a weighted blend of 9 inputs, each scored 0–100. Each bar is that input's sub-score; the figure is the points it added to the 100-point composite (weight × sub-score).
- Cash flow +26.1/30.0
- ARV discount +15.0/15.0
- DSCR +8.8/10.0
- 1% rule +7.8/10.0
- Appreciation +5.0/10.0
- Schools +4.0/10.0
- Livability +3.5/5.0
- Rent growth +2.5/5.0
- Condition / age +2.5/5.0
$92,500
🖨 Deal sheet 📄 Offer letter ✓ Due diligence
Listing remarks
Nestled in the quiet, established Dodson-Hill neighborhood of Stamford, this 3-bedroom, 2-bath home is full of potential! This home is perfect as a starter home or a solid income-producing rental. Step inside to a spacious living area that seamlessly connects to the open kitchen and dining space, creating an inviting layout for everyday living or entertaining. The dining area is bathed in natural sunlight and features a sliding glass door that leads to a covered back patio, ideal for cookouts, relaxing evenings, or hosting friends and family. The split-bedroom floor plan provides added privacy, with a generously sized master suite tucked away from the secondary bedrooms. The home is equippe
Key facts
- Master suite
- Spacious living area
- Central heat and air
Tags
Property features AI
Finance
- Other: Property type: Residential (single-family); Lot less than 0.5 acre; Subdivision: Dodson-Hill Stamford; Directions: Take Orient Street to Hill Circle; this is the 3rd house from the end on the right
- HOA & community: No association
Exterior
- Parking: 4 carport spaces (covered); Attached and detached carport options; Driveway and on-street parking; RV access/parking, on-site parking, alley access
- Security: Smoke detector(s); Carbon monoxide detector(s)
- Utilities: City water; City sewer; Electricity available and connected; Curbs and asphalt streets
- Home design: Single-family residence; One story; Accessible approach with ramp
- Construction: Built in 1960; Frame and siding construction; Composition roof; Pillar/post/pier foundation
- Exterior features: Covered porch(es) including covered rear porch and patio; Dog run / kennel; RV/boat parking; Storage; Alley access
Interior
- Kitchen: Electric oven and electric range; Pantry; Built-in cabinets; Dual sinks
- Bedrooms: 3 bedrooms (primary bedroom on level 1 with ensuite bath)
- Bathrooms: 2 full bathrooms
- Heating & cooling: Central heating (electric); Central air; Ceiling fans
- Interior features: High-speed internet available; Pantry; One living area; One dining area; Room count: 4
- Laundry & utility: Full-size washer/dryer area; Washer hookup; Electric dryer hookup; Electric water heater
Neighborhood map
What this means for you Summary
Snapshot
- This is a 3-bed/2.0-bath single-family listed at $92k.
Deal economics
- At list price, monthly cash flow is $234 ($3k/yr) — positive.
- The deal already cash-flows at list — no discount required.
- Meets the 1% rule at list price ($1k rent vs $92k).
- Recommended offer: $81k (12.0% below list) — sets the bar for market timing.
Location & tenants
- Location reads 70/100 on livability (#344 in TX) — a middle-class / working-renter tenant base. Strengths: crime A+, cost of living A+, housing A+; Watch: employment C-, health & safety C-, amenities F.
- Stamford ISD (town): math 50% / reading 46% proficiency, ranked #239 of 826 in TX (top 29%) — families likely to look elsewhere, expect single-tenant / working-renter base with shorter leases; 68% free/reduced lunch — lower-income household profile, screen leases tightly.
- Zoned schools: Oliver El (math 42% / reading 47%, grade F, #1,155 of 4,322 statewide, top 29%, 303 students, 75% FRL).
- Market conditions: 18 active listings in the ZIP; 1 units permitted in Jones County in 2024 (0 in 5+ unit buildings).
Forward outlook
- In year one you build about $691 of equity ($640 loan paydown + $51 appreciation (0.1% local appreciation)).
- Jones County population projected at +13% by 2050 — modest demand growth; plan on rents tracking national, not racing it.
- At projected returns (0.1% appreciation + 3.0% rent growth), your $26k cash investment doubles in ~6 years — after that, you're playing with house money.
Negotiation context
- It's been on market 224 days — a 12% lower offer ($81k) is reasonable based on typical stale-listing flexibility.
- 3 sale attempts with the ask held roughly flat each time — persistent listings suggest the price (not the market) is what's stuck; bring a comps-based counter.
Risks & watch-outs
- Climate carrying-cost: moderate wildfire risk; extreme-heat days projected 6→19/yr by 2055 (HVAC capex compounding) — expect insurance premiums to compound above CPI over the hold.
Questions for the listing agent
- It's been on market 224 days. Have you received any prior offers? Is the seller open to a 12% concession, seller financing, or rate buy-down credit?
- Built in 1960 — when were the roof, HVAC, electrical panel, plumbing, and water heater last replaced?
- Why hasn't it sold? Are there any deal-killer items the seller is aware of (foundation, flood, title, zoning, code violations)?
- Is there a deadline driving the sale (1031 exchange, divorce, estate, relocation)? That informs how much negotiation room exists.
- Schools are D-rated, which usually means shorter tenancies and higher turnover. Who's the typical renter profile here, and what's been the actual vacancy rate?
- What's the average days-on-market for RENTAL listings here right now (not sales)? A rising rental-DOM trend means longer vacancies and softer asking-rent achievability than the comps imply.
- What's the recent tenant-quality profile in this submarket — average credit score on applications, eviction rate, late-payment / NSF rate, and stable-employment percentage? A property-management company in the area should have these aggregated.
- How much new for-sale + rental construction is in the pipeline within 1–3 miles? Heavy new supply typically softens prices + rents 12–24 months out; constrained supply supports both.
Investment metrics
- 1% rule
- 1.28% ✓
- Cap rate
- 9.32%
- Cash-on-cash
- 10.82%
- DSCR
- 1.48
- GRM
- 6.5
CMA / ARV
- ARV (on-the-fly)
- $151,905
- Comps found
- 6
Show comp detail 6 sales within ~0.75 mi
| Address | Dist | Beds/Ba | Sqft | Sold | Price | $/sf | Match |
|---|---|---|---|---|---|---|---|
| 603 Potomac Dr | 0.17mi | 3/1.0 | 1,187 (-4%) | 2mo | $149,900 | $126 | 79 |
| 710 S Orient St | 0.34mi | 3/2.0 | 1,296 (+5%) | 2mo | $159,900 | $123 | 74 |
| 911 S Anson | 0.10mi | 3/1.0 | 1,374 (+11%) | 5mo | $159,900 | $116 | 68 |
| 802 S Orient St | 0.31mi | 3/2.0 | 1,104 (-11%) | 12mo | $159,900 | $145 | 57 |
| 412 E Hamilton | 0.73mi | 2/1.0 (-1) | 1,228 (-1%) | 6mo | $65,000 | $53 | 51 |
| 601 E Rotan St | 0.69mi | 3/2.0 | 1,100 (-11%) | 14mo | $89,900 | $82 | 38 |
Match score weights: distance 35% · size 25% · config 20% · recency 20%. Top-matched comps best support the ARV.
Projected returns pro-forma
0.06% appreciation · 3.0% rent growth · sell at horizon
- IRR
- 10.0%
- Equity multiple
- 1.48×
- Total profit
- $12,469
- Equity at exit
- $27,116
- IRR
- 14.9%
- Equity multiple
- 2.65×
- Total profit
- $42,646
- Equity at exit
- $32,800
Cash invested: $25,900 (down + closing). Projections, not guarantees.
Landlord ↔ Tenant lean methodology
- Overall (STATE)
- 87 Strongly Landlord-Friendly
- State Texas
- 87 Strongly Landlord-Friendly · R+5
- County
- — inherits STATE
- City
- — inherits STATE
ZIP-level market 79553
- Home prices YoY
- 0.1%
- Active inventory
- 18
- Price-to-rent
- 6.5×
Monthly cashflow live
- Estimated rent
- $1,179 medium interval (Pro) →
- Mortgage (P&I)
- −$485
- Tax from tax record
- −$175 /mo · $2,094/yr
- Insurance
- −$39
- HOA
- −$0
- Vacancy / Maint / Mgmt
- −$248
- Net cashflow
- $234
Break-even live
UW: 25.0% down · 7.5% · 30yr · 1.5% tax · 5.0% vac · 8.0% maint · 8.0% mgmt
Financing live
Cash to close
- Down payment
- $23,125
- Closing costs
- $2,775
- Reserves months
- —
- Total cash needed
- —
Loan-product check · same deal, 3 products live
Conventional
25% down · 7.5% · 30yr
- Down + closing
- —
- Monthly P&I
- —
- Monthly cashflow
- —
- DSCR
- —
- Eligible?
- —
Personal DTI + credit; lowest rate.
DSCR
20% down · 8.5% · 30yr
- Down + closing
- —
- Monthly P&I
- —
- Monthly cashflow
- —
- DSCR
- —
- Eligible?
- —
No personal income docs; deal must DSCR.
Hard money
10% down · 12.0% · 12mo
- Down + closing
- —
- Monthly P&I
- —
- Monthly cashflow
- —
- DSCR
- —
- Eligible?
- —
Short-term bridge; refi at stabilization.
Listing history 21 events
-
2026-06-12status $92,500 Pending 224 DOM
-
2026-06-09days on market $92,500 Active Contingent 224 DOM
-
2026-06-08days on market $92,500 Active Contingent 223 DOM
-
2026-06-08days on market $92,500 Active Contingent 222 DOM
-
2026-06-07days on market $92,500 Active Contingent 221 DOM
-
2026-06-03days on market $92,500 Active Contingent 218 DOM
-
2026-06-02days on market $92,500 Active Contingent 217 DOM
-
2026-06-01days on market $92,500 Active Contingent 216 DOM
-
2026-05-31days on market $92,500 Active Contingent 215 DOM
-
2026-05-26historical Active Contingent
-
2026-05-26status Active
-
2026-04-11historical
-
2026-01-10historical Active Option Contract
-
2025-09-22status Active
-
2025-09-18historical Active Option Contract
-
2025-09-11$92,500 Active
-
2017-09-18soldstatus
-
2005-10-28soldstatus
-
1993-01-14soldstatus
-
1991-01-09soldstatus
-
1986-01-16soldstatus
ⓘ Source: listings_history table (triggers on properties + properties_extension) + one-shot
backfill from property_details.listing_events for pre-trigger history.
Tax reassessment forecast TX · Resets to sale price
- Current annual tax
- $2,094 · $175/mo
- Projected year-2 tax
- $2,094 · $175/mo
- Expected delta
- $0/yr ($0/mo · 0.0%)
ⓘ Screening estimate from a state-policy table — verify with the county assessor before closing.
Climate risk First Street
- Flood 1/10 Low FEMA zone X (unshaded) · 0% chance over 30 yrs
- Wildfire 5/10 Major
- Heat 7/10 Severe 6 d/yr ≥107°F today · 19 d/yr by 30 yrs out
- Wind 4/10 Moderate 9% chance of damaging wind over 30 yrs
- Air quality 1/10 Low 0 unhealthy d/yr today · 0 by 30 yrs out
Nearby sold comps map
Loading sold comps map…
Walkable amenities ~0.75 mi
Loading nearby amenities…
Taxation est. · year 1
- Rental income
- $14,153
- − Mortgage interest
- −$5,181
- − Property taxes
- −$2,094
- − Insurance
- −$462
- − Repairs & maintenance
- −$1,132
- − Management
- −$1,132
- − Depreciation
- −$2,691
- Taxable income
- $1,460
- Est. tax owed @ 24.0%
- −$350
- After-tax cash flow
- $2,453/yr
For passive investors: Depreciation is non-cash, so a rental often shows a tax loss while cash-flowing — sheltering income. Rental losses are passive: they offset passive income freely, and up to $25,000/yr can offset ordinary (W-2) income if you actively participate and your MAGI is under $100k (phasing out to $0 by $150k); unused losses carry forward. On sale, claimed depreciation is recaptured at up to 25%, and gains may owe capital-gains tax (a 1031 exchange can defer both). Figures are a year-1 estimate at your 24.0% rate — not tax advice; consult a CPA.
Schools (NCES district)
- District
- Stamford ISD
- NCES district ID
- 4841400
- Math proficiency
- 50% ▲ 7.00%
- Reading proficiency
- 46% ▲ 5.00%
- Median HH income
- $37,780
- Composite
- 39.98/100
- National rank
- #3836
- State rank
- #239 of 826 in TX
Livability — Stamford
- Score
- 70/100
- State rank
- #344
- US rank
- #7510
Category grades
Schools grade is shown separately in the Schools card above.
Census & demographics
- Census place
- Stamford, TX
- Population (ZIP)
- 3,071
Population outlook (Jones County) Hauer SSP2
- Today (2025)
- 19,845 people
- By 2030
- 20,213 · +1.9%
- By 2040
- 21,446 · +8.1%
- By 2050
- 22,499 · +13.4%
- By 2075
- 23,272 · +17.3%
- By 2100
- 20,420 · +2.9%
Race, ethnicity, and origin ACS 2023
- Neighborhood character
- Diverse neighborhood (Simpson 0.58)
- Race & ethnicity
- White 51% Hispanic / Latino 39% Two or more races 8% Black 5% Asian 2%
- Hispanic origin (detail)
- Mexican 35%
- Common ancestry
- Slovak 5% Serbian 2% Danish 2%
- Foreign-born
- 5% · Canada
- Languages at home
- 80% English-only · Spanish 17% Other Indo-European 2% German/W. Germanic 1%
Political lean MEDSL · Jones
- 2024 margin
- Solid R (+73.2) · D 13.1% · R 86.2%
- 2008→2024 swing
- -27.1pp toward R · 2008: -46.1pp · 2024: -73.2pp
- All cycles
- 2024: R+73.2 2020: R+69.1 2016: R+65.4 2012: R+54.5 2008: R+46.1
Not yet ingested
- Civics
- —
Market trends
- HPI YoY
- ▲ 0.06%
- Current HPI
- 104.7578
- Rent YoY
- —
- Metro
- —
- State GDP YoY
- ▲ 3.95%
- F500 in state
- 110
Industry mix (Fortune 500 HQ in TX)
| Industry | F500 HQs | Revenue |
|---|---|---|
| Energy | 16 | $1,198B |
|
||
| Technology | 5 | $198B |
|
||
| Engineering / Construction | 4 | $72B |
|
||
| Energy Services | 3 | $60B |
|
||
| Utilities | 3 | $41B |
|
||
| Healthcare | 2 | $330B |
|
||
Price history
12 events — show timeline
- 2026-05-26 Contingent — NTREIS
- 2026-05-26 Relisted — NTREIS
- 2026-04-11 Listing Removed — NTREIS
- 2026-01-10 Contingent — NTREIS
- 2025-09-22 Relisted — NTREIS
- 2025-09-18 Contingent — NTREIS
- 2025-09-11 Listed $92,500 NTREIS
- 2017-09-18 Sold (Public Records) — Public Records
- 2005-10-28 Sold (Public Records) — Public Records
- 1993-01-14 Sold (Public Records) — Public Records
- 1991-01-09 Sold (Public Records) — Public Records
- 1986-01-16 Sold (Public Records) — Public Records
Property tax history
+5.6%/yrLatest (2025): $2,094 · +7.6% YoY. Source: county tax records.
Cash-flow waterfall
monthlySold comps — $/sqft
last 12 mo · ≤1 miLoading sold comps…