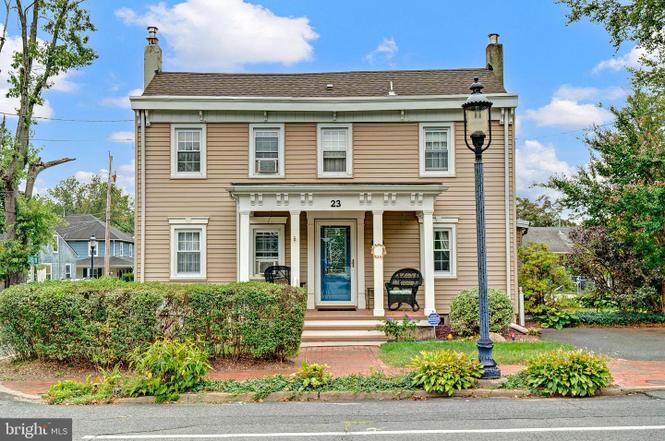
23 Main St N · Windsor, NJ
Flood risk 1/10 · Minimal
- FEMA flood zone
- X (unshaded)
- Chance of flooding over 30 yrs
- 0.0%
- Est. flood insurance / yr
- $507 – $1,088
Fire risk 3/10 · Minor
- Est. fire insurance / yr
- $526 – $976
Heat risk 6/10 · Moderate
- Hot days now (above 101°F)
- 7 days/yr
- Hot days in 30 yrs
- 15 days/yr
Wind risk 6/10 · Moderate
- Chance of severe wind over 30 yrs
- 27.0%
Air-quality risk 4/10 · Minor
- Unhealthy air days now
- 5 days/yr
- Unhealthy air days in 30 yrs
- 6 days/yr
Risk factors via First Street. Map © Google.
Why this score? — see what drove the D+ grade
The composite is a weighted blend of 9 inputs, each scored 0–100. Each bar is that input's sub-score; the figure is the points it added to the 100-point composite (weight × sub-score).
- ARV discount +11.3/15.0
- Cash flow +10.9/30.0
- Schools +5.5/10.0
- Appreciation +5.0/10.0
- 1% rule +3.2/10.0
- DSCR +3.1/10.0
- Rent growth +2.5/5.0
- Livability +2.5/5.0
- Condition / age +2.5/5.0
$558,888
🖨 Deal sheet 📄 Offer letter ✓ Due diligence
Listing remarks
$91,012.00 price reduction from original price. Please call for details. Owner says SELL. Previous Buyers financial situation changed and could not complete the closing. So BACK ON MARKET. Located in the Windsor section of Robbinsville, this updated Colonial offers 4 bedrooms and 2 full baths. The home features an updated kitchen and bathrooms, main-level laundry, and two-zone heating. Flooring includes Brazilian cherry hardwood throughout the first floor, Italian tile in the kitchen, red oak flooring in the two rear bedrooms, laminate flooring in the front bedroom, and carpet in the primary bedroom. The rear yard includes a saltwater pool, deck, and patios. An oversized one-car garage has
Key facts
- 0.33 acre lot
- Garage
- Pool
Property features AI
Exterior
- Parking: Detached front-entry oversized garage (1 car); Driveway and on-street parking
- Utilities: Public water; Public sewer; Electric service (standard); Propane for hot water
- Home design: Detached structure; Frame construction; Above-grade living space approximately 2,000 finished (estimated); Fee simple ownership
- Construction: Frame construction; Foundation: Other; Built year: estimated
- Exterior features: Chain link fencing; Personal in-ground saltwater pool; Lot approximately 120 x 120 (estimated)
Interior
- Kitchen: Kitchen (no appliance specifics provided)
- Bedrooms: 4 bedrooms on the upper level
- Heating & cooling: Hot water baseboard heating; Oil-fired heating; Propane hot water
- Interior features: Full basement; 8 total rooms (living room, dining room, family room, kitchen, master bedroom, 3 additional bedrooms)
- Laundry & utility: Main floor laundry
Neighborhood map
What this means for you Summary
Snapshot
- This is a 4-bed/?-bath single-family listed at $559k.
Deal economics
- At list price, monthly cash flow is $-250 ($-3k/yr) — negative.
- To cash-flow at today's rent, offer at most $523k (6.5% below list).
- To meet the 1% rule (rent ≥ 1% of price), the offer needs to be $457k (18.2% below list).
- Recommended offer: $457k (18.2% below list) — sets the bar for 1% rule.
- Cap rate 5.8% vs local median 3.1% in Windsor — top-decile yield for the area; either an underpriced asset or a hidden risk that comps aren't pricing in. Stress-test before assuming the spread holds.
Location & tenants
- Location reads: area grade D — affects rentability + tenant quality, not the cash-flow math above.
- Robbinsville Public Schools (rural): math 52% / reading 62% proficiency, ranked #60 of 472 in NJ (top 13%) — acceptable for families but not a draw, mixed tenant base, ~2y average lease; only 2% free/reduced lunch — higher-income household profile.
- Market conditions: 1 active listings in the ZIP; 2 comparable units currently listed for rent nearby; 2,256 units permitted in Mercer County in 2024 (1,303 in 5+ unit buildings).
Forward outlook
- In year one you build about $21k of equity ($4k loan paydown + $17k appreciation (3.0% local appreciation)).
- Mercer County population projected at +4% by 2050 — modest demand growth; plan on rents tracking national, not racing it.
- By year 2, paydown + projected appreciation supports a ~$34k cash-out refi (75% LTV) — recoverable capital for the next deal without selling this one.
Negotiation context
- It's been on market 143 days — a 12% lower offer ($492k) is reasonable based on typical stale-listing flexibility.
- 3 sale attempts; this cycle's ask has dropped $91k (14%) from the opening price — seller is motivated, your offer sets the floor, not the list.
Risks & watch-outs
- Watch-outs: built in 1825 — expect roof / HVAC / electrical / plumbing capex.
- Climate carrying-cost: major wind risk, 27% chance of damaging wind over 30y; extreme-heat days projected 7→15/yr by 2055 (HVAC capex compounding) — expect insurance premiums to compound above CPI over the hold.
Questions for the listing agent
- What do current leases actually rent for vs. the listed asking? Can we see a recent rent roll and the last 12 months of T-12 income?
- It's been on market 143 days. Have you received any prior offers? Is the seller open to a 18% concession, seller financing, or rate buy-down credit?
- Built in 1825 — when were the roof, HVAC, electrical panel, plumbing, and water heater last replaced?
- Why hasn't it sold? Are there any deal-killer items the seller is aware of (foundation, flood, title, zoning, code violations)?
- Is there a deadline driving the sale (1031 exchange, divorce, estate, relocation)? That informs how much negotiation room exists.
- The area grade is low — what's the realistic commute time and amenity access for the typical tenant pool here? Any planned neighborhood developments (good or bad) we should know about?
- What's the average days-on-market for RENTAL listings here right now (not sales)? A rising rental-DOM trend means longer vacancies and softer asking-rent achievability than the comps imply.
- What's the recent tenant-quality profile in this submarket — average credit score on applications, eviction rate, late-payment / NSF rate, and stable-employment percentage? A property-management company in the area should have these aggregated.
- How much new for-sale + rental construction is in the pipeline within 1–3 miles? Heavy new supply typically softens prices + rents 12–24 months out; constrained supply supports both.
Investment metrics
- 1% rule
- 0.82% ✗
- Cap rate
- 5.76%
- Cash-on-cash
- -1.92%
- DSCR
- 0.91
- GRM
- 10.2
CMA / ARV
- ARV (on-the-fly)
- $610,000
- Comps found
- 3
Show comp detail 3 sales within ~0.75 mi
| Address | Dist | Beds/Ba | Sqft | Sold | Price | $/sf | Match |
|---|---|---|---|---|---|---|---|
| 23 Main St N | 0.00mi | 4/— | 2,000 (0%) | 1mo | $480,000 | $240 | 99 |
| 54 Church St | 0.15mi | 3/2.5 (-1) | 1,720 (-14%) | 18mo | $525,000 | $305 | 49 |
| 54 Church St | 0.15mi | 3/2.5 (-1) | 1,720 (-14%) | 18mo | $525,000 | $305 | 49 |
Match score weights: distance 35% · size 25% · config 20% · recency 20%. Top-matched comps best support the ARV.
Projected returns pro-forma
3.0% appreciation · 3.0% rent growth · sell at horizon
- IRR
- 5.7%
- Equity multiple
- 1.33×
- Total profit
- $51,474
- Equity at exit
- $251,300
- IRR
- 8.7%
- Equity multiple
- 2.31×
- Total profit
- $205,738
- Equity at exit
- $387,284
Cash invested: $156,489 (down + closing). Projections, not guarantees.
Landlord ↔ Tenant lean methodology
- Overall (STATE)
- 21 Tenant-Leaning
- State New Jersey
- 21 Tenant-Leaning · D+6
- County
- — inherits STATE
- City
- — inherits STATE
ZIP-level market 08561
- Active inventory
- 1
- Price-to-rent
- 10.2×
Monthly cashflow live
- Estimated rent
- $4,573 medium interval (Pro) →
- Mortgage (P&I)
- −$2,931
- Tax est. 1.5%
- −$699 /mo · $8,383/yr
- Insurance
- −$233
- HOA
- −$0
- Vacancy / Maint / Mgmt
- −$960
- Net cashflow
- $-250
Break-even live
UW: 25.0% down · 7.5% · 30yr · 1.5% tax · 5.0% vac · 8.0% maint · 8.0% mgmt
Financing live
Cash to close
- Down payment
- $139,722
- Closing costs
- $16,767
- Reserves months
- —
- Total cash needed
- —
Loan-product check · same deal, 3 products live
Conventional
25% down · 7.5% · 30yr
- Down + closing
- —
- Monthly P&I
- —
- Monthly cashflow
- —
- DSCR
- —
- Eligible?
- —
Personal DTI + credit; lowest rate.
DSCR
20% down · 8.5% · 30yr
- Down + closing
- —
- Monthly P&I
- —
- Monthly cashflow
- —
- DSCR
- —
- Eligible?
- —
No personal income docs; deal must DSCR.
Hard money
10% down · 12.0% · 12mo
- Down + closing
- —
- Monthly P&I
- —
- Monthly cashflow
- —
- DSCR
- —
- Eligible?
- —
Short-term bridge; refi at stabilization.
Rent comps 2 comps
| Address | Beds | Baths | Sqft | Rent | $/sqft | DOM | Units | Dist |
|---|---|---|---|---|---|---|---|---|
| 105 Samjan Cir Hightstown, NJ | 3.0 | 3.0 | 2934 | $4,500 | $1.53 | 13d | 1 | 1.11mi |
| 4 Samarpan Ct Hightstown, NJ | 3.0 | 3.0 | 2724 | $4,650 | $1.71 | 12d | 1 | 1.27mi |
Listing history 10 events
-
2026-05-20status Pending
-
2026-05-14historical Active Under Contract
-
2026-04-29status Active
-
2026-04-14status Pending
-
2026-03-22price $558,888
-
2026-02-19price $624,900
-
2026-01-14status Active
-
2025-10-26status Pending
-
2025-09-18$649,900 Active
-
2025-09-11historical $649,900
ⓘ Source: listings_history table (triggers on properties + properties_extension) + one-shot
backfill from property_details.listing_events for pre-trigger history.
Climate risk First Street
- Flood 1/10 Low FEMA zone X (unshaded) · 0% chance over 30 yrs
- Wildfire 3/10 Moderate
- Heat 6/10 Major 7 d/yr ≥101°F today · 15 d/yr by 30 yrs out
- Wind 6/10 Major 27% chance of damaging wind over 30 yrs
- Air quality 4/10 Moderate 5 unhealthy d/yr today · 6 by 30 yrs out
Nearby sold comps map
Loading sold comps map…
Walkable amenities ~0.75 mi
Loading nearby amenities…
Taxation est. · year 1
- Rental income
- $54,872
- − Mortgage interest
- −$31,306
- − Property taxes
- −$8,383
- − Insurance
- −$2,794
- − Repairs & maintenance
- −$4,390
- − Management
- −$4,390
- − Depreciation
- −$16,259
- Taxable loss
- −$12,651
- Est. tax savings @ 24.0%
- +$3,036
- After-tax cash flow
- $36/yr
For passive investors: Depreciation is non-cash, so a rental often shows a tax loss while cash-flowing — sheltering income. Rental losses are passive: they offset passive income freely, and up to $25,000/yr can offset ordinary (W-2) income if you actively participate and your MAGI is under $100k (phasing out to $0 by $150k); unused losses carry forward. On sale, claimed depreciation is recaptured at up to 25%, and gains may owe capital-gains tax (a 1031 exchange can defer both). Figures are a year-1 estimate at your 24.0% rate — not tax advice; consult a CPA.
Schools (NCES district)
- District
- Robbinsville Public Schools
- NCES district ID
- 3417100
- Math proficiency
- 52% ▼ -16.00%
- Reading proficiency
- 62% ▼ -12.00%
- Median HH income
- $113,037
- Composite
- 54.58/100
- National rank
- #1339
- State rank
- #60 of 472 in NJ
Livability — Windsor
No livability data for this city. (Only ~50 U.S. cities are tracked.)
Census & demographics
- Census place
- Windsor, NJ
- City population
- 381
- Population (ZIP)
- 381
Population outlook (Mercer County) Hauer SSP2
- Today (2025)
- 381,395 people
- By 2030
- 384,640 · +0.9%
- By 2040
- 391,431 · +2.6%
- By 2050
- 397,845 · +4.3%
- By 2075
- 417,281 · +9.4%
- By 2100
- 420,327 · +10.2%
Race, ethnicity, and origin ACS 2023
- Neighborhood character
- Predominantly White (66%)
- Race & ethnicity
- White 66% Hispanic / Latino 24% Asian 10%
- Hispanic origin (detail)
- Puerto Rican 4% Dominican 20%
- Common ancestry
- Portuguese 3%
- Foreign-born
- 22% · Canada
- Languages at home
- 80% English-only · Spanish 20%
Political lean MEDSL · Mercer
- 2024 margin
- Solid D (+33.9) · D 65.9% · R 32.0% · Other 2.1%
- 2008→2024 swing
- -2.2pp toward R · 2008: 36.1pp · 2024: 33.9pp
- All cycles
- 2024: D+33.9 2020: D+40.0 2016: D+36.2 2012: D+36.8 2008: D+36.1
Not yet ingested
- Civics
- —
Market trends
- HPI YoY
- —
- Current HPI
- —
- Rent YoY
- —
- Metro
- —
- State GDP YoY
- ▲ 2.05%
- F500 in state
- 34
Industry mix (Fortune 500 HQ in NJ)
| Industry | F500 HQs | Revenue |
|---|---|---|
| Consumer Goods | 3 | $31B |
|
||
| Pharmaceuticals | 2 | $153B |
|
||
| Technology | 2 | $21B |
|
||
| Insurance | 2 | $20B |
|
||
| Healthcare | 2 | $19B |
|
||
| Financial Services | 1 | $70B |
|
||
Price history
-14.0% since first listed10 events — show timeline
- 2026-05-20 Pending — BRIGHT MLS
- 2026-05-14 Contingent — BRIGHT MLS
- 2026-04-29 Relisted — BRIGHT MLS
- 2026-04-14 Pending — BRIGHT MLS
- 2026-03-22 Price Changed $558,888 BRIGHT MLS
- 2026-02-19 Price Changed $624,900 BRIGHT MLS
- 2026-01-14 Relisted — BRIGHT MLS
- 2025-10-26 Pending — BRIGHT MLS
- 2025-09-18 Listed $649,900 BRIGHT MLS
- 2025-09-11 Coming Soon $649,900 BRIGHT MLS
Cash-flow waterfall
monthlySold comps — $/sqft
last 12 mo · ≤1 miLoading sold comps…