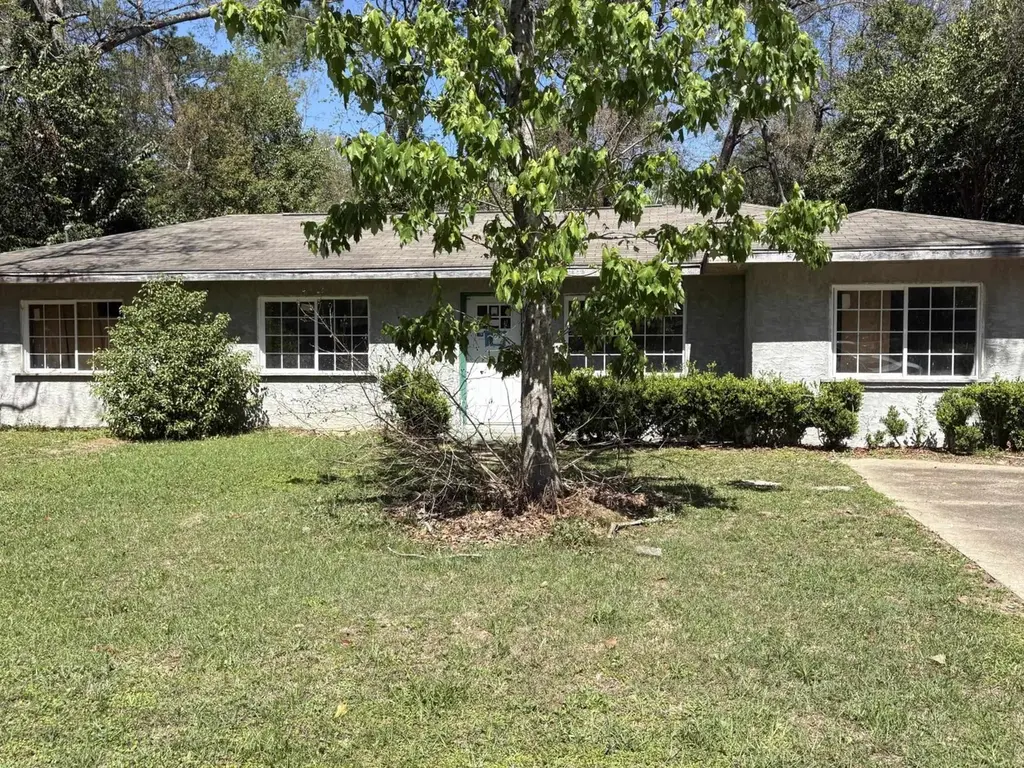
702 Apache St · Tallahassee, FL
Flood risk 1/10 · Minimal
- FEMA flood zone
- AE
- Chance of flooding over 30 yrs
- 0.0%
- Est. flood insurance / yr
- $1,737 – $8,500
Fire risk 3/10 · Minor
- Est. fire insurance / yr
- $947 – $1,759
Heat risk 8/10 · Major
- Hot days now (above 108°F)
- 7 days/yr
- Hot days in 30 yrs
- 20 days/yr
Wind risk 9/10 · Severe
- Chance of severe wind over 30 yrs
- 99.0%
Air-quality risk 4/10 · Minor
- Unhealthy air days now
- 5 days/yr
- Unhealthy air days in 30 yrs
- 6 days/yr
Risk factors via First Street. Map © Google.
Why this score? — see what drove the B grade
The composite is a weighted blend of 9 inputs, each scored 0–100. Each bar is that input's sub-score; the figure is the points it added to the 100-point composite (weight × sub-score).
- Cash flow +30.0/30.0
- 1% rule +10.0/10.0
- DSCR +10.0/10.0
- ARV discount +7.5/15.0
- Schools +4.3/10.0
- Livability +4.3/5.0
- Rent growth +3.5/5.0
- Condition / age +2.5/5.0
- Appreciation +0.0/10.0
$80,000
🖨 Deal sheet (PDF) 📄 Offer letter ✓ Due diligence
Listing remarks
NEW PRICE! Presenting a prime opportunity in Apalachee Ridge: This block home is ready for completion and offers a blank slate for investors or homeowners seeking a project. Renovations have started, with the property framed for a spacious three or four bedroom, two bathroom layout. Recent updates include select plumbing and electrical enhancements. Conveniently located just off Orange Avenue, this residence has the potential to become an exceptional home or a rental. Schedule a showing today to explore the possibilities!
Key facts
- 9,583 sq ft lot
- Parking
- Built 1959
Property features AI
Finance
- Financial info: Offered for sale
Exterior
- Parking: Driveway
- Home design: Single-story home
- Construction: Block and concrete construction; Slab foundation
- Exterior features: Paved road access; Lot dimensions approximately 79 x 121 x 79 x 121
Interior
- Kitchen: Kitchen: 12x12
- Bedrooms: Bedroom 2: 12x12; Bedroom 3: 12x12
- Bathrooms: 2 full bathrooms
- Interior features: No additional interior features listed
Neighborhood map
What this means for you Summary
Snapshot
- This is a 3-bed/2.0-bath single-family listed at $80k.
Deal economics
- At list price, monthly cash flow is $253 ($3k/yr) — positive.
- The deal already cash-flows at list — no discount required.
- Meets the 1% rule at list price ($2k rent vs $80k).
- Recommended offer: $75k (6.0% below list) — sets the bar for market timing.
- Cap rate 16.5% vs local median 4.2% in Tallahassee — top-decile yield for the area; either an underpriced asset or a hidden risk that comps aren't pricing in. Stress-test before assuming the spread holds.
Location & tenants
- Location reads 86/100 on livability (#19 in FL, #429 nationally) — a professional / high-income tenant draw. Strengths: amenities A+, commute A+, health & safety A+; Watch: employment D.
- Leon (urban): math 48% / reading 53% proficiency, ranked #33 of 73 in FL (top 45%) — acceptable for families but not a draw, mixed tenant base, ~2y average lease.
- Zoned schools: Bond Elementary School (math 38% / reading 27%, grade F, #1,787 of 2,144 statewide, top 84%, 536 students, 84% FRL); Fairview Middle School (math 44% / reading 46%, grade D, #310 of 571 statewide, top 56%, 747 students, 58% FRL); James Rickards High School (math 23% / reading 37%, grade F, #441 of 667 statewide, top 67%, 1,581 students, 57% FRL) — zoned schools average 66% FRL vs 45% district-wide (22 pts higher); higher-poverty schools than district average — tighter screening recommended.
- Zoned-school proficiency averages 36% at this address vs 50% district-wide (-15 pts) — the specific schools serving this property underperform the Leon average; the district grade overstates school quality for this exact location.
- Market conditions: Rents rising fast (+4.2%/yr); 121 active listings in the ZIP; 20 comparable units currently listed for rent nearby; rentals at typical pace (median 23d on market — plan ~3-4 weeks tenant-placement turnaround); 1,765 units permitted in Leon County in 2024 (975 in 5+ unit buildings).
Forward outlook
- Local home prices are declining (-3.0%/yr); year-one equity from $553 of loan paydown is wiped out by about $2k of value loss. Plan a longer hold.
- Leon County population projected at +23% by 2050 — long-run rental-demand tailwind backs the buy-and-hold thesis.
- At projected returns (-3.0% appreciation + 4.2% rent growth), your $22k cash investment doubles in ~8 years — after that, you're playing with house money.
Negotiation context
- It's been on market 74 days — a 6% lower offer ($75k) is reasonable based on typical stale-listing flexibility.
- 2 sale attempts since 3y ago; this cycle's ask has dropped $10k (11%) from the opening price — seller is motivated, your offer sets the floor, not the list.
Risks & watch-outs
- Watch-outs: flood insurance adds $427/mo; built in 1959 — expect roof / HVAC / electrical / plumbing capex.
- Climate carrying-cost: in FEMA flood zone AE (mandatory federal flood insurance); severe wind risk, 99% chance of damaging wind over 30y; extreme-heat days projected 7→20/yr by 2055 (HVAC capex compounding) — expect insurance premiums to compound above CPI over the hold.
Questions for the listing agent
- It's been on market 74 days. Have you received any prior offers? Is the seller open to a 6% concession, seller financing, or rate buy-down credit?
- Built in 1959 — when were the roof, HVAC, electrical panel, plumbing, and water heater last replaced?
- What's the actual annual flood-insurance premium (NFIP or private), and is the property in a SFHA with mandatory coverage?
- Why hasn't it sold? Are there any deal-killer items the seller is aware of (foundation, flood, title, zoning, code violations)?
- Is there a deadline driving the sale (1031 exchange, divorce, estate, relocation)? That informs how much negotiation room exists.
- Schools are B-rated — typically a magnet for longer-tenancy family renters. What's the average tenant stay here, and is there a school-zone premium baked into asking?
- What's the average days-on-market for RENTAL listings here right now (not sales)? A rising rental-DOM trend means longer vacancies and softer asking-rent achievability than the comps imply.
- What's the recent tenant-quality profile in this submarket — average credit score on applications, eviction rate, late-payment / NSF rate, and stable-employment percentage? A property-management company in the area should have these aggregated.
- How much new for-sale + rental construction is in the pipeline within 1–3 miles? Heavy new supply typically softens prices + rents 12–24 months out; constrained supply supports both.
Investment metrics
- 1% rule
- 1.98% ✓
- Cap rate
- 16.48%
- Cash-on-cash
- 36.40%
- DSCR
- 2.62
- GRM
- 4.2
CMA / ARV
- ARV (on-the-fly)
- $206,739
- Comps found
- 12
Show comp detail 12 sales within ~0.75 mi
| Address | Dist | Beds/Ba | Sqft | Sold | Price | $/sf | Match |
|---|---|---|---|---|---|---|---|
| 3010 Prospect St | 0.34mi | 3/2.0 | 1,264 (+4%) | 1mo | $210,000 | $166 | 76 |
| 925 Splendor Rd | 0.34mi | 3/2.0 | 1,200 (-1%) | 10mo | $230,000 | $192 | 75 |
| 2438 King St | 0.39mi | 3/1.0 | 1,143 (-6%) | 2mo | $75,000 | $66 | 67 |
| 2452 King St | 0.36mi | 2/1.0 (-1) | 1,250 (+3%) | 2mo | $125,000 | $100 | 67 |
| 3101 Prospect St | 0.36mi | 4/2.0 (+1) | 1,255 (+4%) | 7mo | $235,000 | $187 | 66 |
| 2404 Dozier Dr | 0.46mi | 4/2.0 (+1) | 1,221 (+1%) | 12mo | $215,000 | $176 | 62 |
| 408 E Magnolia Dr | 0.68mi | 4/2.0 (+1) | 1,196 (-1%) | 12mo | $85,000 | $71 | 52 |
| 400 Lewis St | 0.74mi | 4/2.0 (+1) | 1,283 (+6%) | 1mo | $169,000 | $132 | 49 |
| 516 Castlewood Dr | 0.25mi | 4/2.0 (+1) | 1,040 (-14%) | 15mo | $215,000 | $207 | 48 |
| 1329 Lola Dr | 0.67mi | 3/1.5 | 1,083 (-10%) | 6mo | $185,000 | $171 | 44 |
| 3222 Beacon St | 0.59mi | 3/1.5 | 1,341 (+11%) | 11mo | $237,000 | $177 | 43 |
| 512 Norma St | 0.49mi | 4/2.0 (+1) | 1,076 (-11%) | 16mo | $140,000 | $130 | 41 |
Match score weights: distance 35% · size 25% · config 20% · recency 20%. Top-matched comps best support the ARV.
Projected returns pro-forma
-3.0% appreciation · 4.16% rent growth · sell at horizon
- IRR
- 6.0%
- Equity multiple
- 1.24×
- Total profit
- $5,308
- Equity at exit
- $11,928
- IRR
- 17.1%
- Equity multiple
- 2.54×
- Total profit
- $34,413
- Equity at exit
- $6,917
Cash invested: $22,400 (down + closing). Projections, not guarantees.
Landlord ↔ Tenant lean methodology
- Overall (STATE)
- 87 Strongly Landlord-Friendly
- State Florida
- 87 Strongly Landlord-Friendly · R+3
- County
- — inherits STATE
- City
- — inherits STATE
ZIP-level market 32301
- Rents YoY
- 4.2%
- Active inventory
- 121
- Price-to-rent
- 4.2×
Monthly cashflow live
- Estimated rent
- $1,582 high interval (Pro) →
- Mortgage (P&I)
- −$420
- Tax from tax record
- −$117 /mo · $1,406/yr
- Insurance
- −$33
- Flood insurance flood zone
- −$427 /mo · $5,118/yr
- HOA
- −$0
- Vacancy / Maint / Mgmt
- −$332
- Net cashflow
- $253
Break-even live
Sensitivity live
| Price | -10% $298 | -5% $276 | +0% $253 | +5% $230 | +10% $208 |
|---|---|---|---|---|---|
| Rent | -10% $128 | -5% $190 | +0% $253 | +5% $315 | +10% $378 |
| Rate | -1.0pp $293 | -0.5pp $273 | base $253 | +0.5pp $232 | +1.0pp $211 |
UW: 25.0% down · 7.5% · 30yr · 1.5% tax · 5.0% vac · 8.0% maint · 8.0% mgmt
Financing live
Cash to close
- Down payment
- $20,000
- Closing costs
- $2,400
- Reserves months
- —
- Total cash needed
- —
Loan-product check · same deal, 3 products live
Conventional
25% down · 7.5% · 30yr
- Down + closing
- —
- Monthly P&I
- —
- Monthly cashflow
- —
- DSCR
- —
- Eligible?
- —
Personal DTI + credit; lowest rate.
DSCR
20% down · 8.5% · 30yr
- Down + closing
- —
- Monthly P&I
- —
- Monthly cashflow
- —
- DSCR
- —
- Eligible?
- —
No personal income docs; deal must DSCR.
Hard money
10% down · 12.0% · 12mo
- Down + closing
- —
- Monthly P&I
- —
- Monthly cashflow
- —
- DSCR
- —
- Eligible?
- —
Short-term bridge; refi at stabilization.
Rent comps 20 comps
| Address | Beds | Baths | Sqft | Rent | $/sqft | DOM | Units | Dist |
|---|---|---|---|---|---|---|---|---|
| 735 Putnam Dr #2 Tallahassee, FL | 3.0 | 2.5 | 1396 | $1,650 | $1.18 | 15d | 1 | 0.37mi |
| 3005 S Meridian St Tallahassee, FL | 3.0 | 1.0 | 998 | $2,300 | $2.30 | 23d | 1 | 0.37mi |
| 401 Putnam Dr Tallahassee, FL | 1.0–2.0 | 1.0–2.0 | 766 | $1,250 | $1.63 | 23d | 1 | 0.47mi |
| 2873 Jim Lee Rd Tallahassee, FL | 2.0 | 2.0 | 1000 | $925 | $0.93 | 23d | 1 | 0.51mi |
| 2218 Magnolia Cir Tallahassee, FL | 1.0–2.0 | 1.0–2.0 | 700 | $1,200 | $1.71 | 23d | 7 | 0.71mi |
| 2205 Magnolia Cir Tallahassee, FL | 1.0–2.0 | 1.0–2.0 | 750 | $1,225 | $1.63 | 15d | 9 | 0.71mi |
| 2205 Magnolia Cir Tallahassee, FL | 1.0–2.0 | 1.0–2.0 | 750 | $1,225 | $1.63 | 23d | 1 | 0.71mi |
| 3000 S Adams St Tallahassee, FL | 1.0–3.0 | 1.0–3.0 | 884 | $1,850 | $2.09 | 23d | 8 | 0.75mi |
| 418 Perkins St Tallahassee, FL | 4.0 | 2.0 | 1497 | $1,850 | $1.24 | 23d | 1 | 0.85mi |
| 301 Gaile Ave Tallahassee, FL | 3.0 | 1.0 | 1009 | $1,400 | $1.39 | 15d | 1 | 0.93mi |
| 916 Saddle Creek Run Tallahassee, FL | 4.0 | 2.0 | 1399 | $1,750 | $1.25 | 15d | 1 | 0.95mi |
| 509 Famcee Ave Tallahassee, FL | 3.0 | 2.0 | 1079 | $1,700 | $1.58 | 23d | 1 | 1.13mi |
| 1730 Beechwood Cir N Tallahassee, FL | 2.0 | 2.5 | 1216 | $1,500 | $1.23 | 23d | 1 | 1.14mi |
| 1737 S M L King Jr Blvd Tallahassee, FL | 3.0 | 1.0 | 701 | $1,450 | $2.07 | 23d | 1 | 1.19mi |
| 4787 Cypress Brooke Way Tallahassee, FL | 3.0 | 2.0 | 1220 | $1,799 | $1.47 | 23d | 1 | 1.25mi |
| 1504 S Adams St #1 Tallahassee, FL | 2.0 | 2.0 | 1088 | $1,300 | $1.19 | 15d | 1 | 1.34mi |
| 1412 Ramble Brk Unit C Tallahassee, FL | 2.0 | 1.0 | 950 | $1,050 | $1.11 | 23d | 1 | 1.34mi |
| 1411 Lazy Brk Unit D Tallahassee, FL | 2.0 | 1.0 | 950 | $1,150 | $1.21 | 23d | 1 | 1.35mi |
| 1533 S Bronough St Tallahassee, FL | 2.0 | 1.0 | 750 | $1,150 | $1.53 | 15d | 1 | 1.35mi |
| 635 Palm Beach St Apt 125 Tallahassee, FL | 2.0 | 2.0 | 900 | $900 | $1.00 | 23d | 1 | 1.42mi |
Listing history 21 events
-
2026-06-22days on market $80,000 Active 74 DOM
-
2026-06-18remarks 527-char remark
-
2026-06-18pricedays on market $80,000 Active 71 DOM
-
2026-06-17days on market $85,000 Active 70 DOM
-
2026-06-16days on market $85,000 Active 69 DOM
-
2026-06-15days on market $85,000 Active 68 DOM
-
2026-06-14days on market $85,000 Active 66 DOM
-
2026-06-10days on market $85,000 Active 63 DOM
-
2026-06-09days on market $85,000 Active 62 DOM
-
2026-06-08days on market $85,000 Active 61 DOM
-
2026-06-07days on market $85,000 Active 60 DOM
-
2026-06-05days on market $85,000 Active 57 DOM
-
2026-06-03days on market $85,000 Active 56 DOM
-
2026-06-02days on market $85,000 Active 55 DOM
-
2026-06-01days on market $85,000 Active 54 DOM
-
2026-05-31days on market $85,000 Active 53 DOM
-
2026-05-30days on market $85,000 Active 52 DOM
-
2026-05-13price $85,000
-
2026-04-08$90,000 Active
-
2023-07-25historical
-
2023-07-11$235,000
ⓘ Source: listings_history table (triggers on properties + properties_extension) + one-shot
backfill from property_details.listing_events for pre-trigger history.
Tax reassessment forecast FL · Resets to sale price
- Current annual tax
- $1,406 · $117/mo
- Projected year-2 tax
- $1,406 · $117/mo
- Expected delta
- $0/yr ($0/mo · 0.0%)
ⓘ Screening estimate from a state-policy table — verify with the county assessor before closing.
Climate risk First Street
- Flood 1/10 Low FEMA zone AE · 0% chance over 30 yrs
- Wildfire 3/10 Moderate
- Heat 8/10 Severe 7 d/yr ≥108°F today · 20 d/yr by 30 yrs out
- Wind 9/10 Extreme 99% chance of damaging wind over 30 yrs
- Air quality 4/10 Moderate 5 unhealthy d/yr today · 6 by 30 yrs out
Nearby sold comps map
Loading sold comps map…
Walkable amenities ~0.75 mi
Loading nearby amenities…
Taxation est. · year 1
- Rental income
- $18,980
- − Mortgage interest
- −$4,481
- − Property taxes
- −$1,406
- − Insurance
- −$5,518
- − Repairs & maintenance
- −$1,518
- − Management
- −$1,518
- − Depreciation
- −$2,327
- Taxable income
- $2,210
- Est. tax owed @ 24.0%
- −$530
- After-tax cash flow
- $2,505/yr
For passive investors: Depreciation is non-cash, so a rental often shows a tax loss while cash-flowing — sheltering income. Rental losses are passive: they offset passive income freely, and up to $25,000/yr can offset ordinary (W-2) income if you actively participate and your MAGI is under $100k (phasing out to $0 by $150k); unused losses carry forward. On sale, claimed depreciation is recaptured at up to 25%, and gains may owe capital-gains tax (a 1031 exchange can defer both). Figures are a year-1 estimate at your 24.0% rate — not tax advice; consult a CPA.
Schools (NCES district)
- District
- Leon
- NCES district ID
- 1201110
- Math proficiency
- 48% ▼ -13.00%
- Reading proficiency
- 53% ▼ -5.00%
- Median HH income
- $46,339
- Composite
- 42.84/100
- National rank
- #3131
- State rank
- #33 of 73 in FL
Livability — Tallahassee
- Score
- 86/100
- State rank
- #19
- US rank
- #429
Category grades
Schools grade is shown separately in the Schools card above.
Census & demographics
- Census place
- Tallahassee, FL
- County
- Leon County · 294,472 people
- City population
- 294,472
- Metro
- Tallahassee, FL
- Population (ZIP)
- 32,017
- Household income
- $50,942
- Rent vs Own
- Severe rent burden
- 2625.0
Population outlook (Leon County) Hauer SSP2
- Today (2025)
- 315,507 people
- By 2030
- 330,677 · +4.8%
- By 2040
- 358,465 · +13.6%
- By 2050
- 386,804 · +22.6%
- By 2075
- 465,480 · +47.5%
- By 2100
- 519,959 · +64.8%
Race, ethnicity, and origin ACS 2023
- Neighborhood character
- Diverse neighborhood (Simpson 0.61)
- Race & ethnicity
- Black 49% White 38% Hispanic / Latino 6% Two or more races 6% Asian 3%
- Hispanic origin (detail)
- Puerto Rican 1% Cuban 1%
- Common ancestry
- Slovak 2% Romanian 1% Lithuanian 1%
- Foreign-born
- 7% · Canada, China, Vietnam
- Languages at home
- 91% English-only · Spanish 4% Other Indo-European 1% French/Haitian/Cajun 1%
Political lean MEDSL · Leon
- 2024 margin
- Strong D (+21.8) · D 60.3% · R 38.5% · Other 1.2%
- 2008→2024 swing
- -2.5pp toward R · 2008: 24.3pp · 2024: 21.8pp
- All cycles
- 2024: D+21.8 2020: D+28.3 2016: D+25.1 2012: D+23.6 2008: D+24.3
Not yet ingested
- Civics
- —
Market trends
- HPI YoY
- ▼ -231.50%
- Current HPI
- 231.103
- Rent YoY
- ▲ 4.16%
- Metro
- Tallahassee, FL
- State GDP YoY
- ▲ 3.28%
- F500 in state
- 36
Industry mix (Fortune 500 HQ in FL)
| Industry | F500 HQs | Revenue |
|---|---|---|
| Industrial Technology | 2 | $29B |
|
||
| Insurance | 2 | $17B |
|
||
| Retail | 1 | $60B |
|
||
| Technology Distribution | 1 | $58B |
|
||
| Homebuilding | 1 | $35B |
|
||
| Technology Manufacturing | 1 | $35B |
|
||
Price history
-63.8% since first listed4 events — show timeline
- 2026-05-13 Price Changed $85,000 CATRS
- 2026-04-08 Listed $90,000 CATRS
- 2023-07-25 Listing Removed — CATRS
- 2023-07-11 Listed $235,000 CATRS
Property tax history
+4.9%/yrLatest (2025): $1,406 · +7.6% YoY. Source: county tax records.
Cash-flow waterfall
monthlySold comps — $/sqft
last 12 mo · ≤1 miLoading sold comps…