 Fourplex
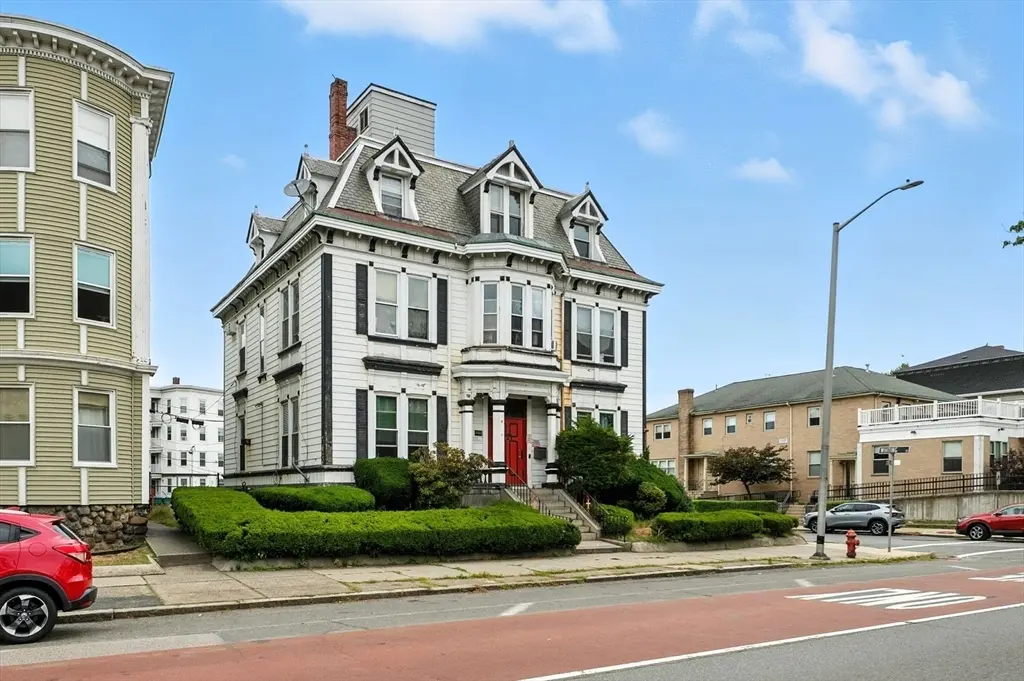
121 N Common · Lynn, MA
Flood risk 6/10 · Moderate
- FEMA flood zone
- X (unshaded)
- Chance of flooding over 30 yrs
- 0.72%
- Est. flood insurance / yr
- $473 – $860
Fire risk 1/10 · Minimal
- Est. fire insurance / yr
- $915 – $1,699
Heat risk 6/10 · Moderate
- Hot days now (above 96°F)
- 7 days/yr
- Hot days in 30 yrs
- 15 days/yr
Wind risk 6/10 · Moderate
- Chance of severe wind over 30 yrs
- 72.0%
Air-quality risk 3/10 · Minor
- Unhealthy air days now
- 3 days/yr
- Unhealthy air days in 30 yrs
- 3 days/yr
Risk factors via First Street. Map © Google.
Why this score? — see what drove the C grade
The composite is a weighted blend of 9 inputs, each scored 0–100. Each bar is that input's sub-score; the figure is the points it added to the 100-point composite (weight × sub-score).
- Cash flow +23.9/30.0
- DSCR +7.7/10.0
- ARV discount +7.7/15.0
- 1% rule +6.2/10.0
- Condition / age +4.0/5.0
- Livability +3.8/5.0
- Rent growth +2.7/5.0
- Schools +1.7/10.0
- Appreciation +0.0/10.0
$999,000
🖨 Deal sheet 📄 Offer letter ✓ Due diligence
Multi-family units
County records classify this as Multi-Family (5+ Unit). Listing-text estimate: 4 units. estimate disagrees with records
5+ unit building — per-unit beds/baths from public records are typically unavailable; the breakdown below (if shown) is an estimate from the listing text.
Listing remarks MLS
Situated at 121 N Common, Lynn, MA, United States, this multi-family property, constructed in 1890, represents a distinguished opportunity within its locale. The expansive interior encompasses 4982 square feet of living area, providing generous dimensions for various configurations. Within this substantial dwelling, thirteen distinct bedrooms offer extensive private quarters, each providing personal retreats for occupants. Complementing these private spaces are three full bathrooms and three convenient half bathrooms, providing essential amenities throughout the residence. The property occupies a significant lot area of 5158 square feet, establishing a defined outdoor presence that enhances the overall appeal of this substantial multi-family property. Schedule a private showing today.
Key facts
- 5,158 sq ft lot
- 6 parking spots
- Built 1890
Neighborhood map
What this means for you Summary
Snapshot
- This is a 4 × 3-bed/?-bath units multifamily listed at $999k. Condition is rated good.
Deal economics
- At list price, monthly cash flow is $2k ($23k/yr) — positive. Per door: $486/mo.
- The deal already cash-flows at list — no discount required.
- Meets the 1% rule at list price ($11k rent vs $999k).
- Recommended offer: $939k (6.0% below list) — sets the bar for market timing.
- Cap rate 8.6% vs local median 3.6% in Lynn — top-decile yield for the area; either an underpriced asset or a hidden risk that comps aren't pricing in. Stress-test before assuming the spread holds.
Location & tenants
- Location reads 75/100 on livability (#74 in MA, #4,077 nationally) — a middle-class / working-renter tenant base. Strengths: commute A+, health & safety A+, housing B+; Watch: amenities C-, schools D+, crime D-.
- Lynn (suburban): math 14% / reading 25% proficiency, ranked #293 of 302 in MA (top 97%) — low school quality limits family demand, transient renter base, plan for 1-2y turnover; 73% free/reduced lunch — lower-income household profile, screen leases tightly.
- Market conditions: Rents flat; 51 active listings in the ZIP; 1,032 units permitted in Essex County in 2024 (590 in 5+ unit buildings).
- At $11,201/mo this rent would consume 200% of the median local household income ($67k/yr) (locally 3883% of renters already pay >50% of income on rent) — very limited rent-growth headroom before tenants either downsize or default.
Forward outlook
- Local home prices are declining (-3.0%/yr); year-one equity from $7k of loan paydown is wiped out by about $30k of value loss. Plan a longer hold.
- Essex County population projected at +15% by 2050 — long-run rental-demand tailwind backs the buy-and-hold thesis.
Negotiation context
- It's been on market 88 days — a 6% lower offer ($939k) is reasonable based on typical stale-listing flexibility.
Risks & watch-outs
- Watch-outs: built in 1890 — expect roof / HVAC / electrical / plumbing capex.
- Climate carrying-cost: major flood risk; major wind risk, 72% chance of damaging wind over 30y; extreme-heat days projected 7→15/yr by 2055 (HVAC capex compounding) — expect insurance premiums to compound above CPI over the hold.
Questions for the listing agent
- It's been on market 88 days. Have you received any prior offers? Is the seller open to a 6% concession, seller financing, or rate buy-down credit?
- Can we see the unit-by-unit rent roll, current vacancy, and any below-market leases? What's the average tenancy length?
- What capital expenditures (roof, boiler, parking lot, exteriors) have been made in the last 5 years, and what's planned in the next 2?
- Built in 1890 — when were the roof, HVAC, electrical panel, plumbing, and water heater last replaced?
- Why hasn't it sold? Are there any deal-killer items the seller is aware of (foundation, flood, title, zoning, code violations)?
- Is there a deadline driving the sale (1031 exchange, divorce, estate, relocation)? That informs how much negotiation room exists.
- Schools are D-rated, which usually means shorter tenancies and higher turnover. Who's the typical renter profile here, and what's been the actual vacancy rate?
- Crime grade is D in this area — have there been break-ins, vandalism, or insurance claims at this property in the last 3 years? What carrier currently insures it and at what premium?
- What's the average days-on-market for RENTAL listings here right now (not sales)? A rising rental-DOM trend means longer vacancies and softer asking-rent achievability than the comps imply.
- What's the recent tenant-quality profile in this submarket — average credit score on applications, eviction rate, late-payment / NSF rate, and stable-employment percentage? A property-management company in the area should have these aggregated.
- How much new apartment / multifamily construction is in the pipeline within 1–3 miles? Heavy new supply (>2% of stock underway) typically softens rents 12–24 months out; light construction supports rent growth.
Investment metrics
- 1% rule
- 1.12% ✓
- Cap rate
- 8.63%
- Cash-on-cash
- 8.34%
- DSCR
- 1.37
- GRM
- 7.4
CMA / ARV
- ARV (median comp)
- $1,003,135
- List price
- $999,000
- Delta
- -0.41%
- Verdict
- FAIR
- Comps
- 20 within 1.0 mi
Projected returns pro-forma
-3.0% appreciation · 0.67% rent growth · sell at horizon
- IRR
- -6.3%
- Equity multiple
- 0.77×
- Total profit
- $-63,502
- Equity at exit
- $148,954
- IRR
- 0.3%
- Equity multiple
- 1.02×
- Total profit
- $4,395
- Equity at exit
- $86,375
Cash invested: $279,720 (down + closing). Projections, not guarantees.
Landlord ↔ Tenant lean methodology
- Overall (STATE)
- 20 Strongly Tenant-Friendly
- State Massachusetts
- 20 Strongly Tenant-Friendly · D+15
- County
- — inherits STATE
- City
- — inherits STATE
ZIP-level market 01902
- Rents YoY
- 0.7%
- Active inventory
- 51
- Price-to-rent
- 29.7×
Monthly cashflow live
- Estimated rent
- $11,201 high interval (Pro) →
- Mortgage (P&I)
- −$5,239
- Tax est. 1.5%
- −$1,249 /mo · $14,985/yr
- Insurance
- −$416
- HOA
- −$0
- Vacancy / Maint / Mgmt
- −$2,352
- Net cashflow
- $1,945
Break-even live
4-unit breakdown (identical units grouped — click to expand)
| Units | Beds | Baths | Est. rent |
|---|---|---|---|
| 4× units | 3 | — | $11,200 |
| #1 | 3 | — | $2,800 |
| #2 | 3 | — | $2,800 |
| #3 | 3 | — | $2,800 |
| #4 | 3 | — | $2,800 |
| Total (4 units) | $11,201 | ||
UW: 25.0% down · 7.5% · 30yr · 1.5% tax · 5.0% vac · 8.0% maint · 8.0% mgmt
Financing live
Cash to close
- Down payment
- $249,750
- Closing costs
- $29,970
- Reserves months
- —
- Total cash needed
- —
Loan-product check · same deal, 3 products live
Conventional
25% down · 7.5% · 30yr
- Down + closing
- —
- Monthly P&I
- —
- Monthly cashflow
- —
- DSCR
- —
- Eligible?
- —
Personal DTI + credit; lowest rate.
DSCR
20% down · 8.5% · 30yr
- Down + closing
- —
- Monthly P&I
- —
- Monthly cashflow
- —
- DSCR
- —
- Eligible?
- —
No personal income docs; deal must DSCR.
Hard money
10% down · 12.0% · 12mo
- Down + closing
- —
- Monthly P&I
- —
- Monthly cashflow
- —
- DSCR
- —
- Eligible?
- —
Short-term bridge; refi at stabilization.
Listing history 16 events
-
2026-06-18days on market $999,000 Active 88 DOM
-
2026-06-17days on market $999,000 Active 87 DOM
-
2026-06-16days on market $999,000 Active 86 DOM
-
2026-06-15days on market $999,000 Active 85 DOM
-
2026-06-13days on market $999,000 Active 83 DOM
-
2026-06-13days on market $999,000 Active 82 DOM
-
2026-06-09days on market $999,000 Active 79 DOM
-
2026-06-08statusdays on market $999,000 Active 78 DOM
-
2026-06-07pricestatusdays on market $999,000 Price Changed 77 DOM
-
2026-06-04days on market $1,099,000 Active 74 DOM
-
2026-06-03days on market $1,099,000 Active 73 DOM
-
2026-06-02days on market $1,099,000 Active 72 DOM
-
2026-06-01days on market $1,099,000 Active 71 DOM
-
2026-05-31days on market $1,099,000 Active 70 DOM
-
2026-04-11price $1,099,000 795-char remark
Show marketing remark (795 chars)
Situated at 121 N Common, Lynn, MA, United States, this multi-family property, constructed in 1890, represents a distinguished opportunity within its locale. The expansive interior encompasses 4982 square feet of living area, providing generous dimensions for various configurations. Within this substantial dwelling, thirteen distinct bedrooms offer extensive private quarters, each providing personal retreats for occupants. Complementing these private spaces are three full bathrooms and three convenient half bathrooms, providing essential amenities throughout the residence. The property occupies a significant lot area of 5158 square feet, establishing a defined outdoor presence that enhances the overall appeal of this substantial multi-family property. Schedule a private showing today.
-
2026-03-22$1,149,900 New 795-char remark
Show marketing remark (795 chars)
Situated at 121 N Common, Lynn, MA, United States, this multi-family property, constructed in 1890, represents a distinguished opportunity within its locale. The expansive interior encompasses 4982 square feet of living area, providing generous dimensions for various configurations. Within this substantial dwelling, thirteen distinct bedrooms offer extensive private quarters, each providing personal retreats for occupants. Complementing these private spaces are three full bathrooms and three convenient half bathrooms, providing essential amenities throughout the residence. The property occupies a significant lot area of 5158 square feet, establishing a defined outdoor presence that enhances the overall appeal of this substantial multi-family property. Schedule a private showing today.
ⓘ Source: listings_history table (triggers on properties + properties_extension) + one-shot
backfill from property_details.listing_events for pre-trigger history.
Climate risk First Street
- Flood 6/10 Major FEMA zone X (unshaded) · 72% chance over 30 yrs
- Wildfire 1/10 Low
- Heat 6/10 Major 7 d/yr ≥96°F today · 15 d/yr by 30 yrs out
- Wind 6/10 Major 72% chance of damaging wind over 30 yrs
- Air quality 3/10 Moderate 3 unhealthy d/yr today · 3 by 30 yrs out
Nearby sold comps map
Loading sold comps map…
Walkable amenities ~0.75 mi
Loading nearby amenities…
Taxation est. · year 1
- Rental income
- $134,412
- − Mortgage interest
- −$55,960
- − Property taxes
- −$14,985
- − Insurance
- −$4,995
- − Repairs & maintenance
- −$10,753
- − Management
- −$10,753
- − Depreciation
- −$29,062
- Taxable income
- $7,905
- Est. tax owed @ 24.0%
- −$1,897
- After-tax cash flow
- $21,442/yr
For passive investors: Depreciation is non-cash, so a rental often shows a tax loss while cash-flowing — sheltering income. Rental losses are passive: they offset passive income freely, and up to $25,000/yr can offset ordinary (W-2) income if you actively participate and your MAGI is under $100k (phasing out to $0 by $150k); unused losses carry forward. On sale, claimed depreciation is recaptured at up to 25%, and gains may owe capital-gains tax (a 1031 exchange can defer both). Figures are a year-1 estimate at your 24.0% rate — not tax advice; consult a CPA.
Condition & rehab AI · 13 photos
This multi-family property in Lynn, MA, is in good condition with a good roof, exterior, and interior. It has a well-maintained exterior and landscaping, making it a good investment opportunity.
Value-add opportunities
- Both Paint the exterior siding — Painting the exterior siding will enhance the curb appeal and increase the property's value.
- Both Landscaping improvements — Well-maintained landscaping can increase both the resale and rental value of the property.
Renovation cost estimate screening
Value-add ROI direction
- Both Paint the exterior siding — Painting the exterior siding will enhance the curb appeal and increase the property's value. ↑
- Both Landscaping improvements — Well-maintained landscaping can increase both the resale and rental value of the property. ↑
ⓘ Cost ranges are severity-bucket heuristics (US national rule-of-thumb). Get contractor quotes + a written scope before underwriting a rehab budget.
Schools (NCES district)
- District
- Lynn
- NCES district ID
- 2507110
- Math proficiency
- 14% ▼ -24.00%
- Reading proficiency
- 25% ▼ -13.00%
- Median HH income
- $46,781
- Composite
- 17.15/100
- National rank
- #9112
- State rank
- #293 of 302 in MA
Livability — Lynn
- Score
- 75/100
- State rank
- #74
- US rank
- #4077
Category grades
Schools grade is shown separately in the Schools card above.
Census & demographics
- Census place
- Lynn, MA
- County
- Essex County · 632,995 people
- City population
- 80,706
- Metro
- Boston-Cambridge-Newton, MA-NH
- Population (ZIP)
- 50,066
- Household income
- $67,046
- Rent vs Own
- Severe rent burden
- 3883.0
Population outlook (Essex County) Hauer SSP2
- Today (2025)
- 840,920 people
- By 2030
- 872,201 · +3.7%
- By 2040
- 927,918 · +10.3%
- By 2050
- 970,206 · +15.4%
- By 2075
- 1,077,993 · +28.2%
- By 2100
- 1,103,053 · +31.2%
Race, ethnicity, and origin ACS 2023
- Neighborhood character
- Diverse neighborhood (Simpson 0.66)
- Race & ethnicity
- Hispanic / Latino 50% White 27% Two or more races 16% Black 12% Asian 6%
- Hispanic origin (detail)
- Mexican 2% Puerto Rican 5% Dominican 18%
- Common ancestry
- Lithuanian 1% Scotch-Irish 1% Hispanic 1%
- Foreign-born
- 42% · Canada, China, Vietnam
- Languages at home
- 40% English-only · Spanish 44% Other Indo-European 5% Other Asian/Pacific 4%
Political lean MEDSL · Essex
- 2024 margin
- Strong D (+20.3) · D 59.2% · R 38.9% · Other 1.9%
- 2008→2024 swing
- 0.0pp no change · 2008: 20.3pp · 2024: 20.3pp
- All cycles
- 2024: D+20.3 2020: D+29.1 2016: D+22.5 2012: D+16.2 2008: D+20.3
Not yet ingested
- Civics
- —
Market trends
- HPI YoY
- ▼ -317.68%
- Current HPI
- 405.3049
- Rent YoY
- ▲ 0.67%
- Metro
- Boston-Cambridge-Newton, MA-NH
- State GDP YoY
- ▲ 2.28%
- F500 in state
- 38
Industry mix (Fortune 500 HQ in MA)
| Industry | F500 HQs | Revenue |
|---|---|---|
| Technology | 3 | $17B |
|
||
| Insurance | 2 | $84B |
|
||
| Retail | 2 | $76B |
|
||
| Life Sciences | 1 | $43B |
|
||
| Energy Technology | 1 | $31B |
|
||
| Aerospace / Defense | 1 | $18B |
|
||
Price history
-4.4% since first listed2 events — show timeline
- 2026-04-11 Price Changed $1,099,000 MLS PIN
- 2026-03-22 Listed $1,149,900 MLS PIN
Cash-flow waterfall
monthlySold comps — $/sqft
last 12 mo · ≤1 miLoading sold comps…