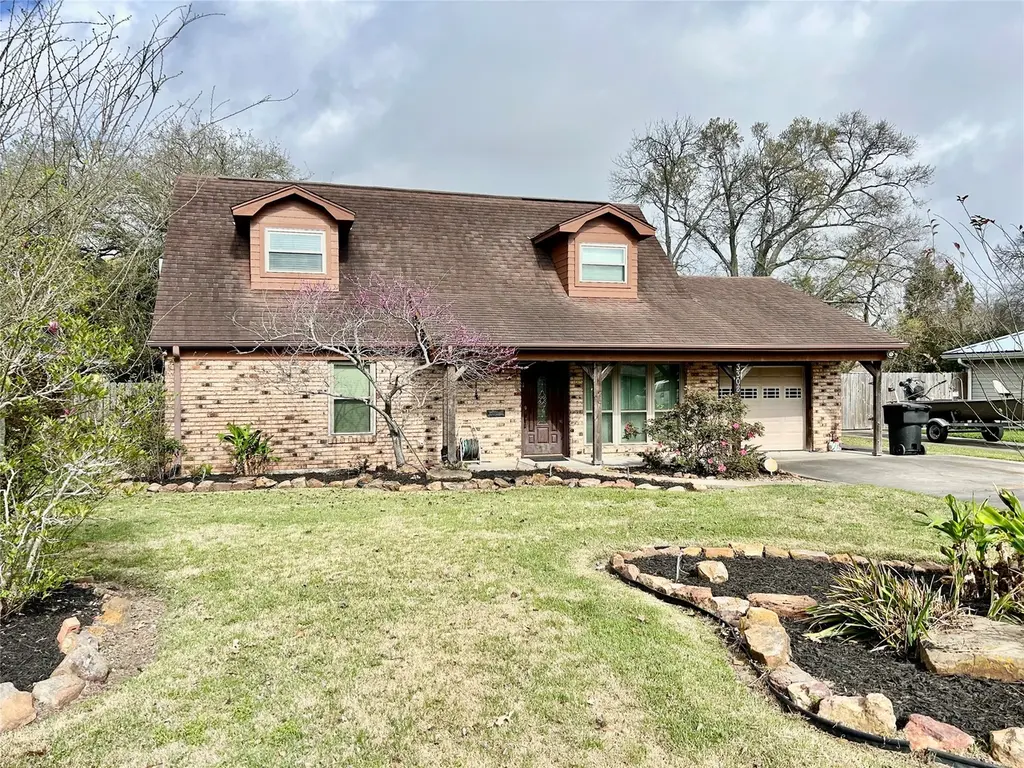
3308 Avenue B · Nederland, TX
Flood risk 8/10 · Major
- FEMA flood zone
- X (shaded)
- Chance of flooding over 30 yrs
- 0.6%
- Est. flood insurance / yr
- $507 – $1,088
Fire risk 2/10 · Minimal
- Est. fire insurance / yr
- $1,222 – $2,270
Heat risk 10/10 · Severe
- Hot days now (above 110°F)
- 7 days/yr
- Hot days in 30 yrs
- 24 days/yr
Wind risk 9/10 · Severe
- Chance of severe wind over 30 yrs
- 99.0%
Air-quality risk 2/10 · Minimal
- Unhealthy air days now
- 1 days/yr
- Unhealthy air days in 30 yrs
- 1 days/yr
Risk factors via First Street. Map © Google.
Why this score? — see what drove the D+ grade
The composite is a weighted blend of 9 inputs, each scored 0–100. Each bar is that input's sub-score; the figure is the points it added to the 100-point composite (weight × sub-score).
- ARV discount +12.1/15.0
- Cash flow +10.9/30.0
- Rent growth +4.8/5.0
- Schools +4.5/10.0
- Livability +3.8/5.0
- 1% rule +3.4/10.0
- DSCR +3.2/10.0
- Condition / age +2.5/5.0
- Appreciation +0.0/10.0
$235,000
🖨 Deal sheet (PDF) 📄 Offer letter ✓ Due diligence
Listing remarks MLS
Welcome to this well-maintained 3-bedroom, 3-bathroom home located in the heart of Nederland on Ave B. Built in 1962, this unique 1.5-story residence offers approximately 3,124 square feet of living space, providing plenty of room for comfortable living and entertainment! Inside, you’ll find generous living areas, spacious bedrooms, and a functional layout that blends classic character with everyday practicality. The home’s spacious floor plan offers flexibility for families, guests, or a home office setup! Situated in an established neighborhood, this property offers convenient access to local schools, shopping and dining making it an ideal location for both families and professionals!
Key facts
- 8,999 sq ft lot
- Garage
- Built 1962
Neighborhood map
What this means for you Summary
Snapshot
- This is a 3-bed/3.0-bath single-family listed at $235k.
Deal economics
- At list price, monthly cash flow is $-170 ($-2k/yr) — negative.
- To cash-flow at today's rent, offer at most $205k (12.8% below list).
- To meet the 1% rule (rent ≥ 1% of price), the offer needs to be $196k (16.5% below list).
- Recommended offer: $196k (16.5% below list) — sets the bar for 1% rule.
- Cap rate 5.8% vs local median 4.6% in Nederland — meaningfully above typical; check what's discounted (condition, days-on-market, listing class) to confirm the premium yield is real.
Location & tenants
- Location reads 75/100 on livability (#129 in TX, #3,906 nationally) — a middle-class / working-renter tenant base. Strengths: employment A+, cost of living A+, housing A+; Watch: amenities F, commute F.
- Nederland ISD (suburban): math 51% / reading 52% proficiency, ranked #138 of 826 in TX (top 17%) — acceptable for families but not a draw, mixed tenant base, ~2y average lease.
- Zoned schools: Helena Park El (math 54% / reading 60%, grade C+, #505 of 4,322 statewide, top 13%, 621 students, 35% FRL); Wilson Middle (math 61% / reading 53%, grade B, #212 of 1,662 statewide, top 13%, 812 students, 41% FRL); Nederland H S (math 49% / reading 61%, grade C, #373 of 1,632 statewide, top 23%, 1,439 students, 47% FRL) — zoned schools at 41% FRL track the district average.
- Market conditions: Rents rising fast (+9.3%/yr); 111 active listings in the ZIP; 3 comparable units currently listed for rent nearby; rentals at typical pace (median 26d on market — plan ~3-4 weeks tenant-placement turnaround); solid renter incomes; 343 units permitted in Jefferson County in 2024 (0 in 5+ unit buildings).
- This rent runs 30% of the median local income ($78k/yr) — at the standard rent-burdened threshold; future hikes will face affordability resistance.
Forward outlook
- Local home prices are declining (-3.0%/yr); year-one equity from $2k of loan paydown is wiped out by about $7k of value loss. Plan a longer hold.
Negotiation context
- It's been on market 105 days — a 9% lower offer ($214k) is reasonable based on typical stale-listing flexibility.
- 2 sale attempts; this cycle's ask has dropped $34k (13%) from the opening price — seller is motivated, your offer sets the floor, not the list.
Risks & watch-outs
- Watch-outs: flood insurance adds $66/mo.
- Climate carrying-cost: severe flood risk; severe wind risk, 99% chance of damaging wind over 30y; extreme-heat days projected 7→24/yr by 2055 (HVAC capex compounding) — expect insurance premiums to compound above CPI over the hold.
Questions for the listing agent
- What do current leases actually rent for vs. the listed asking? Can we see a recent rent roll and the last 12 months of T-12 income?
- It's been on market 105 days. Have you received any prior offers? Is the seller open to a 16% concession, seller financing, or rate buy-down credit?
- Built in 1962 — when were the roof, HVAC, electrical panel, plumbing, and water heater last replaced?
- What's the actual annual flood-insurance premium (NFIP or private), and is the property in a SFHA with mandatory coverage?
- Why hasn't it sold? Are there any deal-killer items the seller is aware of (foundation, flood, title, zoning, code violations)?
- Is there a deadline driving the sale (1031 exchange, divorce, estate, relocation)? That informs how much negotiation room exists.
- Schools are A-rated — typically a magnet for longer-tenancy family renters. What's the average tenant stay here, and is there a school-zone premium baked into asking?
- The area grade is low — what's the realistic commute time and amenity access for the typical tenant pool here? Any planned neighborhood developments (good or bad) we should know about?
- What's the average days-on-market for RENTAL listings here right now (not sales)? A rising rental-DOM trend means longer vacancies and softer asking-rent achievability than the comps imply.
- What's the recent tenant-quality profile in this submarket — average credit score on applications, eviction rate, late-payment / NSF rate, and stable-employment percentage? A property-management company in the area should have these aggregated.
- How much new for-sale + rental construction is in the pipeline within 1–3 miles? Heavy new supply typically softens prices + rents 12–24 months out; constrained supply supports both.
Investment metrics
- 1% rule
- 0.84% ✗
- Cap rate
- 5.76%
- Cash-on-cash
- -1.89%
- DSCR
- 0.92
- GRM
- 10.0
CMA / ARV
- ARV (median comp)
- $261,639
- List price
- $235,000
- Delta
- -10.18%
- Verdict
- UNDERPRICED
- Comps
- 20 within 1.0 mi
Show comp detail 9 sales within ~0.75 mi
| Address | Dist | Beds/Ba | Sqft | Sold | Price | $/sf | Match |
|---|---|---|---|---|---|---|---|
| 1016 S 27th St | 0.60mi | 3/2.0 | 2,198 (-1%) | 2mo | $279,900 | $127 | 64 |
| 316 N 30th St | 0.41mi | 3/2.5 | 2,024 (-9%) | 15mo | $290,000 | $143 | 51 |
| 712 N 27th St | 0.66mi | 3/2.0 | 2,288 (+3%) | 15mo | $279,000 | $122 | 48 |
| 524 N 27th St | 0.59mi | 3/2.0 | 2,077 (-7%) | 11mo | $289,900 | $140 | 48 |
| 189 Hilldale Dr | 0.72mi | 4/2.0 (+1) | 2,148 (-4%) | 10mo | $185,000 | $86 | 43 |
| 1003 Louise Dr | 0.75mi | 4/2.0 (+1) | 2,432 (+9%) | 14mo | $244,900 | $101 | 29 |
| 10200 Shady Ranch Ln Ln | 0.71mi | 3/2.0 | 1,903 (-15%) | 13mo | $342,000 | $180 | 28 |
| 619 N 24th St | 0.72mi | 4/2.5 (+1) | 1,910 (-14%) | 13mo | $255,000 | $134 | 25 |
| 10515 Dominion Ranch Dr | 0.65mi | 3/2.0 | 1,899 (-15%) | 24mo | $275,000 | $145 | 21 |
Match score weights: distance 35% · size 25% · config 20% · recency 20%. Top-matched comps best support the ARV.
Projected returns pro-forma
-3.0% appreciation · 8.0% rent growth · sell at horizon
- IRR
- -15.7%
- Equity multiple
- 0.42×
- Total profit
- $-38,464
- Equity at exit
- $35,039
- IRR
- 0.0%
- Equity multiple
- 1.00×
- Total profit
- $119
- Equity at exit
- $20,319
Cash invested: $65,800 (down + closing). Projections, not guarantees.
Landlord ↔ Tenant lean methodology
- Overall (STATE)
- 87 Strongly Landlord-Friendly
- State Texas
- 87 Strongly Landlord-Friendly · R+5
- County
- — inherits STATE
- City
- — inherits STATE
ZIP-level market 77627
- Rents YoY
- 9.3%
- Active inventory
- 111
- Price-to-rent
- 10.0×
Monthly cashflow live
- Estimated rent
- $1,963 medium interval (Pro) →
- Mortgage (P&I)
- −$1,232
- Tax from tax record
- −$324 /mo · $3,893/yr
- Insurance
- −$98
- Flood insurance flood zone
- −$66 /mo · $798/yr
- HOA
- −$0
- Vacancy / Maint / Mgmt
- −$412
- Net cashflow
- $-170
Break-even live
Sensitivity live
| Price | -10% $-37 | -5% $-104 | +0% $-170 | +5% $-237 | +10% $-303 |
|---|---|---|---|---|---|
| Rent | -10% $-325 | -5% $-248 | +0% $-170 | +5% $-93 | +10% $-15 |
| Rate | -1.0pp $-52 | -0.5pp $-111 | base $-170 | +0.5pp $-231 | +1.0pp $-293 |
UW: 25.0% down · 7.5% · 30yr · 1.5% tax · 5.0% vac · 8.0% maint · 8.0% mgmt
Financing live
Cash to close
- Down payment
- $58,750
- Closing costs
- $7,050
- Reserves months
- —
- Total cash needed
- —
Loan-product check · same deal, 3 products live
Conventional
25% down · 7.5% · 30yr
- Down + closing
- —
- Monthly P&I
- —
- Monthly cashflow
- —
- DSCR
- —
- Eligible?
- —
Personal DTI + credit; lowest rate.
DSCR
20% down · 8.5% · 30yr
- Down + closing
- —
- Monthly P&I
- —
- Monthly cashflow
- —
- DSCR
- —
- Eligible?
- —
No personal income docs; deal must DSCR.
Hard money
10% down · 12.0% · 12mo
- Down + closing
- —
- Monthly P&I
- —
- Monthly cashflow
- —
- DSCR
- —
- Eligible?
- —
Short-term bridge; refi at stabilization.
Rent comps 3 comps
| Address | Beds | Baths | Sqft | Rent | $/sqft | DOM | Units | Dist |
|---|---|---|---|---|---|---|---|---|
| 3119 Moor Dr Nederland, TX | 3.0 | 1.5 | 1448 | $1,795 | $1.24 | 45d | 1 | 0.42mi |
| 2640 Hickory Cove Ln Port Arthur, TX | 4.0 | 2.5 | 1850 | $2,600 | $1.41 | 15d | 1 | 0.56mi |
| 2707 Seattle St Nederland, TX | 3.0 | 2.5 | 2077 | $1,850 | $0.89 | 25d | 1 | 1.36mi |
Listing history 22 events
-
2026-06-21days on market $235,000 Active 105 DOM
-
2026-06-18days on market $235,000 Active 102 DOM
-
2026-06-17days on market $235,000 Active 101 DOM
-
2026-06-16days on market $235,000 Active 100 DOM
-
2026-06-15days on market $235,000 Active 99 DOM
-
2026-06-14days on market $235,000 Active 97 DOM
-
2026-06-13days on market $235,000 Active 96 DOM
-
2026-06-10days on market $235,000 Active 94 DOM
-
2026-06-09days on market $235,000 Active 93 DOM
-
2026-06-08days on market $235,000 Active 92 DOM
-
2026-06-07days on market $235,000 Active 91 DOM
-
2026-06-05pricedays on market $235,000 Active 88 DOM
-
2026-06-03days on market $249,000 Active 87 DOM
-
2026-06-02days on market $249,000 Active 86 DOM
-
2026-06-01days on market $249,000 Active 85 DOM
-
2026-05-31days on market $249,000 Active 84 DOM
-
2026-05-30days on market $249,000 Active 83 DOM
-
2026-05-11price $249,000 707-char remark
Show marketing remark (707 chars)
Welcome to this well-maintained 3-bedroom, 3-bathroom home located in the heart of Nederland on Ave B. Built in 1962, this unique 1.5-story residence offers approximately 3,124 square feet of living space, providing plenty of room for comfortable living and entertainment! Inside, you’ll find generous living areas, spacious bedrooms, and a functional layout that blends classic character with everyday practicality. The home’s spacious floor plan offers flexibility for families, guests, or a home office setup! Situated in an established neighborhood, this property offers convenient access to local schools, shopping and dining making it an ideal location for both families and professionals!
-
2026-04-14price $259,000
-
2026-04-13price $259,000 707-char remark
Show marketing remark (707 chars)
Welcome to this well-maintained 3-bedroom, 3-bathroom home located in the heart of Nederland on Ave B. Built in 1962, this unique 1.5-story residence offers approximately 3,124 square feet of living space, providing plenty of room for comfortable living and entertainment! Inside, you’ll find generous living areas, spacious bedrooms, and a functional layout that blends classic character with everyday practicality. The home’s spacious floor plan offers flexibility for families, guests, or a home office setup! Situated in an established neighborhood, this property offers convenient access to local schools, shopping and dining making it an ideal location for both families and professionals!
-
2026-03-12$269,000 Active
-
2026-03-08$269,000 Active 707-char remark
Show marketing remark (707 chars)
Welcome to this well-maintained 3-bedroom, 3-bathroom home located in the heart of Nederland on Ave B. Built in 1962, this unique 1.5-story residence offers approximately 3,124 square feet of living space, providing plenty of room for comfortable living and entertainment! Inside, you’ll find generous living areas, spacious bedrooms, and a functional layout that blends classic character with everyday practicality. The home’s spacious floor plan offers flexibility for families, guests, or a home office setup! Situated in an established neighborhood, this property offers convenient access to local schools, shopping and dining making it an ideal location for both families and professionals!
ⓘ Source: listings_history table (triggers on properties + properties_extension) + one-shot
backfill from property_details.listing_events for pre-trigger history.
Tax reassessment forecast TX · Resets to sale price
- Current annual tax
- $3,893 · $324/mo
- Projected year-2 tax
- $4,300 · $358/mo
- Expected delta
- +$407/yr (+$34/mo · 10.5%)
ⓘ Screening estimate from a state-policy table — verify with the county assessor before closing.
Climate risk First Street
- Flood 8/10 Severe FEMA zone X (shaded) · 60% chance over 30 yrs
- Wildfire 2/10 Low
- Heat 10/10 Extreme 7 d/yr ≥110°F today · 24 d/yr by 30 yrs out
- Wind 9/10 Extreme 99% chance of damaging wind over 30 yrs
- Air quality 2/10 Low 1 unhealthy d/yr today · 1 by 30 yrs out
Nearby sold comps map
Loading sold comps map…
Walkable amenities ~0.75 mi
Loading nearby amenities…
Taxation est. · year 1
- Rental income
- $23,557
- − Mortgage interest
- −$13,164
- − Property taxes
- −$3,893
- − Insurance
- −$1,972
- − Repairs & maintenance
- −$1,885
- − Management
- −$1,885
- − Depreciation
- −$6,836
- Taxable loss
- −$6,078
- Est. tax savings @ 24.0%
- +$1,459
- After-tax cash flow
- $-585/yr
For passive investors: Depreciation is non-cash, so a rental often shows a tax loss while cash-flowing — sheltering income. Rental losses are passive: they offset passive income freely, and up to $25,000/yr can offset ordinary (W-2) income if you actively participate and your MAGI is under $100k (phasing out to $0 by $150k); unused losses carry forward. On sale, claimed depreciation is recaptured at up to 25%, and gains may owe capital-gains tax (a 1031 exchange can defer both). Figures are a year-1 estimate at your 24.0% rate — not tax advice; consult a CPA.
Schools (NCES district)
- District
- Nederland ISD
- NCES district ID
- 4832280
- Math proficiency
- 51% ▼ -3.00%
- Reading proficiency
- 52% ▼ -3.00%
- Median HH income
- $59,647
- Composite
- 44.95/100
- National rank
- #2709
- State rank
- #138 of 826 in TX
Livability — Nederland
- Score
- 75/100
- State rank
- #129
- US rank
- #3906
Category grades
Schools grade is shown separately in the Schools card above.
Census & demographics
- Census place
- Nederland, TX
- County
- Jefferson County · 203,592 people
- City population
- 22,357
- Metro
- Beaumont-Port Arthur, TX
- Population (ZIP)
- 22,357
- Household income
- $78,001
- Rent vs Own
- Severe rent burden
- 572.0
Population outlook (Jefferson County) Hauer SSP2
- Today (2025)
- 259,015 people
- By 2030
- 260,685 · +0.6%
- By 2040
- 263,309 · +1.7%
- By 2050
- 265,237 · +2.4%
- By 2075
- 270,193 · +4.3%
- By 2100
- 255,628 · -1.3%
Race, ethnicity, and origin ACS 2023
- Neighborhood character
- Predominantly White (78%)
- Race & ethnicity
- White 78% Hispanic / Latino 12% Two or more races 8% Black 4% Asian 3%
- Hispanic origin (detail)
- Mexican 8%
- Common ancestry
- Lithuanian 10% Slovak 3% Italian 2%
- Foreign-born
- 5% · Canada, Vietnam
- Languages at home
- 87% English-only · Spanish 8% Other Indo-European 1% Vietnamese 1%
Political lean MEDSL · Jefferson
- 2024 margin
- Lean R (+8.9) · D 45.1% · R 54.0%
- 2008→2024 swing
- -11.1pp toward R · 2008: 2.2pp · 2024: -8.9pp
- All cycles
- 2024: R+8.9 2020: R+1.6 2016: R+0.5 2012: D+1.6 2008: D+2.2
Not yet ingested
- Civics
- —
Market trends
- HPI YoY
- ▼ -228.91%
- Current HPI
- 176.2132
- Rent YoY
- ▲ 9.27%
- Metro
- Beaumont-Port Arthur, TX
- State GDP YoY
- ▲ 3.95%
- F500 in state
- 110
Industry mix (Fortune 500 HQ in TX)
| Industry | F500 HQs | Revenue |
|---|---|---|
| Energy | 16 | $1,198B |
|
||
| Technology | 5 | $198B |
|
||
| Engineering / Construction | 4 | $72B |
|
||
| Energy Services | 3 | $60B |
|
||
| Utilities | 3 | $41B |
|
||
| Healthcare | 2 | $330B |
|
||
Price history
-7.4% since first listed5 events — show timeline
- 2026-05-11 Price Changed $249,000 HARMLS
- 2026-04-14 Price Changed $259,000 BBOR
- 2026-04-13 Price Changed $259,000 HARMLS
- 2026-03-12 Listed $269,000 BBOR
- 2026-03-08 Listed $269,000 HARMLS
Property tax history
+4.5%/yrLatest (2025): $3,893 · -5.0% YoY. Source: county tax records.
Cash-flow waterfall
monthlySold comps — $/sqft
last 12 mo · ≤1 miLoading sold comps…