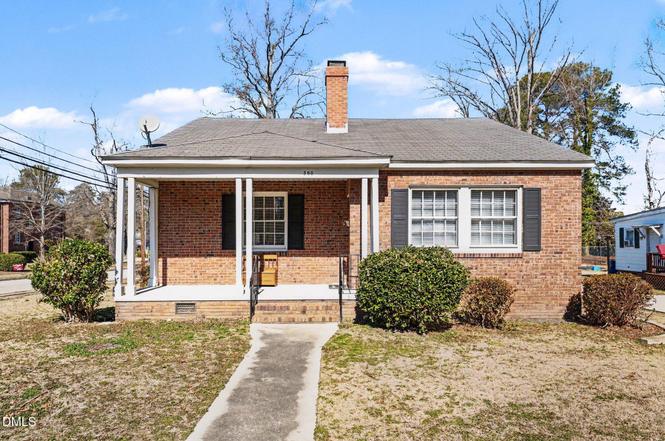
300 Frances · Kinston, NC
Flood risk 1/10 · Minimal
- FEMA flood zone
- X (unshaded)
- Chance of flooding over 30 yrs
- 0.0%
- Est. flood insurance / yr
- $507 – $1,088
Fire risk 3/10 · Minor
- Est. fire insurance / yr
- $906 – $1,684
Heat risk 8/10 · Major
- Hot days now (above 107°F)
- 7 days/yr
- Hot days in 30 yrs
- 18 days/yr
Wind risk 8/10 · Major
- Chance of severe wind over 30 yrs
- 80.0%
Air-quality risk 2/10 · Minimal
- Unhealthy air days now
- 2 days/yr
- Unhealthy air days in 30 yrs
- 2 days/yr
Risk factors via First Street. Map © Google.
Why this score? — see what drove the D+ grade
The composite is a weighted blend of 9 inputs, each scored 0–100. Each bar is that input's sub-score; the figure is the points it added to the 100-point composite (weight × sub-score).
- ARV discount +15.0/15.0
- Cash flow +14.9/30.0
- DSCR +4.5/10.0
- 1% rule +4.1/10.0
- Livability +2.8/5.0
- Rent growth +2.5/5.0
- Schools +2.5/10.0
- Condition / age +2.5/5.0
- Appreciation +0.0/10.0
$82,000
🖨 Deal sheet 📄 Offer letter ✓ Due diligence
Listing remarks
Endless Potential in an Unbeatable Location! Discover the perfect canvas for your vision at 300 Frances Place. This solid 1,400+ sq. ft. residence features three spacious bedrooms and a functional layout that serves as the perfect foundation for your modern updates. Boasting strong bones and a classic silhouette, this home is truly ready for your special touch. Situated in an established Kinston neighborhood, you are mere minutes from the vibrant energy of downtown shopping, local clinics, and the hospital. Enjoy easy access to public parks and transportation, making this an ideal spot for those seeking convenience and community. Whether you are looking to build equity through a personalize
Key facts
- Strong bones
- Functional layout
- 9,148 sq ft lot
Tags
Property features AI
Finance
- Other: Lot size approximately 0.21 acres; Zoning: RA6; Road frontage on a city street with asphalt surface and public maintenance; No horse privileges
- HOA & community: No association; community workshop area listed
Exterior
- Parking: Detached garage with 1 garage space; One additional open parking space; driveway
- Utilities: Public water; Public sewer; Electricity available and connected; Cable available
- Home design: Single-story house; Front door entry; Faces south; Entry level: 1; Property listed as fixer
- Construction: Board & batten siding, wood siding, brick and brick veneer exterior; Architectural shingle roof; Block and brick/mortar foundation; Built as a house (structure type)
- Exterior features: Covered front porch; Porch; Back yard fencing with chain link gate; Storage
Interior
- Kitchen: Free-standing electric oven
- Bedrooms: Three bedrooms (all on the main level)
- Flooring: Hardwood and laminate floors
- Bathrooms: One full bathroom
- Heating & cooling: Oil heating with floor furnace and fireplace(s); Window air conditioning units
- Interior features: Fireplace in the living room; Storage
- Laundry & utility: Main-level laundry room with washer and electric dryer hookups
Neighborhood map
What this means for you Summary
Snapshot
- This is a 3-bed/1.0-bath single-family listed at $82k.
Deal economics
- At list price, monthly cash flow is $23 ($280/yr) — positive.
- The deal already cash-flows at list — no discount required.
- To meet the 1% rule (rent ≥ 1% of price), the offer needs to be $75k (9.0% below list).
- Recommended offer: $75k (9.0% below list) — sets the bar for 1% rule.
- Cap rate 6.6% vs local median 3.8% in Kinston — top-decile yield for the area; either an underpriced asset or a hidden risk that comps aren't pricing in. Stress-test before assuming the spread holds.
Location & tenants
- Location reads 55/100 on livability (#640 in NC) — a working-class tenant base; expect higher turnover. Strengths: cost of living A+, health & safety A+, housing B+; Watch: schools F, crime F, amenities F.
- Lenoir County Public Schools (rural): math 29% / reading 32% proficiency, ranked #147 of 178 in NC (top 83%) — families likely to look elsewhere, expect single-tenant / working-renter base with shorter leases; 65% free/reduced lunch — lower-income household profile, screen leases tightly.
- Market conditions: 95 active listings in the ZIP; 3 comparable units currently listed for rent nearby; rentals leasing fast (median 13d on market — plan ~1-2 weeks tenant-placement turnaround); 148 units permitted in Lenoir County in 2024 (0 in 5+ unit buildings).
Forward outlook
- Local home prices are declining (-3.0%/yr); year-one equity from $567 of loan paydown is wiped out by about $2k of value loss. Plan a longer hold.
- Lenoir County population projected at -18% by 2050 — secular population decline; favor cash flow + early exit over multi-decade hold.
Negotiation context
- It's been on market 26 days — a 2% lower offer ($81k) is reasonable based on typical stale-listing flexibility.
- 3 sale attempts; this cycle's ask has dropped $10k (11%) from the opening price — seller is motivated, your offer sets the floor, not the list.
Risks & watch-outs
- Watch-outs: built in 1947 — expect roof / HVAC / electrical / plumbing capex.
- Climate carrying-cost: severe wind risk, 80% chance of damaging wind over 30y; extreme-heat days projected 7→18/yr by 2055 (HVAC capex compounding) — expect insurance premiums to compound above CPI over the hold.
Questions for the listing agent
- Built in 1947 — when were the roof, HVAC, electrical panel, plumbing, and water heater last replaced?
- Is there a deadline driving the sale (1031 exchange, divorce, estate, relocation)? That informs how much negotiation room exists.
- Schools are F-rated, which usually means shorter tenancies and higher turnover. Who's the typical renter profile here, and what's been the actual vacancy rate?
- Crime grade is F in this area — have there been break-ins, vandalism, or insurance claims at this property in the last 3 years? What carrier currently insures it and at what premium?
- The area grade is low — what's the realistic commute time and amenity access for the typical tenant pool here? Any planned neighborhood developments (good or bad) we should know about?
- What's the average days-on-market for RENTAL listings here right now (not sales)? A rising rental-DOM trend means longer vacancies and softer asking-rent achievability than the comps imply.
- What's the recent tenant-quality profile in this submarket — average credit score on applications, eviction rate, late-payment / NSF rate, and stable-employment percentage? A property-management company in the area should have these aggregated.
- How much new for-sale + rental construction is in the pipeline within 1–3 miles? Heavy new supply typically softens prices + rents 12–24 months out; constrained supply supports both.
Investment metrics
- 1% rule
- 0.91% ✗
- Cap rate
- 6.63%
- Cash-on-cash
- 1.22%
- DSCR
- 1.05
- GRM
- 9.2
CMA / ARV
- ARV (on-the-fly)
- $126,380
- Comps found
- 12
Show comp detail 12 sales within ~0.75 mi
| Address | Dist | Beds/Ba | Sqft | Sold | Price | $/sf | Match |
|---|---|---|---|---|---|---|---|
| 300 Frances | 0.00mi | 3/1.0 | 1,420 (0%) | 1mo | $75,000 | $53 | 100 |
| 204 Wilson Ave | 0.10mi | 3/2.0 | 1,582 (+11%) | 6mo | $179,999 | $114 | 68 |
| 205 Wilson Ave | 0.13mi | 3/1.0 | 1,290 (-9%) | 13mo | $115,000 | $89 | 68 |
| 1204 Morningside Dr | 0.23mi | 3/1.0 | 1,242 (-12%) | 1mo | $175,000 | $141 | 67 |
| 1403 Queens Rd | 0.25mi | 4/2.5 (+1) | 1,508 (+6%) | 1mo | $224,370 | $149 | 66 |
| 105 W Highland Ave | 0.24mi | 4/2.5 (+1) | 1,508 (+6%) | 2mo | $210,996 | $140 | 66 |
| 1217 Virginia Ave | 0.16mi | 2/1.5 (-1) | 1,574 (+11%) | 3mo | $83,000 | $53 | 65 |
| 714 Jones Ave | 0.66mi | 3/2.0 | 1,428 (+1%) | 1mo | $125,000 | $88 | 64 |
| 805 N Mclewean St | 0.48mi | 3/1.0 | 1,470 (+4%) | 11mo | $23,000 | $16 | 62 |
| 1502 Queens Rd | 0.32mi | 3/1.0 | 1,236 (-13%) | 7mo | $145,000 | $117 | 58 |
| 1704 Charlotte Ave | 0.54mi | 3/1.5 | 1,344 (-5%) | 12mo | $52,000 | $39 | 54 |
| 618 Daughety Rd | 0.52mi | 2/1.0 (-1) | 1,240 (-13%) | 9mo | $55,000 | $44 | 43 |
Match score weights: distance 35% · size 25% · config 20% · recency 20%. Top-matched comps best support the ARV.
Projected returns pro-forma
-3.0% appreciation · 3.0% rent growth · sell at horizon
- IRR
- -14.3%
- Equity multiple
- 0.49×
- Total profit
- $-11,790
- Equity at exit
- $12,226
- IRR
- -5.6%
- Equity multiple
- 0.64×
- Total profit
- $-8,308
- Equity at exit
- $7,090
Cash invested: $22,960 (down + closing). Projections, not guarantees.
Landlord ↔ Tenant lean methodology
- Overall (STATE)
- 85 Strongly Landlord-Friendly
- State North Carolina
- 85 Strongly Landlord-Friendly · R+3
- County
- — inherits STATE
- City
- — inherits STATE
ZIP-level market 28501
- Home prices YoY
- -18.9%
- Active inventory
- 95
- Price-to-rent
- 9.2×
Monthly cashflow live
- Estimated rent
- $746 medium interval (Pro) →
- Mortgage (P&I)
- −$430
- Tax from tax record
- −$102 /mo · $1,221/yr
- Insurance
- −$34
- HOA
- −$0
- Vacancy / Maint / Mgmt
- −$157
- Net cashflow
- $23
Break-even live
UW: 25.0% down · 7.5% · 30yr · 1.5% tax · 5.0% vac · 8.0% maint · 8.0% mgmt
Financing live
Cash to close
- Down payment
- $20,500
- Closing costs
- $2,460
- Reserves months
- —
- Total cash needed
- —
Loan-product check · same deal, 3 products live
Conventional
25% down · 7.5% · 30yr
- Down + closing
- —
- Monthly P&I
- —
- Monthly cashflow
- —
- DSCR
- —
- Eligible?
- —
Personal DTI + credit; lowest rate.
DSCR
20% down · 8.5% · 30yr
- Down + closing
- —
- Monthly P&I
- —
- Monthly cashflow
- —
- DSCR
- —
- Eligible?
- —
No personal income docs; deal must DSCR.
Hard money
10% down · 12.0% · 12mo
- Down + closing
- —
- Monthly P&I
- —
- Monthly cashflow
- —
- DSCR
- —
- Eligible?
- —
Short-term bridge; refi at stabilization.
Rent comps 3 comps
| Address | Beds | Baths | Sqft | Rent | $/sqft | DOM | Units | Dist |
|---|---|---|---|---|---|---|---|---|
| 503 N Queen St Kinston, NC | 1.0–2.0 | 2.0 | 759 | $723 | $0.95 | 13d | 8 | 0.75mi |
| 705 Harvey St Kinston, NC | 2.0 | 1.0 | 896 | $700 | $0.78 | 20d | 1 | 0.80mi |
| 4015 N Herritage St Kinston, NC | 1.0–3.0 | 1.0–2.0 | 964 | $838 | $0.87 | 13d | 6 | 1.19mi |
Listing history 7 events
-
2026-05-13status Pending
-
2026-05-06price $82,000
-
2026-04-24status Active
-
2026-04-13status Pending
-
2026-04-07status Active
-
2026-02-20status Pending
-
2026-02-17$92,000 Active
ⓘ Source: listings_history table (triggers on properties + properties_extension) + one-shot
backfill from property_details.listing_events for pre-trigger history.
Tax reassessment forecast NC · Resets to sale price
- Current annual tax
- $1,221 · $102/mo
- Projected year-2 tax
- $1,221 · $102/mo
- Expected delta
- $0/yr ($0/mo · 0.0%)
ⓘ Screening estimate from a state-policy table — verify with the county assessor before closing.
Climate risk First Street
- Flood 1/10 Low FEMA zone X (unshaded) · 0% chance over 30 yrs
- Wildfire 3/10 Moderate
- Heat 8/10 Severe 7 d/yr ≥107°F today · 18 d/yr by 30 yrs out
- Wind 8/10 Severe 80% chance of damaging wind over 30 yrs
- Air quality 2/10 Low 2 unhealthy d/yr today · 2 by 30 yrs out
Nearby sold comps map
Loading sold comps map…
Walkable amenities ~0.75 mi
Loading nearby amenities…
Taxation est. · year 1
- Rental income
- $8,951
- − Mortgage interest
- −$4,593
- − Property taxes
- −$1,221
- − Insurance
- −$410
- − Repairs & maintenance
- −$716
- − Management
- −$716
- − Depreciation
- −$2,385
- Taxable loss
- −$1,091
- Est. tax savings @ 24.0%
- +$262
- After-tax cash flow
- $542/yr
For passive investors: Depreciation is non-cash, so a rental often shows a tax loss while cash-flowing — sheltering income. Rental losses are passive: they offset passive income freely, and up to $25,000/yr can offset ordinary (W-2) income if you actively participate and your MAGI is under $100k (phasing out to $0 by $150k); unused losses carry forward. On sale, claimed depreciation is recaptured at up to 25%, and gains may owe capital-gains tax (a 1031 exchange can defer both). Figures are a year-1 estimate at your 24.0% rate — not tax advice; consult a CPA.
Schools (NCES district)
- District
- Lenoir County Public Schools
- NCES district ID
- 3702610
- Math proficiency
- 29% ▲ 1.00%
- Reading proficiency
- 32% ▼ -4.00%
- Median HH income
- $34,958
- Composite
- 25.17/100
- National rank
- #7515
- State rank
- #147 of 178 in NC
Livability — Kinston
- Score
- 55/100
- State rank
- #640
- US rank
- #23267
Category grades
Schools grade is shown separately in the Schools card above.
Census & demographics
- Census place
- Kinston, NC
- City population
- 20,407
- Population (ZIP)
- 18,112
Population outlook (Lenoir County) Hauer SSP2
- Today (2025)
- 55,002 people
- By 2030
- 53,048 · -3.6%
- By 2040
- 49,041 · -10.8%
- By 2050
- 45,136 · -17.9%
- By 2075
- 36,547 · -33.6%
- By 2100
- 27,731 · -49.6%
Race, ethnicity, and origin ACS 2023
- Neighborhood character
- Majority Black (62%)
- Race & ethnicity
- Black 62% White 26% Two or more races 6% Hispanic / Latino 5%
- Common ancestry
- Serbian 1% Italian 1%
- Foreign-born
- 2% · Canada, China
- Languages at home
- 95% English-only · Spanish 5%
Political lean MEDSL · Lenoir
- 2024 margin
- Lean R (+6.8) · D 46.2% · R 53.0%
- 2008→2024 swing
- -6.7pp toward R · 2008: -0.1pp · 2024: -6.8pp
- All cycles
- 2024: R+6.8 2020: R+3.5 2016: R+6.3 2012: R+1.5 2008: R+0.1
Not yet ingested
- Civics
- —
Market trends
- HPI YoY
- ▼ -45.17%
- Current HPI
- 193.3213
- Rent YoY
- —
- Metro
- —
- State GDP YoY
- ▲ 3.28%
- F500 in state
- 26
Industry mix (Fortune 500 HQ in NC)
| Industry | F500 HQs | Revenue |
|---|---|---|
| Financial Services | 2 | $213B |
|
||
| Retail | 2 | $95B |
|
||
| Industrial Conglomerate | 1 | $38B |
|
||
| Metals / Steel | 1 | $35B |
|
||
| Utilities | 1 | $30B |
|
||
| Industrial Machinery | 1 | $19B |
|
||
Price history
-10.9% since first listed7 events — show timeline
- 2026-05-13 Pending — TMLS
- 2026-05-06 Price Changed $82,000 TMLS
- 2026-04-24 Relisted — TMLS
- 2026-04-13 Pending — TMLS
- 2026-04-07 Relisted — TMLS
- 2026-02-20 Pending — TMLS
- 2026-02-17 Listed $92,000 TMLS
Property tax history
+2.7%/yrLatest (2025): $1,221 · +72.9% YoY. Source: county tax records.
Cash-flow waterfall
monthlySold comps — $/sqft
last 12 mo · ≤1 miLoading sold comps…