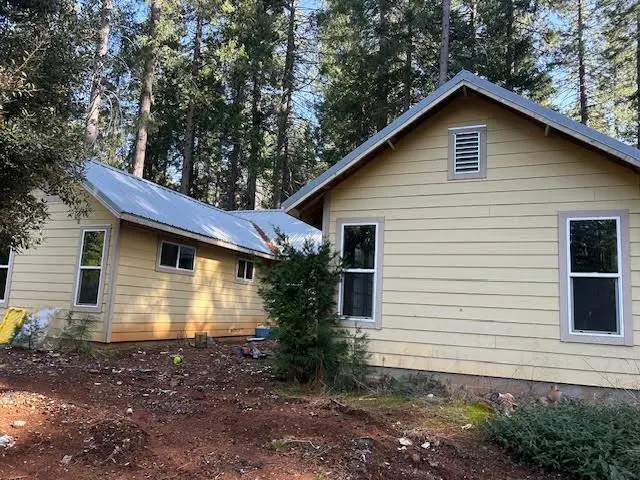
10406 Wentworth Springs Rd · Georgetown, CA
Flood risk 1/10 · Minimal
- FEMA flood zone
- D
- Chance of flooding over 30 yrs
- 0.0%
- Est. flood insurance / yr
- $544 – $1,084
Fire risk 8/10 · Major
- Est. fire insurance / yr
- $659 – $1,223
Heat risk 3/10 · Minor
- Hot days now (above 94°F)
- 7 days/yr
- Hot days in 30 yrs
- 15 days/yr
Wind risk 1/10 · Minimal
- Chance of severe wind over 30 yrs
- —
Air-quality risk 9/10 · Severe
- Unhealthy air days now
- 18 days/yr
- Unhealthy air days in 30 yrs
- 27 days/yr
Risk factors via First Street. Map © Google.
Why this score? — see what drove the D grade
The composite is a weighted blend of 9 inputs, each scored 0–100. Each bar is that input's sub-score; the figure is the points it added to the 100-point composite (weight × sub-score).
- ARV discount +15.0/15.0
- Cash flow +6.9/30.0
- Appreciation +6.2/10.0
- Schools +3.0/10.0
- Livability +2.9/5.0
- Rent growth +2.5/5.0
- Condition / age +2.5/5.0
- DSCR +1.1/10.0
- 1% rule +0.6/10.0
$250,000
🖨 Deal sheet (PDF) 📄 Offer letter ✓ Due diligence
Listing remarks
Fully permitted and ready for completion, this unfinished home is the perfect opportunity for a contractor, investor, or savvy buyer looking to customize from the ground up. The interior of the home is framed but no drywall or flooring is in. Power is already on the property, and the septic system is permitted, saving you time and upfront costs. The home is plumbed and permitted for both a gas stove and a wood stove, offering flexibility for future heating and cooking options. With key infrastructure already in place, much of the heavy lifting has been startednow it's time to add the finishing touches and make it your own. An excellent chance to create instant equity by finishing the projec
Key facts
- Permitted project
- 2.09 acre lot
- Built 2019
Tags
Neighborhood map
What this means for you Summary
Snapshot
- This is a 2-bed/1.5-bath single-family listed at $250k.
Deal economics
- At list price, monthly cash flow is $-380 ($-5k/yr) — negative.
- To cash-flow at today's rent, offer at most $183k (26.8% below list).
- To meet the 1% rule (rent ≥ 1% of price), the offer needs to be $140k (44.1% below list).
- Recommended offer: $140k (44.1% below list) — sets the bar for 1% rule.
- Cap rate 4.5% vs local median 2.1% in Georgetown — top-decile yield for the area; either an underpriced asset or a hidden risk that comps aren't pricing in. Stress-test before assuming the spread holds.
Location & tenants
- Location reads 57/100 on livability (#753 in CA) — a working-class tenant base; expect higher turnover. Strengths: housing A+, crime A-, employment B; Watch: amenities F, commute F, cost of living F.
- Black Oak Mine Unified (rural): math 25% / reading 40% proficiency, ranked #278 of 517 in CA (top 54%) — families likely to look elsewhere, expect single-tenant / working-renter base with shorter leases.
- Zoned schools: Georgetown Elementary (math 22% / reading 37%, grade F, #856 of 1,571 statewide, top 57%, 251 students, 46% FRL); Golden Sierra Junior Senior High (math 17% / reading 38%, grade F, #780 of 1,170 statewide, top 67%, 488 students, 39% FRL).
- Market conditions: 53 active listings in the ZIP; 437 units permitted in El Dorado County in 2024 (0 in 5+ unit buildings).
Forward outlook
- In year one you build about $8k of equity ($2k loan paydown + $6k appreciation (2.3% local appreciation)).
- El Dorado County population projected to shrink 3% by 2050 — rents likely to lag national; underwrite the cash flow, not the appreciation.
- By year 5, paydown + projected appreciation supports a ~$33k cash-out refi (75% LTV) — recoverable capital for the next deal without selling this one.
Negotiation context
- It's been on market 144 days — a 12% lower offer ($220k) is reasonable based on typical stale-listing flexibility.
- Current owner paid $118k; list at $250k implies a 111% gain — meaningful room to come down on a strong offer.
Risks & watch-outs
- Climate carrying-cost: severe wildfire risk — expect insurance premiums to compound above CPI over the hold.
Questions for the listing agent
- What do current leases actually rent for vs. the listed asking? Can we see a recent rent roll and the last 12 months of T-12 income?
- It's been on market 144 days. Have you received any prior offers? Is the seller open to a 44% concession, seller financing, or rate buy-down credit?
- Why hasn't it sold? Are there any deal-killer items the seller is aware of (foundation, flood, title, zoning, code violations)?
- Is there a deadline driving the sale (1031 exchange, divorce, estate, relocation)? That informs how much negotiation room exists.
- Schools are D-rated, which usually means shorter tenancies and higher turnover. Who's the typical renter profile here, and what's been the actual vacancy rate?
- The area grade is low — what's the realistic commute time and amenity access for the typical tenant pool here? Any planned neighborhood developments (good or bad) we should know about?
- What's the average days-on-market for RENTAL listings here right now (not sales)? A rising rental-DOM trend means longer vacancies and softer asking-rent achievability than the comps imply.
- What's the recent tenant-quality profile in this submarket — average credit score on applications, eviction rate, late-payment / NSF rate, and stable-employment percentage? A property-management company in the area should have these aggregated.
- How much new for-sale + rental construction is in the pipeline within 1–3 miles? Heavy new supply typically softens prices + rents 12–24 months out; constrained supply supports both.
Investment metrics
- 1% rule
- 0.56% ✗
- Cap rate
- 4.47%
- Cash-on-cash
- -6.51%
- DSCR
- 0.71
- GRM
- 14.9
CMA / ARV
- ARV (median comp)
- $332,957
- List price
- $250,000
- Delta
- -24.92%
- Verdict
- UNDERPRICED
- Comps
- 1 within 2.0 mi
Show comp detail 1 sale within ~0.75 mi
| Address | Dist | Beds/Ba | Sqft | Sold | Price | $/sf | Match |
|---|---|---|---|---|---|---|---|
| 421 Carey Ave | 0.22mi | 2/1.0 | 1,148 (-12%) | 22mo | $325,000 | $283 | 50 |
Match score weights: distance 35% · size 25% · config 20% · recency 20%. Top-matched comps best support the ARV.
Projected returns pro-forma
2.33% appreciation · 3.0% rent growth · sell at horizon
- IRR
- -0.8%
- Equity multiple
- 0.96×
- Total profit
- $-2,937
- Equity at exit
- $103,105
- IRR
- 3.5%
- Equity multiple
- 1.49×
- Total profit
- $34,473
- Equity at exit
- $152,009
Cash invested: $70,000 (down + closing). Projections, not guarantees.
Landlord ↔ Tenant lean methodology
- Overall (STATE)
- 18 Strongly Tenant-Friendly
- State California
- 18 Strongly Tenant-Friendly · D+13
- County
- — inherits STATE
- City
- — inherits STATE
ZIP-level market 95634
- Home prices YoY
- 0.9%
- Active inventory
- 53
- Price-to-rent
- 14.9×
Monthly cashflow live
- Estimated rent
- $1,397 medium interval (Pro) →
- Mortgage (P&I)
- −$1,311
- Tax from tax record
- −$68 /mo · $820/yr
- Insurance
- −$104
- HOA
- −$0
- Vacancy / Maint / Mgmt
- −$293
- Net cashflow
- $-380
Break-even live
Sensitivity live
| Price | -10% $-238 | -5% $-309 | +0% $-380 | +5% $-450 | +10% $-521 |
|---|---|---|---|---|---|
| Rent | -10% $-490 | -5% $-435 | +0% $-380 | +5% $-324 | +10% $-269 |
| Rate | -1.0pp $-254 | -0.5pp $-316 | base $-380 | +0.5pp $-444 | +1.0pp $-510 |
UW: 25.0% down · 7.5% · 30yr · 1.5% tax · 5.0% vac · 8.0% maint · 8.0% mgmt
Financing live
Cash to close
- Down payment
- $62,500
- Closing costs
- $7,500
- Reserves months
- —
- Total cash needed
- —
Loan-product check · same deal, 3 products live
Conventional
25% down · 7.5% · 30yr
- Down + closing
- —
- Monthly P&I
- —
- Monthly cashflow
- —
- DSCR
- —
- Eligible?
- —
Personal DTI + credit; lowest rate.
DSCR
20% down · 8.5% · 30yr
- Down + closing
- —
- Monthly P&I
- —
- Monthly cashflow
- —
- DSCR
- —
- Eligible?
- —
No personal income docs; deal must DSCR.
Hard money
10% down · 12.0% · 12mo
- Down + closing
- —
- Monthly P&I
- —
- Monthly cashflow
- —
- DSCR
- —
- Eligible?
- —
Short-term bridge; refi at stabilization.
Listing history 17 events
-
2026-06-21days on market $250,000 Active 144 DOM
-
2026-06-18days on market $250,000 Active 141 DOM
-
2026-06-17days on market $250,000 Active 140 DOM
-
2026-06-16days on market $250,000 Active 139 DOM
-
2026-06-15days on market $250,000 Active 138 DOM
-
2026-06-13days on market $250,000 Active 136 DOM
-
2026-06-13days on market $250,000 Active 135 DOM
-
2026-06-09days on market $250,000 Active 132 DOM
-
2026-06-08days on market $250,000 Active 131 DOM
-
2026-06-07days on market $250,000 Active 130 DOM
-
2026-06-05days on market $250,000 Active 127 DOM
-
2026-06-03days on market $250,000 Active 126 DOM
-
2026-06-02days on market $250,000 Active 125 DOM
-
2026-06-01days on market $250,000 Active 124 DOM
-
2026-05-31days on market $250,000 Active 123 DOM
-
2012-04-25soldstatus $118,500
-
1976-06-16soldstatus $20,000
ⓘ Source: listings_history table (triggers on properties + properties_extension) + one-shot
backfill from property_details.listing_events for pre-trigger history.
Tax reassessment forecast CA · Resets to sale price
- Current annual tax
- $820 · $68/mo
- Projected year-2 tax
- $1,900 · $158/mo
- Expected delta
- +$1,080/yr (+$90/mo · 131.8%)
ⓘ Screening estimate from a state-policy table — verify with the county assessor before closing.
Climate risk First Street
- Flood 1/10 Low FEMA zone D · 0% chance over 30 yrs
- Wildfire 8/10 Severe
- Heat 3/10 Moderate 7 d/yr ≥94°F today · 15 d/yr by 30 yrs out
- Wind 1/10 Low
- Air quality 9/10 Extreme 18 unhealthy d/yr today · 27 by 30 yrs out
Nearby sold comps map
Loading sold comps map…
Walkable amenities ~0.75 mi
Loading nearby amenities…
Taxation est. · year 1
- Rental income
- $16,768
- − Mortgage interest
- −$14,004
- − Property taxes
- −$820
- − Insurance
- −$1,250
- − Repairs & maintenance
- −$1,341
- − Management
- −$1,341
- − Depreciation
- −$7,273
- Taxable loss
- −$9,261
- Est. tax savings @ 24.0%
- +$2,223
- After-tax cash flow
- $-2,333/yr
For passive investors: Depreciation is non-cash, so a rental often shows a tax loss while cash-flowing — sheltering income. Rental losses are passive: they offset passive income freely, and up to $25,000/yr can offset ordinary (W-2) income if you actively participate and your MAGI is under $100k (phasing out to $0 by $150k); unused losses carry forward. On sale, claimed depreciation is recaptured at up to 25%, and gains may owe capital-gains tax (a 1031 exchange can defer both). Figures are a year-1 estimate at your 24.0% rate — not tax advice; consult a CPA.
Schools (NCES district)
- District
- Black Oak Mine Unified
- NCES district ID
- 0605240
- Math proficiency
- 25% ▼ -3.00%
- Reading proficiency
- 40% ▼ -4.00%
- Median HH income
- $68,195
- Composite
- 29.96/100
- National rank
- #6371
- State rank
- #278 of 517 in CA
Livability — Georgetown
- Score
- 57/100
- State rank
- #753
- US rank
- #21998
Category grades
Schools grade is shown separately in the Schools card above.
Census & demographics
- Population (ZIP)
- 3,792
Population outlook (El Dorado County) Hauer SSP2
- Today (2025)
- 191,666 people
- By 2030
- 193,662 · +1.0%
- By 2040
- 192,583 · +0.5%
- By 2050
- 185,904 · -3.0%
- By 2075
- 169,543 · -11.5%
- By 2100
- 139,623 · -27.2%
Race, ethnicity, and origin ACS 2023
- Neighborhood character
- Predominantly White (84%)
- Race & ethnicity
- White 84% Hispanic / Latino 10% Two or more races 5% Asian 2%
- Hispanic origin (detail)
- Mexican 4% Puerto Rican 1%
- Common ancestry
- Lithuanian 5% Slovak 4% Italian 2%
- Foreign-born
- 4% · Canada, China
- Languages at home
- 97% English-only · Spanish 2%
Political lean MEDSL · El Dorado
- 2024 margin
- R (+12.0) · D 42.6% · R 54.6% · Other 2.8%
- 2008→2024 swing
- -1.5pp toward R · 2008: -10.5pp · 2024: -12.0pp
- All cycles
- 2024: R+12.0 2020: R+8.8 2016: R+13.9 2012: R+18.2 2008: R+10.5
Not yet ingested
- Civics
- —
Market trends
- HPI YoY
- ▲ 2.33%
- Current HPI
- 255.0819
- Rent YoY
- —
- Metro
- —
- State GDP YoY
- ▲ 3.21%
- F500 in state
- 116
Industry mix (Fortune 500 HQ in CA)
| Industry | F500 HQs | Revenue |
|---|---|---|
| Technology | 27 | $1,492B |
|
||
| Financial Services | 3 | $174B |
|
||
| Retail | 3 | $44B |
|
||
| Insurance | 3 | $26B |
|
||
| Media / Entertainment | 2 | $115B |
|
||
| Pharmaceuticals / Biotech | 2 | $62B |
|
||
Price history
+492.5% since first listed2 events — show timeline
- 2012-04-25 Sold (Public Records) $118,500 Public Records
- 1976-06-16 Sold (Public Records) $20,000 Public Records
Property tax history
+2.3%/yrLatest (2025): $820 · +5.5% YoY. Source: county tax records.
Cash-flow waterfall
monthlySold comps — $/sqft
last 12 mo · ≤1 miLoading sold comps…