4428 Dorsey Dr · Cherryvale, SC
Flood risk 1/10 · Minimal
- FEMA flood zone
- X (unshaded)
- Chance of flooding over 30 yrs
- 0.0%
- Est. flood insurance / yr
- $507 – $1,088
Fire risk 5/10 · Moderate
- Est. fire insurance / yr
- $783 – $1,453
Heat risk 6/10 · Moderate
- Hot days now (above 107°F)
- 7 days/yr
- Hot days in 30 yrs
- 16 days/yr
Wind risk 8/10 · Major
- Chance of severe wind over 30 yrs
- 80.0%
Air-quality risk 2/10 · Minimal
- Unhealthy air days now
- 2 days/yr
- Unhealthy air days in 30 yrs
- 2 days/yr
Risk factors via First Street. Map © Google.
Why this score? — see what drove the D grade
The composite is a weighted blend of 9 inputs, each scored 0–100. Each bar is that input's sub-score; the figure is the points it added to the 100-point composite (weight × sub-score).
- Cash flow +15.0/30.0
- ARV discount +7.5/15.0
- 1% rule +5.0/10.0
- DSCR +5.0/10.0
- Rent growth +3.5/5.0
- Livability +2.6/5.0
- Condition / age +2.5/5.0
- Schools +1.9/10.0
- Appreciation +0.0/10.0
$18,000
🖨 Deal sheet 📄 Offer letter ✓ Due diligence
Listing remarks
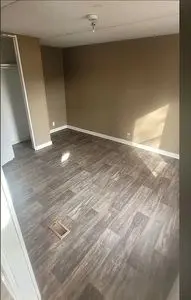
TAKE THE FIRST STEP TOWARDS MAKING YOUR DREAM Home A REALITY. This Gorgeous PROPERTY IS Complete AND WAITING FOR THE RIGHT Family TO COME ALONG AND MAKE IT THEIR OWN, WHETHER THAT& apos; S HERE OR SOMEWHERE NEW No major issues ??? just a sweet 1992 model ?? WIND ZONE 2?? TAXES PAID?? Lot rent 450 New flooring?? No land ??
Key facts
- Built 1992
- Listed 23 days
Neighborhood map
What this means for you Summary
Snapshot
- This is a 2-bed/2.0-bath other listed at $18k.
Deal economics
- At list price, monthly cash flow is $948 ($11k/yr) — positive.
- The deal already cash-flows at list — no discount required.
- Meets the 1% rule at list price ($1k rent vs $18k).
- Recommended offer: $18k (1.5% below list) — sets the bar for market timing.
Location & tenants
- Location reads 52/100 on livability (#346 in SC) — a working-class tenant base; expect higher turnover. Strengths: cost of living A+; Watch: housing D, schools F, amenities F.
- Sumter 01 (urban): math 18% / reading 28% proficiency, ranked #64 of 80 in SC (top 80%) — low school quality limits family demand, transient renter base, plan for 1-2y turnover; 64% free/reduced lunch — lower-income household profile, screen leases tightly.
- Market conditions: Rents rising fast (+4.2%/yr); 229 active listings in the ZIP; 386 units permitted in Sumter County in 2024 (0 in 5+ unit buildings).
Forward outlook
- Local home prices are declining (-3.0%/yr); year-one equity from $124 of loan paydown is wiped out by about $540 of value loss. Plan a longer hold.
- Sumter County population projected at -14% by 2050 — secular population decline; favor cash flow + early exit over multi-decade hold.
- At projected returns (-3.0% appreciation + 4.2% rent growth), your $5k cash investment doubles in ~1 year — after that, you're playing with house money.
Negotiation context
- It's been on market 24 days — a 2% lower offer ($18k) is reasonable based on typical stale-listing flexibility.
- 2 sale attempts since 2y ago with the ask held roughly flat each time — persistent listings suggest the price (not the market) is what's stuck; bring a comps-based counter.
Risks & watch-outs
- Climate carrying-cost: severe wind risk, 80% chance of damaging wind over 30y; moderate wildfire risk; extreme-heat days projected 7→16/yr by 2055 (HVAC capex compounding) — expect insurance premiums to compound above CPI over the hold.
Questions for the listing agent
- Is there a deadline driving the sale (1031 exchange, divorce, estate, relocation)? That informs how much negotiation room exists.
- Schools are F-rated, which usually means shorter tenancies and higher turnover. Who's the typical renter profile here, and what's been the actual vacancy rate?
- The area grade is low — what's the realistic commute time and amenity access for the typical tenant pool here? Any planned neighborhood developments (good or bad) we should know about?
- What's the average days-on-market for RENTAL listings here right now (not sales)? A rising rental-DOM trend means longer vacancies and softer asking-rent achievability than the comps imply.
- What's the recent tenant-quality profile in this submarket — average credit score on applications, eviction rate, late-payment / NSF rate, and stable-employment percentage? A property-management company in the area should have these aggregated.
- How much new for-sale + rental construction is in the pipeline within 1–3 miles? Heavy new supply typically softens prices + rents 12–24 months out; constrained supply supports both.
Investment metrics
- 1% rule
- 7.44% ✓
- Cap rate
- 69.47%
- Cash-on-cash
- 225.65%
- DSCR
- 11.04
- GRM
- 1.1
CMA / ARV
No comps found within radius.
Projected returns pro-forma
-3.0% appreciation · 4.19% rent growth · sell at horizon
- IRR
- —
- Equity multiple
- 12.72×
- Total profit
- $59,079
- Equity at exit
- $2,684
- IRR
- —
- Equity multiple
- 27.99×
- Total profit
- $136,040
- Equity at exit
- $1,556
Cash invested: $5,040 (down + closing). Projections, not guarantees.
Landlord ↔ Tenant lean methodology
- Overall (STATE)
- 90 Strongly Landlord-Friendly
- State South Carolina
- 90 Strongly Landlord-Friendly · R+6
- County
- — inherits STATE
- City
- — inherits STATE
ZIP-level market 29154
- Home prices YoY
- -32.7%
- Rents YoY
- 4.2%
- Active inventory
- 229
- Price-to-rent
- 1.1×
Monthly cashflow live
- Estimated rent
- $1,339 medium interval (Pro) →
- Mortgage (P&I)
- −$94
- Tax from tax record
- −$9 /mo · $103/yr
- Insurance
- −$8
- HOA
- −$0
- Vacancy / Maint / Mgmt
- −$281
- Net cashflow
- $948
Break-even live
UW: 25.0% down · 7.5% · 30yr · 1.5% tax · 5.0% vac · 8.0% maint · 8.0% mgmt
Financing live
Cash to close
- Down payment
- $4,500
- Closing costs
- $540
- Reserves months
- —
- Total cash needed
- —
Loan-product check · same deal, 3 products live
Conventional
25% down · 7.5% · 30yr
- Down + closing
- —
- Monthly P&I
- —
- Monthly cashflow
- —
- DSCR
- —
- Eligible?
- —
Personal DTI + credit; lowest rate.
DSCR
20% down · 8.5% · 30yr
- Down + closing
- —
- Monthly P&I
- —
- Monthly cashflow
- —
- DSCR
- —
- Eligible?
- —
No personal income docs; deal must DSCR.
Hard money
10% down · 12.0% · 12mo
- Down + closing
- —
- Monthly P&I
- —
- Monthly cashflow
- —
- DSCR
- —
- Eligible?
- —
Short-term bridge; refi at stabilization.
Listing history 19 events
-
2026-06-19days on market $18,000 Active 24 DOM
-
2026-06-18days on market $18,000 Active 23 DOM
-
2026-06-17days on market $18,000 Active 22 DOM
-
2026-06-16days on market $18,000 Active 21 DOM
-
2026-06-15days on market $18,000 Active 20 DOM
-
2026-06-14days on market $18,000 Active 18 DOM
-
2026-06-13days on market $18,000 Active 17 DOM
-
2026-06-10days on market $18,000 Active 15 DOM
-
2026-06-09days on market $18,000 Active 14 DOM
-
2026-06-08days on market $18,000 Active 13 DOM
-
2026-06-07days on market $18,000 Active 12 DOM
-
2026-06-02days on market $18,000 Active 7 DOM
-
2026-06-01days on market $18,000 Active 6 DOM
-
2026-05-31days on market $18,000 Active 5 DOM
-
2026-05-30days on market $18,000 Active 4 DOM
-
2026-05-26$18,000 Active
-
2024-05-23historical $800
-
2024-05-15price $800
-
2024-05-07$901
ⓘ Source: listings_history table (triggers on properties + properties_extension) + one-shot
backfill from property_details.listing_events for pre-trigger history.
Tax reassessment forecast SC · Resets to sale price
- Current annual tax
- $103 · $9/mo
- Projected year-2 tax
- $103 · $9/mo
- Expected delta
- $0/yr ($0/mo · 0.0%)
ⓘ Screening estimate from a state-policy table — verify with the county assessor before closing.
Climate risk First Street
- Flood 1/10 Low FEMA zone X (unshaded) · 0% chance over 30 yrs
- Wildfire 5/10 Major
- Heat 6/10 Major 7 d/yr ≥107°F today · 16 d/yr by 30 yrs out
- Wind 8/10 Severe 80% chance of damaging wind over 30 yrs
- Air quality 2/10 Low 2 unhealthy d/yr today · 2 by 30 yrs out
Nearby sold comps map
Loading sold comps map…
Walkable amenities ~0.75 mi
Loading nearby amenities…
Taxation est. · year 1
- Rental income
- $16,074
- − Mortgage interest
- −$1,008
- − Property taxes
- −$103
- − Insurance
- −$90
- − Repairs & maintenance
- −$1,286
- − Management
- −$1,286
- − Depreciation
- −$524
- Taxable income
- $11,777
- Est. tax owed @ 24.0%
- −$2,827
- After-tax cash flow
- $8,546/yr
For passive investors: Depreciation is non-cash, so a rental often shows a tax loss while cash-flowing — sheltering income. Rental losses are passive: they offset passive income freely, and up to $25,000/yr can offset ordinary (W-2) income if you actively participate and your MAGI is under $100k (phasing out to $0 by $150k); unused losses carry forward. On sale, claimed depreciation is recaptured at up to 25%, and gains may owe capital-gains tax (a 1031 exchange can defer both). Figures are a year-1 estimate at your 24.0% rate — not tax advice; consult a CPA.
Schools (NCES district)
- District
- Sumter 01
- NCES district ID
- 4503902
- Math proficiency
- 18% ▼ -13.00%
- Reading proficiency
- 28% ▼ -6.00%
- Median HH income
- $40,423
- Composite
- 19.45/100
- National rank
- #8775
- State rank
- #64 of 80 in SC
Livability — Cherryvale
- Score
- 52/100
- State rank
- #346
- US rank
- #24803
Category grades
Schools grade is shown separately in the Schools card above.
Census & demographics
- Census place
- Cherryvale, SC
- County
- Sumter County · 76,912 people
- Metro
- Sumter, SC
- Population (ZIP)
- 29,454
- Household income
- $62,772
- Rent vs Own
- Severe rent burden
- 338.0
Population outlook (Sumter County) Hauer SSP2
- Today (2025)
- 104,585 people
- By 2030
- 102,282 · -2.2%
- By 2040
- 96,258 · -8.0%
- By 2050
- 89,592 · -14.3%
- By 2075
- 74,715 · -28.6%
- By 2100
- 60,235 · -42.4%
Race, ethnicity, and origin ACS 2023
- Neighborhood character
- Diverse neighborhood (Simpson 0.59)
- Race & ethnicity
- White 53% Black 36% Two or more races 8% Hispanic / Latino 4% Asian 1%
- Common ancestry
- Italian 2% Serbian 2% Slovak 2%
- Foreign-born
- 2% · Canada
- Languages at home
- 96% English-only · Spanish 2% Tagalog/Filipino 1%
Political lean MEDSL · Sumter
- 2024 margin
- Toss-up / Even · D 51.9% · R 47.0% · Other 1.2%
- 2008→2024 swing
- -10.6pp toward R · 2008: 15.4pp · 2024: 4.9pp
- All cycles
- 2024: D+4.9 2020: D+13.0 2016: D+12.0 2012: D+17.5 2008: D+15.4
Not yet ingested
- Civics
- —
Market trends
- HPI YoY
- ▼ -76.65%
- Current HPI
- 157.8545
- Rent YoY
- ▲ 4.19%
- Metro
- Sumter, SC
- State GDP YoY
- ▲ 4.51%
- F500 in state
- 2
Industry mix (Fortune 500 HQ in SC)
| Industry | F500 HQs | Revenue |
|---|---|---|
| Packaging | 1 | $7B |
|
||
Price history
4 events — show timeline
- 2026-05-26 Listed $18,000 FSBO.com
- 2024-05-23 Rental Removed $800 Avail
- 2024-05-15 Price Changed $800 Avail
- 2024-05-07 Listed for Rent $901 Avail
Property tax history
-7.2%/yrLatest (2023): $103 · +1.7% YoY. Source: county tax records.
Cash-flow waterfall
monthlySold comps — $/sqft
last 12 mo · ≤1 miLoading sold comps…