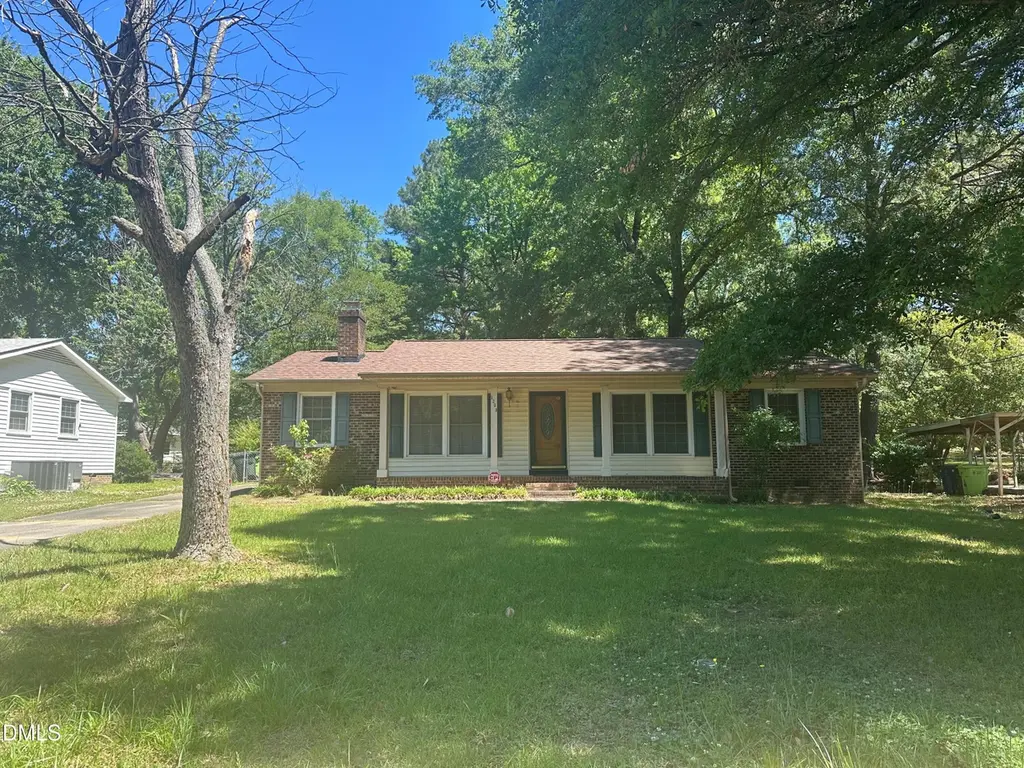
1209 Beverly Dr · Raleigh, NC
Flood risk 1/10 · Minimal
- FEMA flood zone
- X (unshaded)
- Chance of flooding over 30 yrs
- 0.0%
- Est. flood insurance / yr
- $507 – $1,088
Fire risk 1/10 · Minimal
- Est. fire insurance / yr
- $906 – $1,684
Heat risk 6/10 · Moderate
- Hot days now (above 105°F)
- 7 days/yr
- Hot days in 30 yrs
- 17 days/yr
Wind risk 6/10 · Moderate
- Chance of severe wind over 30 yrs
- 61.0%
Air-quality risk 3/10 · Minor
- Unhealthy air days now
- 2 days/yr
- Unhealthy air days in 30 yrs
- 2 days/yr
Risk factors via First Street. Map © Google.
Why this score? — see what drove the C- grade
The composite is a weighted blend of 9 inputs, each scored 0–100. Each bar is that input's sub-score; the figure is the points it added to the 100-point composite (weight × sub-score).
- ARV discount +15.0/15.0
- Cash flow +14.3/30.0
- Schools +4.9/10.0
- DSCR +4.3/10.0
- Livability +4.2/5.0
- 1% rule +3.2/10.0
- Rent growth +2.6/5.0
- Condition / age +2.5/5.0
- Appreciation +0.0/10.0
$236,250
🖨 Deal sheet (PDF) 📄 Offer letter ✓ Due diligence
Listing remarks
Offer accepted ($225,000) and submitted to Wake County special proceedings division for the 10 upset bid period, which runs through 6/25/26 at 5 pm. The upset bid must be $236,250 or higher. A 5% deposit, based on the upset bid purchase price, is required. Agents and buyers must submit all upset bids at the Wake County Special Proceedings Division at the old courthouse ( 316 Fayetteville St, Raleigh, NC 27601) on the 12th floor. Investor Special - Ready for Transformation! Attention investors, flippers, and cash buyers. 3-bedroom, 1.5-bath ranch in an established neighborhood seeing strong renovation activity and rising values. Large living room with fireplace. Dining area and laundry room.
Key facts
- Laundry room
- Dining area
- Large living room
Tags
Property features AI
Finance
- Other: Living area reported as approximately 1,250; Structure type: House
- Financial info: Annual tax amount listed
- HOA & community: No association; Not a senior community
Exterior
- Utilities: Public water; Public sewer
- Home design: One-story house
- Construction: Brick and vinyl siding exterior
- Exterior features: Shingle roof; Lot approximately 0.31 acre; Publicly maintained road access; Zoned R-6
Interior
- Bedrooms: 3 bedrooms (all on the main level)
- Flooring: Carpet
- Bathrooms: 1 full bathroom; 1 half bathroom
- Heating & cooling: Heating present (type: Other); Cooling with wall/window unit(s)
- Interior features: Carpet flooring
Neighborhood map
What this means for you Summary
Snapshot
- This is a 3-bed/1.5-bath single-family listed at $236k.
Deal economics
- At list price, monthly cash flow is $43 ($514/yr) — positive.
- The deal already cash-flows at list — no discount required.
- To meet the 1% rule (rent ≥ 1% of price), the offer needs to be $194k (18.0% below list).
- Recommended offer: $194k (18.0% below list) — sets the bar for 1% rule.
- Cap rate 6.5% vs local median 2.7% in Raleigh — top-decile yield for the area; either an underpriced asset or a hidden risk that comps aren't pricing in. Stress-test before assuming the spread holds.
Location & tenants
- Location reads 83/100 on livability (#10 in NC, #1,028 nationally) — a professional / high-income tenant draw. Strengths: amenities A+, commute A+, housing A+; Watch: crime F.
- Wake County Schools (suburban): math 52% / reading 60% proficiency, ranked #35 of 178 in NC (top 20%) — acceptable for families but not a draw, mixed tenant base, ~2y average lease.
- Zoned schools: North Ridge Elementary (math 45% / reading 53%, grade D, #459 of 1,410 statewide, top 33%, 708 students, 40% FRL); West Millbrook Middle (math 43% / reading 54%, grade C-, #127 of 475 statewide, top 28%, 1,046 students, 40% FRL); Enloe High (math 64% / reading 75%, grade B, #121 of 535 statewide, top 24%, 2,502 students, 27% FRL).
- Market conditions: Rents flat; 594 active listings in the ZIP; 33 comparable units currently listed for rent nearby; rentals at typical pace (median 18d on market — plan ~3-4 weeks tenant-placement turnaround); 15,249 units permitted in Wake County in 2024 (5,568 in 5+ unit buildings).
- This rent runs 34% of the median local income ($68k/yr) — at the standard rent-burdened threshold; future hikes will face affordability resistance.
Forward outlook
- Local home prices are declining (-3.0%/yr); year-one equity from $2k of loan paydown is wiped out by about $7k of value loss. Plan a longer hold.
- Wake County population projected at +51% by 2050 — long-run rental-demand tailwind backs the buy-and-hold thesis.
Negotiation context
- It's been on market 44 days — a 3% lower offer ($229k) is reasonable based on typical stale-listing flexibility.
- 2 sale attempts since 2y ago; this cycle's ask is 18% above the opening price — seller raised mid-cycle; expect resistance to lowballs.
- Current owner paid $62k; list at $236k implies a 281% gain — meaningful room to come down on a strong offer.
Risks & watch-outs
- Climate carrying-cost: major wind risk, 61% chance of damaging wind over 30y; extreme-heat days projected 7→17/yr by 2055 (HVAC capex compounding) — expect insurance premiums to compound above CPI over the hold.
Questions for the listing agent
- It's been on market 44 days. Have you received any prior offers? Is the seller open to a 18% concession, seller financing, or rate buy-down credit?
- Built in 1967 — when were the roof, HVAC, electrical panel, plumbing, and water heater last replaced?
- Is there a deadline driving the sale (1031 exchange, divorce, estate, relocation)? That informs how much negotiation room exists.
- Schools are B-rated — typically a magnet for longer-tenancy family renters. What's the average tenant stay here, and is there a school-zone premium baked into asking?
- Crime grade is F in this area — have there been break-ins, vandalism, or insurance claims at this property in the last 3 years? What carrier currently insures it and at what premium?
- What's the average days-on-market for RENTAL listings here right now (not sales)? A rising rental-DOM trend means longer vacancies and softer asking-rent achievability than the comps imply.
- What's the recent tenant-quality profile in this submarket — average credit score on applications, eviction rate, late-payment / NSF rate, and stable-employment percentage? A property-management company in the area should have these aggregated.
- How much new for-sale + rental construction is in the pipeline within 1–3 miles? Heavy new supply typically softens prices + rents 12–24 months out; constrained supply supports both.
Investment metrics
- 1% rule
- 0.82% ✗
- Cap rate
- 6.51%
- Cash-on-cash
- 0.78%
- DSCR
- 1.03
- GRM
- 10.2
CMA / ARV
- ARV (on-the-fly)
- $310,000
- Comps found
- 8
Show comp detail 8 sales within ~0.75 mi
| Address | Dist | Beds/Ba | Sqft | Sold | Price | $/sf | Match |
|---|---|---|---|---|---|---|---|
| 1320 Londonderry Cir | 0.33mi | 3/1.5 | 1,257 (+1%) | 6mo | $291,500 | $232 | 78 |
| 2431 Jimmy Carter Way | 0.48mi | 3/2.0 | 1,255 (+0%) | 17mo | $250,000 | $199 | 61 |
| 809 Grantland Dr | 0.73mi | 4/1.5 (+1) | 1,323 (+6%) | 1mo | $220,000 | $166 | 50 |
| 912 Cooper Rd | 0.46mi | 3/2.0 | 1,150 (-8%) | 22mo | $286,000 | $249 | 45 |
| 833 Brigham Rd | 0.66mi | 3/2.0 | 1,123 (-10%) | 10mo | $308,000 | $274 | 42 |
| 804 Brigham Rd | 0.72mi | 3/2.0 | 1,134 (-9%) | 19mo | $315,000 | $278 | 33 |
| 708 Glenbrook Dr | 0.65mi | 4/2.0 (+1) | 1,330 (+6%) | 23mo | $330,000 | $248 | 33 |
| 446 Glenbrook Dr | 0.73mi | 3/1.0 | 1,409 (+13%) | 22mo | $280,000 | $199 | 25 |
Match score weights: distance 35% · size 25% · config 20% · recency 20%. Top-matched comps best support the ARV.
Projected returns pro-forma
-3.0% appreciation · 0.2% rent growth · sell at horizon
- IRR
- -18.0%
- Equity multiple
- 0.38×
- Total profit
- $-40,926
- Equity at exit
- $35,226
- IRR
- -16.2%
- Equity multiple
- 0.20×
- Total profit
- $-52,975
- Equity at exit
- $20,427
Cash invested: $66,150 (down + closing). Projections, not guarantees.
Landlord ↔ Tenant lean methodology
- Overall (STATE)
- 85 Strongly Landlord-Friendly
- State North Carolina
- 85 Strongly Landlord-Friendly · R+3
- County
- — inherits STATE
- City
- — inherits STATE
ZIP-level market 27610
- Rents YoY
- 0.2%
- Active inventory
- 594
- Price-to-rent
- 10.2×
Monthly cashflow live
- Estimated rent
- $1,938 high interval (Pro) →
- Mortgage (P&I)
- −$1,239
- Tax from tax record
- −$151 /mo · $1,812/yr
- Insurance
- −$98
- HOA
- −$0
- Vacancy / Maint / Mgmt
- −$407
- Net cashflow
- $43
Break-even live
Sensitivity live
| Price | -10% $177 | -5% $110 | +0% $43 | +5% $-24 | +10% $-91 |
|---|---|---|---|---|---|
| Rent | -10% $-110 | -5% $-34 | +0% $43 | +5% $119 | +10% $196 |
| Rate | -1.0pp $162 | -0.5pp $103 | base $43 | +0.5pp $-18 | +1.0pp $-81 |
UW: 25.0% down · 7.5% · 30yr · 1.5% tax · 5.0% vac · 8.0% maint · 8.0% mgmt
Financing live
Cash to close
- Down payment
- $59,062
- Closing costs
- $7,088
- Reserves months
- —
- Total cash needed
- —
Loan-product check · same deal, 3 products live
Conventional
25% down · 7.5% · 30yr
- Down + closing
- —
- Monthly P&I
- —
- Monthly cashflow
- —
- DSCR
- —
- Eligible?
- —
Personal DTI + credit; lowest rate.
DSCR
20% down · 8.5% · 30yr
- Down + closing
- —
- Monthly P&I
- —
- Monthly cashflow
- —
- DSCR
- —
- Eligible?
- —
No personal income docs; deal must DSCR.
Hard money
10% down · 12.0% · 12mo
- Down + closing
- —
- Monthly P&I
- —
- Monthly cashflow
- —
- DSCR
- —
- Eligible?
- —
Short-term bridge; refi at stabilization.
Rent comps 33 comps
| Address | Beds | Baths | Sqft | Rent | $/sqft | DOM | Units | Dist |
|---|---|---|---|---|---|---|---|---|
| 1611 Royal Foxhound Ln Raleigh, NC | 2.0–4.0 | 2.0 | 1214 | $1,597 | $1.32 | 3d | 31 | 0.59mi |
| 709 Glenbrook Dr Raleigh, NC | 3.0 | 1.0 | 1185 | $1,550 | $1.31 | 25d | 1 | 0.63mi |
| 2012 Winston Diamond Ct Raleigh, NC | 3.0 | 2.5 | 1369 | $1,830 | $1.34 | 25d | 1 | 0.64mi |
| 825 Rawls Dr Raleigh, NC | 3.0 | 2.0 | 1500 | $1,845 | $1.23 | 14d | 1 | 0.67mi |
| 825 Rawls Dr Raleigh, NC | 3.0 | 2.0 | 1500 | $1,845 | $1.23 | 22d | 1 | 0.67mi |
| 832 Brigham Rd Raleigh, NC | 3.0 | 1.5 | 1107 | $1,595 | $1.44 | 25d | 1 | 0.68mi |
| 3322 Bell Dr Raleigh, NC | 3.0 | 2.0 | 1569 | $2,100 | $1.34 | 25d | 1 | 0.69mi |
| 2147 Sunny Cove Dr Raleigh, NC | 3.0 | 2.5 | 1710 | $1,895 | $1.11 | 25d | 1 | 0.77mi |
| 2321 Stoney Spring Dr Raleigh, NC | 1.0–2.0 | 1.0–2.0 | 879 | $1,541 | $1.75 | 3d | 103 | 0.81mi |
| 713 Grantland Dr Raleigh, NC | 3.0 | 3.0 | 1323 | $1,995 | $1.51 | 19d | 1 | 0.83mi |
| 312 Dacian Rd Raleigh, NC | 2.0 | 2.0 | 1000 | $1,345 | $1.34 | 25d | 1 | 0.83mi |
| 308 Dacian Rd Raleigh, NC | 2.0 | 2.0 | 1000 | $1,345 | $1.34 | 22d | 1 | 0.84mi |
| 308 Dacian Rd Raleigh, NC | 2.0 | 2.0 | 1000 | $1,345 | $1.34 | 5d | 1 | 0.84mi |
| 308 Dacian Rd Apt B Raleigh, NC | 2.0 | 2.0 | 1000 | $1,345 | $1.34 | 25d | 1 | 0.84mi |
| 3108 Woodpecker Ct Raleigh, NC | 2.0 | 2.0 | 934 | $1,400 | $1.50 | 22d | 1 | 0.92mi |
| 2411 Aurora Cove Ct Raleigh, NC | 1.0–3.0 | 1.0–2.0 | 1001 | $1,952 | $1.95 | 3d | 12 | 0.93mi |
| 737 Southgate Dr Raleigh, NC | 3.0 | 2.5 | 1332 | $1,845 | $1.39 | 5d | 1 | 1.01mi |
| 2804 Donovan Pl Raleigh, NC | 3.0 | 1.5 | 1125 | $1,697 | $1.51 | 14d | 1 | 1.03mi |
| 1622 Proctor Rd Raleigh, NC | 2.0–3.0 | 1.0 | 829 | $1,505 | $1.81 | 5d | 6 | 1.05mi |
| 838 Oak Center Dr Raleigh, NC | 3.0 | 2.5 | 1463 | $1,995 | $1.36 | 25d | 1 | 1.05mi |
| 802 Star Ridge Dr Raleigh, NC | 3.0 | 2.5 | 1447 | $1,800 | $1.24 | 18d | 1 | 1.06mi |
| 804 Oak Center Dr Raleigh, NC | 3.0 | 2.5 | 1447 | $1,900 | $1.31 | 21d | 1 | 1.10mi |
| 1704 Sundial Pl Raleigh, NC | 4.0 | 2.0 | 1554 | $1,800 | $1.16 | 5d | 1 | 1.11mi |
| 2413 Small Branch Trl Raleigh, NC | 3.0 | 2.5 | 1592 | $2,488 | $1.56 | 16d | 30 | 1.16mi |
| 3369 Bridgeville Rd Raleigh, NC | 3.0 | 2.5 | 1200 | $1,699 | $1.42 | 5d | 1 | 1.16mi |
| 2292 Fox Ridge Manor Rd Raleigh, NC | 2.0–3.0 | 1.5–2.5 | 1124 | $1,750 | $1.56 | 14d | 1 | 1.17mi |
| 2417 Small Branch Trl Raleigh, NC | 3.0 | 3.0 | 1592 | $2,450 | $1.54 | 5d | 1 | 1.17mi |
| 2419 Small Branch Trl Raleigh, NC | 3.0 | 3.0 | 1592 | $2,525 | $1.59 | 5d | 1 | 1.17mi |
| 2423 Small Branch Trl Raleigh, NC | 3.0 | 3.0 | 1592 | $2,450 | $1.54 | 5d | 1 | 1.18mi |
| 503 Erie Rd Unit 503 Raleigh, NC | 3.0 | 2.5 | 1470 | $1,650 | $1.12 | 16d | 1 | 1.20mi |
| 2409 Foxtrot Rd Raleigh, NC | 2.0 | 1.0 | 1200 | $2,300 | $1.92 | 25d | 1 | 1.34mi |
| 1701 E Lenoir St Raleigh, NC | 3.0 | 2.0 | 1100 | $2,900 | $2.64 | 25d | 1 | 1.34mi |
| 1423 Tamarino Dr Raleigh, NC | 3.0 | 2.5 | 1400 | $1,895 | $1.35 | 19d | 1 | 1.48mi |
Listing history 25 events
-
2026-06-21days on market $236,250 Active 44 DOM
-
2026-06-18days on market $236,250 Active 41 DOM
-
2026-06-17days on market $236,250 Active 40 DOM
-
2026-06-16pricedays on market $236,250 Active 39 DOM
-
2026-06-15days on market $224,869 Active 38 DOM
-
2026-06-13days on market $224,869 Active 36 DOM
-
2026-06-13pricedays on market $224,869 Active 35 DOM
-
2026-06-09days on market $214,161 Active 32 DOM
-
2026-06-08days on market $214,161 Active 31 DOM
-
2026-06-07days on market $214,161 Active 30 DOM
-
2026-06-05pricedays on market $214,161 Active 27 DOM
-
2026-06-03days on market $203,963 Active 26 DOM
-
2026-06-02days on market $203,963 Active 25 DOM
-
2026-06-01days on market $203,963 Active 24 DOM
-
2026-05-31days on market $203,963 Active 23 DOM
-
2026-05-13price $194,250
-
2026-05-08$200,000 Active
-
2024-11-01status Pending
-
2024-11-01historical
-
2024-09-21price $260,000
-
2024-08-22$275,000 Active
-
1988-09-02soldstatus $62,000
-
1988-07-11soldstatus $62,000
-
1983-12-31soldstatus $13,000
-
1980-11-01soldstatus $13,000
ⓘ Source: listings_history table (triggers on properties + properties_extension) + one-shot
backfill from property_details.listing_events for pre-trigger history.
Tax reassessment forecast NC · Resets to sale price
- Current annual tax
- $1,812 · $151/mo
- Projected year-2 tax
- $1,937 · $161/mo
- Expected delta
- +$125/yr (+$10/mo · 6.9%)
ⓘ Screening estimate from a state-policy table — verify with the county assessor before closing.
Climate risk First Street
- Flood 1/10 Low FEMA zone X (unshaded) · 0% chance over 30 yrs
- Wildfire 1/10 Low
- Heat 6/10 Major 7 d/yr ≥105°F today · 17 d/yr by 30 yrs out
- Wind 6/10 Major 61% chance of damaging wind over 30 yrs
- Air quality 3/10 Moderate 2 unhealthy d/yr today · 2 by 30 yrs out
Nearby sold comps map
Loading sold comps map…
Walkable amenities ~0.75 mi
Loading nearby amenities…
Taxation est. · year 1
- Rental income
- $23,259
- − Mortgage interest
- −$13,234
- − Property taxes
- −$1,812
- − Insurance
- −$1,181
- − Repairs & maintenance
- −$1,861
- − Management
- −$1,861
- − Depreciation
- −$6,873
- Taxable loss
- −$3,562
- Est. tax savings @ 24.0%
- +$855
- After-tax cash flow
- $1,369/yr
For passive investors: Depreciation is non-cash, so a rental often shows a tax loss while cash-flowing — sheltering income. Rental losses are passive: they offset passive income freely, and up to $25,000/yr can offset ordinary (W-2) income if you actively participate and your MAGI is under $100k (phasing out to $0 by $150k); unused losses carry forward. On sale, claimed depreciation is recaptured at up to 25%, and gains may owe capital-gains tax (a 1031 exchange can defer both). Figures are a year-1 estimate at your 24.0% rate — not tax advice; consult a CPA.
Schools (NCES district)
- District
- Wake County Schools
- NCES district ID
- 3704720
- Math proficiency
- 52% ▲ 2.00%
- Reading proficiency
- 60% ▲ 4.00%
- Median HH income
- $67,509
- Composite
- 49.41/100
- National rank
- #2010
- State rank
- #35 of 178 in NC
Livability — Raleigh
- Score
- 83/100
- State rank
- #10
- US rank
- #1028
Category grades
Schools grade is shown separately in the Schools card above.
Census & demographics
- Census place
- Raleigh, NC
- County
- Wake County · 1,216,256 people
- City population
- 569,344
- Metro
- Raleigh-Cary, NC
- Population (ZIP)
- 81,419
- Household income
- $67,932
- Rent vs Own
- Severe rent burden
- 3499.0
Population outlook (Wake County) Hauer SSP2
- Today (2025)
- 1,293,152 people
- By 2030
- 1,428,223 · +10.4%
- By 2040
- 1,698,188 · +31.3%
- By 2050
- 1,955,807 · +51.2%
- By 2075
- 2,520,273 · +94.9%
- By 2100
- 2,893,335 · +123.7%
Race, ethnicity, and origin ACS 2023
- Neighborhood character
- Diverse neighborhood (Simpson 0.59)
- Race & ethnicity
- Black 59% Hispanic / Latino 20% White 15% Two or more races 8% Asian 1%
- Hispanic origin (detail)
- Mexican 10% Puerto Rican 1% Dominican 1%
- Common ancestry
- Lithuanian 1% Slovak 1% Serbian 1%
- Foreign-born
- 14% · Canada
- Languages at home
- 77% English-only · Spanish 18% Arabic 1% French/Haitian/Cajun 1%
Political lean MEDSL · Wake
- 2024 margin
- Strong D (+25.5) · D 61.9% · R 36.4% · Other 1.7%
- 2008→2024 swing
- +11.1pp toward D · 2008: 14.4pp · 2024: 25.5pp
- All cycles
- 2024: D+25.5 2020: D+26.4 2016: D+20.5 2012: D+10.2 2008: D+14.4
Not yet ingested
- Civics
- —
Market trends
- HPI YoY
- ▼ -131.88%
- Current HPI
- 237.704
- Rent YoY
- ▲ 0.20%
- Metro
- Raleigh-Cary, NC
- State GDP YoY
- ▲ 3.28%
- F500 in state
- 26
Industry mix (Fortune 500 HQ in NC)
| Industry | F500 HQs | Revenue |
|---|---|---|
| Financial Services | 2 | $213B |
|
||
| Retail | 2 | $95B |
|
||
| Industrial Conglomerate | 1 | $38B |
|
||
| Metals / Steel | 1 | $35B |
|
||
| Utilities | 1 | $30B |
|
||
| Industrial Machinery | 1 | $19B |
|
||
Price history
+1394.2% since first listed10 events — show timeline
- 2026-05-13 Price Changed $194,250 TMLS
- 2026-05-08 Listed $200,000 TMLS
- 2024-11-01 Pending — TMLS
- 2024-11-01 Listing Removed — TMLS
- 2024-09-21 Price Changed $260,000 TMLS
- 2024-08-22 Listed $275,000 TMLS
- 1988-09-02 Sold (Public Records) $62,000 Public Records
- 1988-07-11 Sold (Public Records) $62,000 Public Records
- 1983-12-31 Sold (Public Records) $13,000 Public Records
- 1980-11-01 Sold (Public Records) $13,000 Public Records
Property tax history
+4.3%/yrLatest (2025): $1,812 · +0.4% YoY. Source: county tax records.
Cash-flow waterfall
monthlySold comps — $/sqft
last 12 mo · ≤1 miLoading sold comps…