1559 Larkmore Ln · Grass Lake, MI
Flood risk No data
- FEMA flood zone
- —
- Chance of flooding over 30 yrs
- —
- Est. flood insurance / yr
- —
Fire risk No data
- Est. fire insurance / yr
- —
Heat risk No data
- Hot days now (above threshold)
- —
- Hot days in 30 yrs
- —
Wind risk No data
- Chance of severe wind over 30 yrs
- —
Air-quality risk No data
- Unhealthy air days now
- —
- Unhealthy air days in 30 yrs
- —
Risk factors via First Street. Map © Google.
Why this score? — see what drove the C- grade
The composite is a weighted blend of 9 inputs, each scored 0–100. Each bar is that input's sub-score; the figure is the points it added to the 100-point composite (weight × sub-score).
- Cash flow +22.5/30.0
- ARV discount +7.5/15.0
- DSCR +7.2/10.0
- 1% rule +4.6/10.0
- Schools +3.8/10.0
- Livability +3.7/5.0
- Rent growth +2.5/5.0
- Condition / age +2.5/5.0
- Appreciation +0.0/10.0
$135,000
🖨 Deal sheet (PDF) 📄 Offer letter ✓ Due diligence
Listing remarks MLS
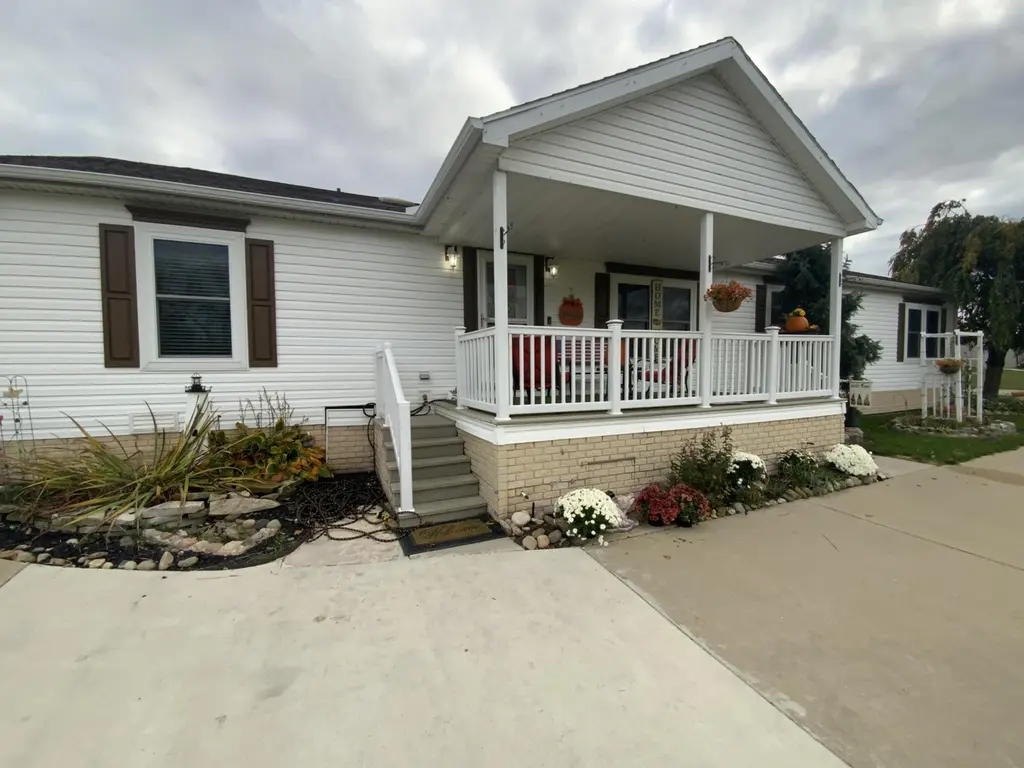
Come live at Andover! This home and yard have been immaculately maintained for more than 20 years. Lots of space for relaxing and entertaining with over 1800 square feet and an attached two car garage. The open field adjacent to the home is great for watching wildlife while enjoying peace and quiet on your covered porch. New roof in 2020 New AC in 2024 New appliances in 2021 New water heater in 2024
Key facts
- Covered porch
- New water heater
- New appliances
Tags
Property features AI
Exterior
- Parking: Attached 2-car garage
- Utilities: Public water; Natural gas water heater
- Home design: Residential property; Built in 2001
- Construction: Vinyl siding; Stone roof; Built in 2001
- Exterior features: Paved road access; Approximately 38.59 acres
Interior
- Kitchen: Dishwasher; Microwave; Oven; Range; Refrigerator
- Bedrooms: Total rooms: 9
- Bathrooms: 2 full bathrooms
- Heating & cooling: Forced air heating; Has heating; Has cooling
- Interior features: Eat-in kitchen; Gas log fireplace; Basement (other)
- Laundry & utility: Washer; Dryer; Natural gas water heater
Neighborhood map
What this means for you Summary
Snapshot
- This is a 3-bed/2.0-bath other listed at $135k.
Deal economics
- At list price, monthly cash flow is $227 ($3k/yr) — positive.
- The deal already cash-flows at list — no discount required.
- To meet the 1% rule (rent ≥ 1% of price), the offer needs to be $130k (4.1% below list).
- Recommended offer: $130k (4.1% below list) — sets the bar for 1% rule.
- Cap rate 8.3% vs local median 1.9% in Grass Lake — top-decile yield for the area; either an underpriced asset or a hidden risk that comps aren't pricing in. Stress-test before assuming the spread holds.
Location & tenants
- Location reads 73/100 on livability (#217 in MI) — a middle-class / working-renter tenant base. Strengths: crime A+, cost of living A+, housing A+; Watch: amenities F, commute F, health & safety F.
- Grass Lake Community Schools (rural): math 37% / reading 49% proficiency, ranked #146 of 540 in MI (top 27%) — families likely to look elsewhere, expect single-tenant / working-renter base with shorter leases.
- Market conditions: 71 active listings in the ZIP; 1 comparable units currently listed for rent nearby; 317 units permitted in Jackson County in 2024 (103 in 5+ unit buildings).
Forward outlook
- Local home prices are declining (-3.0%/yr); year-one equity from $933 of loan paydown is wiped out by about $4k of value loss. Plan a longer hold.
- Jackson County population projected at -13% by 2050 — secular population decline; favor cash flow + early exit over multi-decade hold.
Negotiation context
- It's been on market 17 days — a 2% lower offer ($133k) is reasonable based on typical stale-listing flexibility.
- 5 sale attempts with the ask held roughly flat each time — persistent listings suggest the price (not the market) is what's stuck; bring a comps-based counter.
Questions for the listing agent
- Is there a deadline driving the sale (1031 exchange, divorce, estate, relocation)? That informs how much negotiation room exists.
- Schools are B-rated — typically a magnet for longer-tenancy family renters. What's the average tenant stay here, and is there a school-zone premium baked into asking?
- What's the average days-on-market for RENTAL listings here right now (not sales)? A rising rental-DOM trend means longer vacancies and softer asking-rent achievability than the comps imply.
- What's the recent tenant-quality profile in this submarket — average credit score on applications, eviction rate, late-payment / NSF rate, and stable-employment percentage? A property-management company in the area should have these aggregated.
- How much new for-sale + rental construction is in the pipeline within 1–3 miles? Heavy new supply typically softens prices + rents 12–24 months out; constrained supply supports both.
Investment metrics
- 1% rule
- 0.96% ✗
- Cap rate
- 8.31%
- Cash-on-cash
- 7.21%
- DSCR
- 1.32
- GRM
- 8.7
CMA / ARV
No comps found within radius.
Projected returns pro-forma
-3.0% appreciation · 3.0% rent growth · sell at horizon
- IRR
- -5.3%
- Equity multiple
- 0.80×
- Total profit
- $-7,470
- Equity at exit
- $20,129
- IRR
- 4.3%
- Equity multiple
- 1.31×
- Total profit
- $11,865
- Equity at exit
- $11,672
Cash invested: $37,800 (down + closing). Projections, not guarantees.
Landlord ↔ Tenant lean methodology
- Overall (STATE)
- 62 Landlord-Friendly
- State Michigan
- 62 Landlord-Friendly · EVEN
- County
- — inherits STATE
- City
- — inherits STATE
ZIP-level market 49240
- Home prices YoY
- -25.9%
- Active inventory
- 71
- Price-to-rent
- 8.7×
Monthly cashflow live
- Estimated rent
- $1,295 medium interval (Pro) →
- Mortgage (P&I)
- −$708
- Tax from tax record
- −$32 /mo · $380/yr
- Insurance
- −$56
- HOA
- −$0
- Vacancy / Maint / Mgmt
- −$272
- Net cashflow
- $227
Break-even live
Sensitivity live
| Price | -10% $304 | -5% $265 | +0% $227 | +5% $189 | +10% $151 |
|---|---|---|---|---|---|
| Rent | -10% $125 | -5% $176 | +0% $227 | +5% $278 | +10% $329 |
| Rate | -1.0pp $295 | -0.5pp $262 | base $227 | +0.5pp $192 | +1.0pp $157 |
UW: 25.0% down · 7.5% · 30yr · 1.5% tax · 5.0% vac · 8.0% maint · 8.0% mgmt
Financing live
Cash to close
- Down payment
- $33,750
- Closing costs
- $4,050
- Reserves months
- —
- Total cash needed
- —
Loan-product check · same deal, 3 products live
Conventional
25% down · 7.5% · 30yr
- Down + closing
- —
- Monthly P&I
- —
- Monthly cashflow
- —
- DSCR
- —
- Eligible?
- —
Personal DTI + credit; lowest rate.
DSCR
20% down · 8.5% · 30yr
- Down + closing
- —
- Monthly P&I
- —
- Monthly cashflow
- —
- DSCR
- —
- Eligible?
- —
No personal income docs; deal must DSCR.
Hard money
10% down · 12.0% · 12mo
- Down + closing
- —
- Monthly P&I
- —
- Monthly cashflow
- —
- DSCR
- —
- Eligible?
- —
Short-term bridge; refi at stabilization.
Rent comps 1 comps
| Address | Beds | Baths | Sqft | Rent | $/sqft | DOM | Units | Dist |
|---|---|---|---|---|---|---|---|---|
| 104 E Michigan Ave Grass Lake, MI | 2.0 | 1.5 | 1496 | $1,295 | $0.87 | 22d | 1 | 1.23mi |
Listing history 14 events
-
2026-06-21days on market $135,000 Active 17 DOM
-
2026-06-19days on market $135,000 Active 15 DOM
-
2026-06-18days on market $135,000 Active 14 DOM
-
2026-06-17days on market $135,000 Active 13 DOM
-
2026-06-16days on market $135,000 Active 12 DOM
-
2026-06-15days on market $135,000 Active 11 DOM
-
2026-06-14days on market $135,000 Active 9 DOM
-
2026-06-13days on market $135,000 Active 8 DOM
-
2026-06-10days on market $135,000 Active 6 DOM
-
2026-06-09days on market $135,000 Active 5 DOM
-
2026-06-08days on market $135,000 Active 4 DOM
-
2026-06-07days on market $135,000 Active 3 DOM
-
2026-06-05remarks 402-char remark
-
2026-06-05$135,000 Active 1 DOM
ⓘ Source: listings_history table (triggers on properties + properties_extension) + one-shot
backfill from property_details.listing_events for pre-trigger history.
Tax reassessment forecast MI · Partial reset (capped growth)
- Current annual tax
- $380 · $32/mo
- Projected year-2 tax
- $1,229 · $102/mo
- Expected delta
- +$850/yr (+$71/mo · 223.7%)
ⓘ Screening estimate from a state-policy table — verify with the county assessor before closing.
Nearby sold comps map
Loading sold comps map…
Walkable amenities ~0.75 mi
Loading nearby amenities…
Taxation est. · year 1
- Rental income
- $15,540
- − Mortgage interest
- −$7,562
- − Property taxes
- −$380
- − Insurance
- −$675
- − Repairs & maintenance
- −$1,243
- − Management
- −$1,243
- − Depreciation
- −$3,927
- Taxable income
- $509
- Est. tax owed @ 24.0%
- −$122
- After-tax cash flow
- $2,604/yr
For passive investors: Depreciation is non-cash, so a rental often shows a tax loss while cash-flowing — sheltering income. Rental losses are passive: they offset passive income freely, and up to $25,000/yr can offset ordinary (W-2) income if you actively participate and your MAGI is under $100k (phasing out to $0 by $150k); unused losses carry forward. On sale, claimed depreciation is recaptured at up to 25%, and gains may owe capital-gains tax (a 1031 exchange can defer both). Figures are a year-1 estimate at your 24.0% rate — not tax advice; consult a CPA.
Schools (NCES district)
- District
- Grass Lake Community Schools
- NCES district ID
- 2616830
- Math proficiency
- 37% ▼ -4.00%
- Reading proficiency
- 49% ▼ -2.00%
- Median HH income
- $65,842
- Composite
- 38.45/100
- National rank
- #4193
- State rank
- #146 of 540 in MI
Livability — Grass Lake
- Score
- 73/100
- State rank
- #217
- US rank
- #5357
Category grades
Schools grade is shown separately in the Schools card above.
Census & demographics
- Population (ZIP)
- 9,206
Population outlook (Jackson County) Hauer SSP2
- Today (2025)
- 156,365 people
- By 2030
- 153,123 · -2.1%
- By 2040
- 144,981 · -7.3%
- By 2050
- 135,671 · -13.2%
- By 2075
- 113,833 · -27.2%
- By 2100
- 86,592 · -44.6%
Race, ethnicity, and origin ACS 2023
- Neighborhood character
- Predominantly White (95%)
- Race & ethnicity
- White 95% Two or more races 3% Hispanic / Latino 2%
- Common ancestry
- Romanian 11% Lithuanian 5% Slovak 4%
- Foreign-born
- 2% · China, Canada
- Languages at home
- 98% English-only · Other Indo-European 1% Spanish 1%
Political lean MEDSL · Jackson
- 2024 margin
- Strong R (+21.3) · D 38.6% · R 59.9% · Other 1.5%
- 2008→2024 swing
- -23.7pp toward R · 2008: 2.4pp · 2024: -21.3pp
- All cycles
- 2024: R+21.3 2020: R+19.0 2016: R+20.1 2012: R+5.8 2008: D+2.4
Not yet ingested
- Civics
- —
Market trends
- HPI YoY
- ▼ -99.27%
- Current HPI
- 283.3744
- Rent YoY
- —
- Metro
- —
- State GDP YoY
- ▲ 1.37%
- F500 in state
- 28
Industry mix (Fortune 500 HQ in MI)
| Industry | F500 HQs | Revenue |
|---|---|---|
| Automotive Parts | 3 | $48B |
|
||
| Automotive | 2 | $372B |
|
||
| Chemicals | 1 | $45B |
|
||
| Automotive Retail | 1 | $29B |
|
||
| Healthcare / Medical Devices | 1 | $23B |
|
||
| Automotive Technology | 1 | $20B |
|
||
Price history
-10.0% since first listed10 events — show timeline
- 2026-06-04 Listed $135,000 SW Michigan MLS
- 2026-06-04 Listed $135,000 MiRealSource-MiMLS
- 2026-06-04 Listed $135,000 REALCOMP
- 2026-04-25 Listing Removed — MiRealSource-MiMLS
- 2026-04-24 Listing Removed — REALCOMP
- 2026-02-03 Price Changed $140,000 MiRealSource-MiMLS
- 2026-02-03 Price Changed $140,000 REALCOMP
- 2026-02-03 Price Changed $140,000 SW Michigan MLS
- 2025-10-24 Listed $150,000 REALCOMP
- 2025-10-24 Listed $150,000 MiRealSource-MiMLS
Property tax history
-0.3%/yrLatest (2024): $380 · -16.3% YoY. Source: county tax records.
Cash-flow waterfall
monthlySold comps — $/sqft
last 12 mo · ≤1 miLoading sold comps…