 Duplex
2740 Jones Ave · Nashville-Davidson metropolitan government (balance), TN
Flood risk 1/10 · Minimal
- FEMA flood zone
- X (unshaded)
- Chance of flooding over 30 yrs
- 0.0%
- Est. flood insurance / yr
- $507 – $1,088
Fire risk 1/10 · Minimal
- Est. fire insurance / yr
- $949 – $1,763
Heat risk 5/10 · Moderate
- Hot days now (above 106°F)
- 7 days/yr
- Hot days in 30 yrs
- 18 days/yr
Wind risk 4/10 · Minor
- Chance of severe wind over 30 yrs
- 9.0%
Air-quality risk 2/10 · Minimal
- Unhealthy air days now
- 1 days/yr
- Unhealthy air days in 30 yrs
- 2 days/yr
Risk factors via First Street. Map © Google.
Why this score? — see what drove the D- grade
The composite is a weighted blend of 9 inputs, each scored 0–100. Each bar is that input's sub-score; the figure is the points it added to the 100-point composite (weight × sub-score).
- Cash flow +13.5/30.0
- ARV discount +7.5/15.0
- DSCR +4.1/10.0
- 1% rule +3.8/10.0
- Rent growth +2.8/5.0
- Condition / age +2.8/5.0
- Livability +2.5/5.0
- Schools +1.4/10.0
- Appreciation +0.0/10.0
$385,000
🖨 Deal sheet 📄 Offer letter ✓ Due diligence
Multi-family units
County records classify this as Multi-Family (2-4 Unit). Listing-text estimate: 2 units. confirmed
Listing remarks
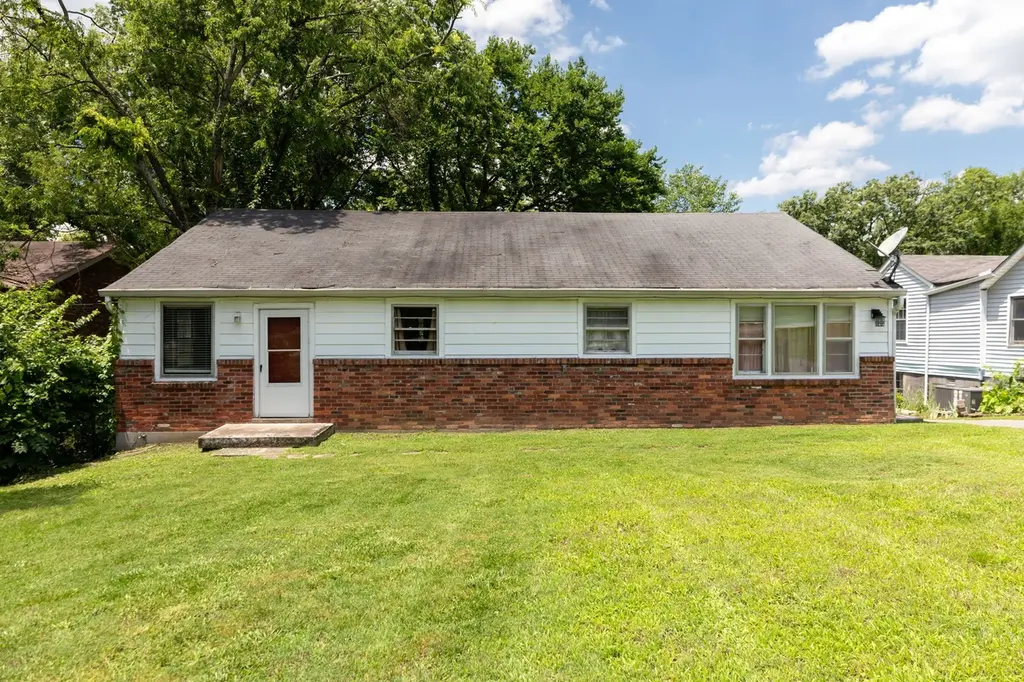
Rare duplex opportunity on a spacious 0.75-acre lot. Each unit offers 2 bedrooms and 1 bathroom, creating an attractive option for investors seeking rental income, value-add potential, or future redevelopment opportunities. The property has been maintained over the years and offers flexibility for a variety of investment strategies. With its large lot, convenient location, and multiple avenues for future growth, this property presents a unique opportunity in today's market. * * * Do not disturb tenant in unit B (the right side) * * *
Key facts
- Value-add potential
- Spacious lot
- Convenient location
Tags
Property features AI
Finance
- Other: Zoned C12 - Dupl
- Financial info: Owner pays: Other; Tenants pay cable TV, electricity, gas, and water
Exterior
- Parking: No covered parking reported; No parking spaces reported
- Utilities: Public water; Public sewer; Water available
- Home design: Duplex residential income property; Attached property; One level
- Construction: Aluminum siding and brick exterior; Shingle roof; Existing structure
- Exterior features: 60 x 445 lot dimensions; Public water available; Public sewer
Interior
- Bedrooms: Two 2-bedroom units
- Flooring: Wood flooring; Vinyl flooring
- Bathrooms: Each unit has 1 bathroom
- Heating & cooling: Central heating; Central air
- Interior features: Wood and vinyl flooring; Central heating; Central air conditioning
- Laundry & utility: Washer hookup; Electric dryer hookup
Neighborhood map
What this means for you Summary
Snapshot
- This is a 2 × 2-bed/1.0-bath units multifamily listed at $385k. Condition is rated average.
Deal economics
- At list price, monthly cash flow is $14 ($171/yr) — positive. Per door: $7/mo.
- The deal already cash-flows at list — no discount required.
- To meet the 1% rule (rent ≥ 1% of price), the offer needs to be $339k (12.1% below list).
- Recommended offer: $339k (12.1% below list) — sets the bar for 1% rule.
- Cap rate 6.3% vs local median 2.9% in Nashville-Davidson metropolitan government (balance) — top-decile yield for the area; either an underpriced asset or a hidden risk that comps aren't pricing in. Stress-test before assuming the spread holds.
Location & tenants
- Location reads: area grade D — affects rentability + tenant quality, not the cash-flow math above.
- Davidson County (urban): math 12% / reading 19% proficiency, ranked #126 of 139 in TN (top 91%) — low school quality limits family demand, transient renter base, plan for 1-2y turnover; 66% free/reduced lunch — lower-income household profile, screen leases tightly.
- Zoned schools: Tom Joy Elementary (math 2% / reading 2%, grade F, #926 of 952 statewide, top 100%, 456 students, 0% FRL); Maplewood High (math 2% / reading 12%, grade F, #294 of 332 statewide, top 91%, 691 students, 0% FRL) — zoned schools average 0% FRL vs 66% district-wide (66 pts lower); this property's tenant base skews higher-income than the district average.
- Market conditions: Rents rising (+1.3%/yr); 535 active listings in the ZIP; 40 comparable units currently listed for rent nearby; rentals at typical pace (median 18d on market — plan ~3-4 weeks tenant-placement turnaround); 6,873 units permitted in Davidson County in 2024 (4,138 in 5+ unit buildings).
- At $3,386/mo this rent would consume 66% of the median local household income ($62k/yr) (locally 1969% of renters already pay >50% of income on rent) — very limited rent-growth headroom before tenants either downsize or default.
Forward outlook
- Local home prices are declining (-3.0%/yr); year-one equity from $3k of loan paydown is wiped out by about $12k of value loss. Plan a longer hold.
- Davidson County population projected at +42% by 2050 — long-run rental-demand tailwind backs the buy-and-hold thesis.
Negotiation context
- Only 9 days on market — expect competitive offers; lowballing is unlikely to land.
Risks & watch-outs
- Climate carrying-cost: extreme-heat days projected 7→18/yr by 2055 (HVAC capex compounding) — expect insurance premiums to compound above CPI over the hold.
Questions for the listing agent
- Can we see the unit-by-unit rent roll, current vacancy, and any below-market leases? What's the average tenancy length?
- What capital expenditures (roof, boiler, parking lot, exteriors) have been made in the last 5 years, and what's planned in the next 2?
- Built in 1960 — when were the roof, HVAC, electrical panel, plumbing, and water heater last replaced?
- Is there a deadline driving the sale (1031 exchange, divorce, estate, relocation)? That informs how much negotiation room exists.
- The area grade is low — what's the realistic commute time and amenity access for the typical tenant pool here? Any planned neighborhood developments (good or bad) we should know about?
- What's the average days-on-market for RENTAL listings here right now (not sales)? A rising rental-DOM trend means longer vacancies and softer asking-rent achievability than the comps imply.
- What's the recent tenant-quality profile in this submarket — average credit score on applications, eviction rate, late-payment / NSF rate, and stable-employment percentage? A property-management company in the area should have these aggregated.
- How much new apartment / multifamily construction is in the pipeline within 1–3 miles? Heavy new supply (>2% of stock underway) typically softens rents 12–24 months out; light construction supports rent growth.
Investment metrics
- 1% rule
- 0.88% ✗
- Cap rate
- 6.34%
- Cash-on-cash
- 0.16%
- DSCR
- 1.01
- GRM
- 9.5
CMA / ARV
No comps found within radius.
Projected returns pro-forma
-3.0% appreciation · 1.33% rent growth · sell at horizon
- IRR
- -17.9%
- Equity multiple
- 0.38×
- Total profit
- $-67,022
- Equity at exit
- $57,405
- IRR
- -13.7%
- Equity multiple
- 0.27×
- Total profit
- $-79,189
- Equity at exit
- $33,288
Cash invested: $107,800 (down + closing). Projections, not guarantees.
Landlord ↔ Tenant lean methodology
- Overall (STATE)
- 87 Strongly Landlord-Friendly
- State Tennessee
- 87 Strongly Landlord-Friendly · R+13
- County
- — inherits STATE
- City
- — inherits STATE
ZIP-level market 37207
- Home prices YoY
- -27.8%
- Rents YoY
- 1.3%
- Active inventory
- 535
- Price-to-rent
- 19.0×
Monthly cashflow live
- Estimated rent
- $3,386 high interval (Pro) →
- Mortgage (P&I)
- −$2,019
- Tax est. 1.5%
- −$481 /mo · $5,775/yr
- Insurance
- −$160
- HOA
- −$0
- Vacancy / Maint / Mgmt
- −$711
- Net cashflow
- $14
Break-even live
2-unit breakdown (identical units grouped — click to expand)
| Units | Beds | Baths | Est. rent |
|---|---|---|---|
| 2× units | 2 | 1 | $3,386 |
| #1 | 2 | 1 | $1,693 |
| #2 | 2 | 1 | $1,693 |
| Total (2 units) | $3,386 | ||
UW: 25.0% down · 7.5% · 30yr · 1.5% tax · 5.0% vac · 8.0% maint · 8.0% mgmt
Financing live
Cash to close
- Down payment
- $96,250
- Closing costs
- $11,550
- Reserves months
- —
- Total cash needed
- —
Loan-product check · same deal, 3 products live
Conventional
25% down · 7.5% · 30yr
- Down + closing
- —
- Monthly P&I
- —
- Monthly cashflow
- —
- DSCR
- —
- Eligible?
- —
Personal DTI + credit; lowest rate.
DSCR
20% down · 8.5% · 30yr
- Down + closing
- —
- Monthly P&I
- —
- Monthly cashflow
- —
- DSCR
- —
- Eligible?
- —
No personal income docs; deal must DSCR.
Hard money
10% down · 12.0% · 12mo
- Down + closing
- —
- Monthly P&I
- —
- Monthly cashflow
- —
- DSCR
- —
- Eligible?
- —
Short-term bridge; refi at stabilization.
Rent comps 40 comps
| Address | Beds | Baths | Sqft | Rent | $/sqft | DOM | Units | Dist |
|---|---|---|---|---|---|---|---|---|
| 2718 Oakwood Ave Nashville, TN | 4.0 | 2.0 | 1850 | $2,595 | $1.40 | 24d | 1 | 0.17mi |
| 105 Hart Ln Unit D Nashville, TN | 3.0 | 3.5 | 2135 | $2,750 | $1.29 | 24d | 1 | 0.40mi |
| 105 Hart Ln Unit B Nashville, TN | 3.0 | 3.5 | 1825 | $2,600 | $1.42 | 4d | 1 | 0.40mi |
| 128 Gordon Ter Nashville, TN | 3.0 | 2.0 | 1400 | $2,600 | $1.86 | 11d | 1 | 0.51mi |
| 206 Ben Allen Rd #4 Nashville, TN | 3.0 | 3.5 | 1947 | $3,000 | $1.54 | 4d | 1 | 0.53mi |
| 206 Ben Allen Rd #5 Nashville, TN | 3.0 | 3.5 | 2015 | $3,400 | $1.69 | 24d | 1 | 0.53mi |
| 1100 Sunset Cir Nashville, TN | 1.0–3.0 | 1.0–2.5 | 1070 | $1,899 | $1.77 | 3d | 7 | 0.70mi |
| 538 Norton Ave Nashville, TN | 3.0 | 2.0 | 1394 | $2,000 | $1.43 | 19d | 1 | 0.72mi |
| 301 Ben Allen Rd Nashville, TN | 1.0–3.0 | 1.0–2.0 | 1019 | $1,681 | $1.65 | 2d | 11 | 0.74mi |
| 229 Duke St Nashville, TN | 3.0 | 3.0 | 1751 | $3,150 | $1.80 | 24d | 1 | 0.77mi |
| 105 Duke St #9 Nashville, TN | 3.0 | 2.5 | 1631 | $3,300 | $2.02 | 24d | 1 | 0.86mi |
| 614 Poplar Pl Nashville, TN | 3.0 | 2.0 | 1244 | $2,200 | $1.77 | 2d | 1 | 0.87mi |
| 3108 Hillside Rd Unit 1 Nashville, TN | 3.0 | 2.0 | 1194 | $1,400 | $1.17 | 20d | 1 | 0.94mi |
| 504 Edwin St #18 Nashville, TN | 4.0 | 3.5 | 2002 | $3,495 | $1.75 | 24d | 1 | 0.94mi |
| 504 Edwin St #18 Nashville, TN | 4.0 | 3.5 | 2002 | $3,495 | $1.75 | 3d | 1 | 0.94mi |
| 618 Cogdill Ln Nashville, TN | 2.0–3.0 | 2.5–3.5 | 1857 | $4,325 | $2.33 | 3d | 8 | 0.98mi |
| 3060 Edwin Cir Nashville, TN | 3.0 | 3.0 | 2070 | $2,995 | $1.45 | 4d | 1 | 0.98mi |
| 3060 Edwin Cir Nashville, TN | 3.0 | 3.0 | 2070 | $3,200 | $1.55 | 17d | 1 | 0.98mi |
| 488 Lemont Dr Nashville, TN | 1.0–3.0 | 1.0–1.5 | 951 | $2,065 | $2.17 | 2d | 47 | 1.01mi |
| 2019 Maple View Ln Nashville, TN | 3.0 | 3.5 | 1775 | $2,850 | $1.61 | 4d | 1 | 1.01mi |
| 1806 Lischey Ave #3 Nashville, TN | 3.0 | 3.0 | 1800 | $2,895 | $1.61 | 24d | 1 | 1.02mi |
| 1806 Lischey Ave #1 Nashville, TN | 3.0 | 3.0 | 1800 | $4,800 | $2.67 | 24d | 1 | 1.02mi |
| 901 Cherokee Ave Nashville, TN | 3.0 | 1.0–2.0 | 1457 | $3,563 | $2.45 | 2d | 12 | 1.10mi |
| 2810 Gear St Nashville, TN | 3.0 | 5.5 | 2200 | $3,250 | $1.48 | 17d | 1 | 1.12mi |
| 928 Thomas Ave Nashville, TN | 3.0 | 2.5 | 2157 | $4,500 | $2.09 | 21d | 1 | 1.16mi |
| 1020 W Kirkland Ave Unit D Nashville, TN | 4.0 | 3.0 | 1998 | $3,250 | $1.63 | 24d | 1 | 1.18mi |
| 927 Chickasaw Ave Nashville, TN | 3.0 | 2.0 | 1223 | $2,600 | $2.13 | 17d | 1 | 1.19mi |
| 808 Vibe Pl Unit 1492998P Nashville, TN | 3.0 | 3.0 | 1517 | $4,544 | $3.00 | 2d | 1 | 1.20mi |
| 917B Spain Ave Nashville, TN | 3.0 | 3.0 | 1428 | $2,450 | $1.72 | 4d | 1 | 1.20mi |
| 921 Spain Ave Nashville, TN | 4.0 | 3.0 | 1850 | $3,250 | $1.76 | 14d | 1 | 1.21mi |
| 915 Delmas Ave Unit B Nashville, TN | 3.0 | 2.5 | 1888 | $3,023 | $1.60 | 8d | 1 | 1.23mi |
| 1008B Dozier Pl Nashville, TN | 3.0 | 2.5 | 1888 | $2,795 | $1.48 | 24d | 1 | 1.24mi |
| 1008 Dozier Pl Nashville, TN | 3.0 | 2.5 | 1888 | $2,795 | $1.48 | 24d | 1 | 1.24mi |
| 1078 Zophi St Unit A Nashville, TN | 3.0 | 2.5 | 1890 | $3,200 | $1.69 | 24d | 1 | 1.27mi |
| 330 E Village Ln Nashville, TN | 3.0 | 3.5 | 1734 | $2,999 | $1.73 | 24d | 1 | 1.28mi |
| 939 Spain Ave Nashville, TN | 3.0 | 3.0 | 2178 | $4,200 | $1.93 | 4d | 1 | 1.29mi |
| 303 Gatewood Ave Nashville, TN | 3.0 | 2.0 | 2160 | $2,999 | $1.39 | 24d | 1 | 1.31mi |
| 1003B Spain Ave Nashville, TN | 3.0 | 3.0 | 1801 | $2,723 | $1.51 | 24d | 1 | 1.31mi |
| 300-B E Village Ln Nashville, TN | 3.0 | 3.5 | 1735 | $2,900 | $1.67 | 24d | 1 | 1.39mi |
| 1114 McGavock Pike Unit A Nashville, TN | 3.0 | 2.5 | 1844 | $2,730 | $1.48 | 2d | 1 | 1.40mi |
Listing history 8 events
-
2026-06-18days on market $385,000 Active 9 DOM
-
2026-06-17days on market $385,000 Active 8 DOM
-
2026-06-16days on market $385,000 Active 7 DOM
-
2026-06-15days on market $385,000 Active 6 DOM
-
2026-06-13days on market $385,000 Active 4 DOM
-
2026-06-13days on market $385,000 Active 3 DOM
-
2026-06-10remarks 543-char remark
-
2026-06-10$385,000 Active 1 DOM
ⓘ Source: listings_history table (triggers on properties + properties_extension) + one-shot
backfill from property_details.listing_events for pre-trigger history.
Climate risk First Street
- Flood 1/10 Low FEMA zone X (unshaded) · 0% chance over 30 yrs
- Wildfire 1/10 Low
- Heat 5/10 Major 7 d/yr ≥106°F today · 18 d/yr by 30 yrs out
- Wind 4/10 Moderate 9% chance of damaging wind over 30 yrs
- Air quality 2/10 Low 1 unhealthy d/yr today · 2 by 30 yrs out
Nearby sold comps map
Loading sold comps map…
Walkable amenities ~0.75 mi
Loading nearby amenities…
Taxation est. · year 1
- Rental income
- $40,632
- − Mortgage interest
- −$21,566
- − Property taxes
- −$5,775
- − Insurance
- −$1,925
- − Repairs & maintenance
- −$3,251
- − Management
- −$3,251
- − Depreciation
- −$11,200
- Taxable loss
- −$6,335
- Est. tax savings @ 24.0%
- +$1,520
- After-tax cash flow
- $1,692/yr
For passive investors: Depreciation is non-cash, so a rental often shows a tax loss while cash-flowing — sheltering income. Rental losses are passive: they offset passive income freely, and up to $25,000/yr can offset ordinary (W-2) income if you actively participate and your MAGI is under $100k (phasing out to $0 by $150k); unused losses carry forward. On sale, claimed depreciation is recaptured at up to 25%, and gains may owe capital-gains tax (a 1031 exchange can defer both). Figures are a year-1 estimate at your 24.0% rate — not tax advice; consult a CPA.
Condition & rehab AI · 13 photos
The home is in average condition with some minor repairs and maintenance needed. Painting the exterior and interior and landscaping can significantly increase its resale and rental value.
Repairs flagged
- Minor Paint — The paint appears to be in good condition with no visible damage or wear.
- Minor Landscaping — The landscaping appears to be in good condition with no visible damage or wear.
Value-add opportunities
- Both Paint the exterior and interior — Painting the exterior and interior can improve the home's curb appeal and overall appearance, making it more attractive to potential buyers or renters.
- Both Landscaping — Landscaping can improve the home's curb appeal and overall appearance, making it more attractive to potential buyers or renters.
Renovation cost estimate screening
| Repair item | Severity | Est. cost |
|---|---|---|
| Paint · The paint appears to be in good condition with no visible damage or wear. | Minor | $500–3,000 |
| Landscaping · The landscaping appears to be in good condition with no visible damage or wear. | Minor | $500–3,000 |
| Total estimated repair cost · 2 items | $1,000–6,000 |
Value-add ROI direction
- Both Paint the exterior and interior — Painting the exterior and interior can improve the home's curb appeal and overall appearance, making it more attractive to potential buyers or renters. ↑
- Both Landscaping — Landscaping can improve the home's curb appeal and overall appearance, making it more attractive to potential buyers or renters. ↑
ⓘ Cost ranges are severity-bucket heuristics (US national rule-of-thumb). Get contractor quotes + a written scope before underwriting a rehab budget.
Schools (NCES district)
- District
- Davidson County
- NCES district ID
- 4703180
- Math proficiency
- 12% ▼ -17.00%
- Reading proficiency
- 19% ▼ -7.00%
- Median HH income
- $48,667
- Composite
- 14.03/100
- National rank
- #9472
- State rank
- #126 of 139 in TN
Livability — Nashville-Davidson metropolitan government (balance)
No livability data for this city. (Only ~50 U.S. cities are tracked.)
Census & demographics
- Census place
- Nashville-Davidson metropolitan government (balance), TN
- County
- Davidson County · 680,067 people
- City population
- 677,595
- Metro
- Nashville-Davidson--Murfreesboro--Franklin, TN
- Population (ZIP)
- 41,366
- Household income
- $61,744
- Rent vs Own
- Severe rent burden
- 1969.0
Population outlook (Davidson County) Hauer SSP2
- Today (2025)
- 808,568 people
- By 2030
- 874,489 · +8.2%
- By 2040
- 1,009,046 · +24.8%
- By 2050
- 1,147,294 · +41.9%
- By 2075
- 1,475,439 · +82.5%
- By 2100
- 1,714,101 · +112.0%
Race, ethnicity, and origin ACS 2023
- Neighborhood character
- Diverse neighborhood (Simpson 0.60)
- Race & ethnicity
- Black 57% White 24% Hispanic / Latino 13% Two or more races 8%
- Hispanic origin (detail)
- Mexican 6%
- Common ancestry
- Slovak 2% Serbian 1% Romanian 1%
- Foreign-born
- 10% · Canada, Jamaica
- Languages at home
- 88% English-only · Spanish 10%
Political lean MEDSL · Davidson
- 2024 margin
- Strong D (+27.4) · D 62.7% · R 35.3% · Other 2.0%
- 2008→2024 swing
- +6.5pp toward D · 2008: 21.0pp · 2024: 27.4pp
- All cycles
- 2024: D+27.4 2020: D+32.1 2016: D+26.0 2012: D+18.7 2008: D+21.0
Not yet ingested
- Civics
- —
Market trends
- HPI YoY
- ▼ -135.21%
- Current HPI
- 351.9628
- Rent YoY
- ▲ 1.33%
- Metro
- Nashville-Davidson--Murfreesboro--Franklin, TN
- State GDP YoY
- ▲ 2.78%
- F500 in state
- 22
Industry mix (Fortune 500 HQ in TN)
| Industry | F500 HQs | Revenue |
|---|---|---|
| Healthcare | 3 | $91B |
|
||
| Retail | 3 | $72B |
|
||
| Transportation / Logistics | 1 | $88B |
|
||
| Paper / Packaging | 1 | $19B |
|
||
| Insurance | 1 | $13B |
|
||
| Energy | 1 | $12B |
|
||
Price history
1 event — show timeline
- 2026-06-09 Listed $385,000 REALTRACS as Distributed by MLS Grid
Cash-flow waterfall
monthlySold comps — $/sqft
last 12 mo · ≤1 miLoading sold comps…