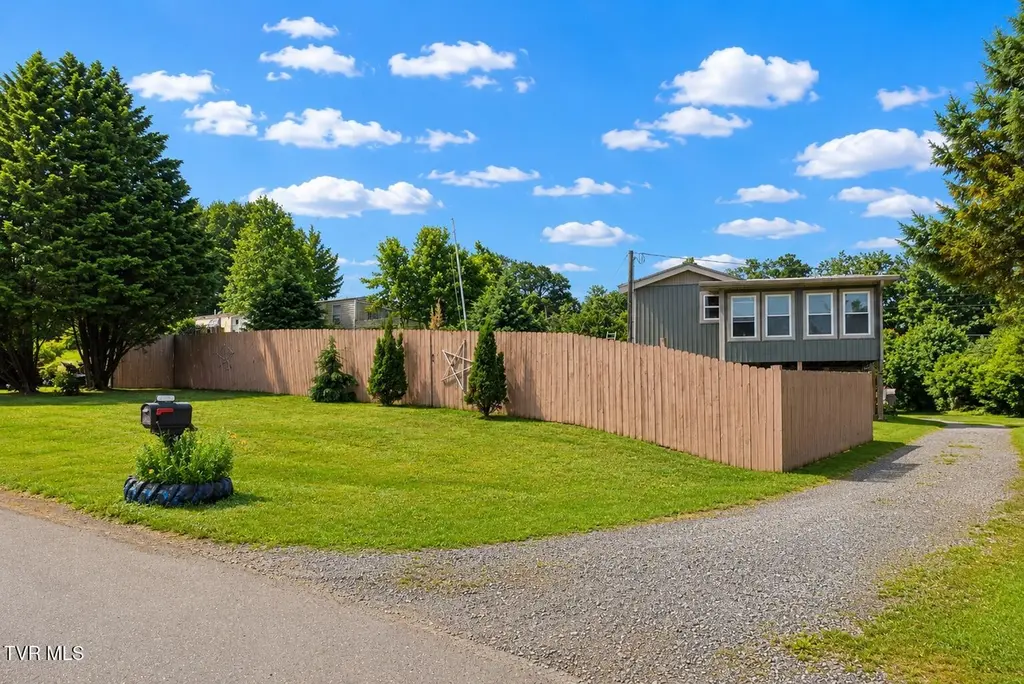
225 Shaw Rd · Tusculum, TN
Flood risk 1/10 · Minimal
- FEMA flood zone
- X (unshaded)
- Chance of flooding over 30 yrs
- 0.0%
- Est. flood insurance / yr
- $473 – $860
Fire risk 3/10 · Minor
- Est. fire insurance / yr
- $949 – $1,763
Heat risk 5/10 · Moderate
- Hot days now (above 100°F)
- 7 days/yr
- Hot days in 30 yrs
- 22 days/yr
Wind risk 2/10 · Minimal
- Chance of severe wind over 30 yrs
- —
Air-quality risk 2/10 · Minimal
- Unhealthy air days now
- 1 days/yr
- Unhealthy air days in 30 yrs
- 2 days/yr
Risk factors via First Street. Map © Google.
Why this score? — see what drove the D- grade
The composite is a weighted blend of 9 inputs, each scored 0–100. Each bar is that input's sub-score; the figure is the points it added to the 100-point composite (weight × sub-score).
- Cash flow +8.7/30.0
- ARV discount +7.5/15.0
- Appreciation +7.1/10.0
- Livability +3.3/5.0
- 1% rule +2.7/10.0
- Rent growth +2.5/5.0
- Condition / age +2.5/5.0
- DSCR +2.4/10.0
- Schools +2.1/10.0
$169,000
🖨 Deal sheet 📄 Offer letter ✓ Due diligence
Listing remarks MLS
Property is off the beaten path, lots of space. Doublewide. Has countryside views. Investment.
Key facts
- Remodeled retreat
- New cabinets
- New countertops
Tags
Property features AI
Finance
- Other: TV antenna
Exterior
- Parking: Driveway with gravel surface
- Security: Security gate; Smoke detector(s)
- Utilities: Public water; Public sewer; Electricity connected; Water connected; Sewer connected
- Home design: Manufactured house (single wide); One level; Updated/remodeled
- Construction: Vinyl siding; Metal roof; Other foundation (see remarks); Built as a manufactured structure
- Exterior features: Garden; Enclosed porch; Front porch; Rear porch; Storm door(s); Full fencing; Poultry coop; Storage; Workshop; Has a view
Interior
- Kitchen: Microwave; Range; Refrigerator; Pantry
- Flooring: Laminate
- Bathrooms: 2 full bathrooms
- Heating & cooling: Central heating; Heat pump; Central air
- Interior features: Open floorplan; Pantry; Double-pane windows; Has basement (dirt floor)
- Laundry & utility: Washer hookup; Electric dryer hookup; Washer; Dryer
Neighborhood map
What this means for you Summary
Snapshot
- This is a 3-bed/2.0-bath manufactured listed at $169k.
Deal economics
- At list price, monthly cash flow is $-141 ($-2k/yr) — negative.
- To cash-flow at today's rent, offer at most $149k (12.1% below list).
- To meet the 1% rule (rent ≥ 1% of price), the offer needs to be $130k (23.1% below list).
- Recommended offer: $130k (23.1% below list) — sets the bar for 1% rule.
- Cap rate 5.3% vs local median 2.1% in Tusculum — top-decile yield for the area; either an underpriced asset or a hidden risk that comps aren't pricing in. Stress-test before assuming the spread holds.
Location & tenants
- Location reads 66/100 on livability (#113 in TN) — a middle-class / working-renter tenant base. Strengths: crime A+, cost of living A+, housing A+; Watch: amenities F, commute F, health & safety F.
- Greene County (rural): math 27% / reading 24% proficiency, ranked #83 of 139 in TN (top 60%) — low school quality limits family demand, transient renter base, plan for 1-2y turnover.
- Zoned schools: Chuckey Elementary (math 32% / reading 27%, grade F, #423 of 952 statewide, top 48%, 354 students, 0% FRL); Chuckey Doak Middle School (math 41% / reading 25%, grade F, #77 of 333 statewide, top 24%, 388 students, 0% FRL); Chuckey Doak High School (math 22% / reading 42%, grade F, #56 of 332 statewide, top 20%, 592 students, 0% FRL) — zoned schools average 0% FRL vs 58% district-wide (58 pts lower); this property's tenant base skews higher-income than the district average.
- Market conditions: 59 active listings in the ZIP; 1 comparable units currently listed for rent nearby; 333 units permitted in Greene County in 2024 (72 in 5+ unit buildings).
Forward outlook
- In year one you build about $8k of equity ($1k loan paydown + $7k appreciation (4.3% local appreciation)).
- Greene County population projected to shrink 8% by 2050 — rents likely to lag national; underwrite the cash flow, not the appreciation.
- By year 5, paydown + projected appreciation supports a ~$36k cash-out refi (75% LTV) — recoverable capital for the next deal without selling this one.
Negotiation context
- It's been on market 42 days — a 3% lower offer ($164k) is reasonable based on typical stale-listing flexibility.
- 3 sale attempts since 7y ago with the ask held roughly flat each time — persistent listings suggest the price (not the market) is what's stuck; bring a comps-based counter.
- Current owner paid $14k; list at $169k implies a 1107% gain — meaningful room to come down on a strong offer.
Risks & watch-outs
- Climate carrying-cost: extreme-heat days projected 7→22/yr by 2055 (HVAC capex compounding) — expect insurance premiums to compound above CPI over the hold.
Questions for the listing agent
- What do current leases actually rent for vs. the listed asking? Can we see a recent rent roll and the last 12 months of T-12 income?
- It's been on market 42 days. Have you received any prior offers? Is the seller open to a 23% concession, seller financing, or rate buy-down credit?
- Is there a deadline driving the sale (1031 exchange, divorce, estate, relocation)? That informs how much negotiation room exists.
- Schools are F-rated, which usually means shorter tenancies and higher turnover. Who's the typical renter profile here, and what's been the actual vacancy rate?
- The area grade is low — what's the realistic commute time and amenity access for the typical tenant pool here? Any planned neighborhood developments (good or bad) we should know about?
- What's the average days-on-market for RENTAL listings here right now (not sales)? A rising rental-DOM trend means longer vacancies and softer asking-rent achievability than the comps imply.
- What's the recent tenant-quality profile in this submarket — average credit score on applications, eviction rate, late-payment / NSF rate, and stable-employment percentage? A property-management company in the area should have these aggregated.
- How much new for-sale + rental construction is in the pipeline within 1–3 miles? Heavy new supply typically softens prices + rents 12–24 months out; constrained supply supports both.
Investment metrics
- 1% rule
- 0.77% ✗
- Cap rate
- 5.29%
- Cash-on-cash
- -3.57%
- DSCR
- 0.84
- GRM
- 10.8
CMA / ARV
No comps found within radius.
Projected returns pro-forma
4.29% appreciation · 3.0% rent growth · sell at horizon
- IRR
- 7.9%
- Equity multiple
- 1.49×
- Total profit
- $23,232
- Equity at exit
- $88,574
- IRR
- 10.0%
- Equity multiple
- 2.72×
- Total profit
- $81,531
- Equity at exit
- $147,222
Cash invested: $47,320 (down + closing). Projections, not guarantees.
Landlord ↔ Tenant lean methodology
- Overall (STATE)
- 87 Strongly Landlord-Friendly
- State Tennessee
- 87 Strongly Landlord-Friendly · R+13
- County
- — inherits STATE
- City
- — inherits STATE
ZIP-level market 37641
- Home prices YoY
- 1.4%
- Active inventory
- 59
- Price-to-rent
- 10.8×
Monthly cashflow live
- Estimated rent
- $1,300 medium interval (Pro) →
- Mortgage (P&I)
- −$886
- Tax est. 1.5%
- −$211 /mo · $2,535/yr
- Insurance
- −$70
- HOA
- −$0
- Vacancy / Maint / Mgmt
- −$273
- Net cashflow
- $-141
Break-even live
UW: 25.0% down · 7.5% · 30yr · 1.5% tax · 5.0% vac · 8.0% maint · 8.0% mgmt
Financing live
Cash to close
- Down payment
- $42,250
- Closing costs
- $5,070
- Reserves months
- —
- Total cash needed
- —
Loan-product check · same deal, 3 products live
Conventional
25% down · 7.5% · 30yr
- Down + closing
- —
- Monthly P&I
- —
- Monthly cashflow
- —
- DSCR
- —
- Eligible?
- —
Personal DTI + credit; lowest rate.
DSCR
20% down · 8.5% · 30yr
- Down + closing
- —
- Monthly P&I
- —
- Monthly cashflow
- —
- DSCR
- —
- Eligible?
- —
No personal income docs; deal must DSCR.
Hard money
10% down · 12.0% · 12mo
- Down + closing
- —
- Monthly P&I
- —
- Monthly cashflow
- —
- DSCR
- —
- Eligible?
- —
Short-term bridge; refi at stabilization.
Rent comps 1 comps
| Address | Beds | Baths | Sqft | Rent | $/sqft | DOM | Units | Dist |
|---|---|---|---|---|---|---|---|---|
| 148 Williamson Rd Chuckey, TN | 3.0 | 2.0 | 924 | $1,300 | $1.41 | 21d | 1 | 0.42mi |
Listing history 22 events
-
2026-06-19days on market $169,000 Active 42 DOM
-
2026-06-18days on market $169,000 Active 41 DOM
-
2026-06-17days on market $169,000 Active 40 DOM
-
2026-06-16days on market $169,000 Active 39 DOM
-
2026-06-15days on market $169,000 Active 38 DOM
-
2026-06-14days on market $169,000 Active 36 DOM
-
2026-06-12days on market $169,000 Active 35 DOM
-
2026-06-09days on market $169,000 Active 32 DOM
-
2026-06-08days on market $169,000 Active 31 DOM
-
2026-06-07days on market $169,000 Active 30 DOM
-
2026-06-05days on market $169,000 Active 27 DOM
-
2026-06-02days on market $169,000 Active 25 DOM
-
2026-06-01days on market $169,000 Active 24 DOM
-
2026-05-31days on market $169,000 Active 23 DOM
-
2026-05-30days on market $169,000 Active 22 DOM
-
2026-05-07$170,000 Active
-
2026-04-02price $177,400
-
2020-04-20soldstatus $14,000 94-char remark
Show marketing remark (94 chars)
Property is off the beaten path, lots of space. Doublewide. Has countryside views. Investment.
-
2019-11-09$12,900 94-char remark
Show marketing remark (94 chars)
Property is off the beaten path, lots of space. Doublewide. Has countryside views. Investment.
-
2019-09-30soldstatus $13,500
-
2019-08-22$28,000
-
2001-08-27soldstatus $15,000
ⓘ Source: listings_history table (triggers on properties + properties_extension) + one-shot
backfill from property_details.listing_events for pre-trigger history.
Climate risk First Street
- Flood 1/10 Low FEMA zone X (unshaded) · 0% chance over 30 yrs
- Wildfire 3/10 Moderate
- Heat 5/10 Major 7 d/yr ≥100°F today · 22 d/yr by 30 yrs out
- Wind 2/10 Low
- Air quality 2/10 Low 1 unhealthy d/yr today · 2 by 30 yrs out
Nearby sold comps map
Loading sold comps map…
Walkable amenities ~0.75 mi
Loading nearby amenities…
Taxation est. · year 1
- Rental income
- $15,600
- − Mortgage interest
- −$9,467
- − Property taxes
- −$2,535
- − Insurance
- −$845
- − Repairs & maintenance
- −$1,248
- − Management
- −$1,248
- − Depreciation
- −$4,916
- Taxable loss
- −$4,659
- Est. tax savings @ 24.0%
- +$1,118
- After-tax cash flow
- $-573/yr
For passive investors: Depreciation is non-cash, so a rental often shows a tax loss while cash-flowing — sheltering income. Rental losses are passive: they offset passive income freely, and up to $25,000/yr can offset ordinary (W-2) income if you actively participate and your MAGI is under $100k (phasing out to $0 by $150k); unused losses carry forward. On sale, claimed depreciation is recaptured at up to 25%, and gains may owe capital-gains tax (a 1031 exchange can defer both). Figures are a year-1 estimate at your 24.0% rate — not tax advice; consult a CPA.
Schools (NCES district)
- District
- Greene County
- NCES district ID
- 4701470
- Math proficiency
- 27% ▼ -14.00%
- Reading proficiency
- 24% ▼ -7.00%
- Median HH income
- $37,517
- Composite
- 21.3/100
- National rank
- #8388
- State rank
- #83 of 139 in TN
Livability — Tusculum
- Score
- 66/100
- State rank
- #113
- US rank
- #11305
Category grades
Schools grade is shown separately in the Schools card above.
Census & demographics
- Population (ZIP)
- 9,110
Population outlook (Greene County) Hauer SSP2
- Today (2025)
- 68,624 people
- By 2030
- 68,114 · -0.7%
- By 2040
- 66,167 · -3.6%
- By 2050
- 63,038 · -8.1%
- By 2075
- 55,274 · -19.5%
- By 2100
- 45,527 · -33.7%
Race, ethnicity, and origin ACS 2023
- Neighborhood character
- Predominantly White (98%)
- Race & ethnicity
- White 98% Two or more races 1%
- Common ancestry
- Serbian 2% Slovak 2% Lithuanian 1%
- Foreign-born
- 1%
Political lean MEDSL · Greene
- 2024 margin
- Solid R (+65.7) · D 16.6% · R 82.3% · Other 1.2%
- 2008→2024 swing
- -25.0pp toward R · 2008: -40.7pp · 2024: -65.7pp
- All cycles
- 2024: R+65.7 2020: R+60.7 2016: R+61.0 2012: R+46.0 2008: R+40.7
Not yet ingested
- Civics
- —
Market trends
- HPI YoY
- ▲ 4.29%
- Current HPI
- 321.5562
- Rent YoY
- —
- Metro
- —
- State GDP YoY
- ▲ 2.78%
- F500 in state
- 22
Industry mix (Fortune 500 HQ in TN)
| Industry | F500 HQs | Revenue |
|---|---|---|
| Healthcare | 3 | $91B |
|
||
| Retail | 3 | $72B |
|
||
| Transportation / Logistics | 1 | $88B |
|
||
| Paper / Packaging | 1 | $19B |
|
||
| Insurance | 1 | $13B |
|
||
| Energy | 1 | $12B |
|
||
Price history
+1033.3% since first listed7 events — show timeline
- 2026-05-07 Listed $170,000 TVRMLS
- 2026-04-02 Price Changed $177,400 TVRMLS
- 2020-04-20 Sold (MLS) $14,000 TVRMLS
- 2019-11-09 Listed $12,900 TVRMLS
- 2019-09-30 Sold (MLS) $13,500 TVRMLS
- 2019-08-22 Listed $28,000 TVRMLS
- 2001-08-27 Sold (Public Records) $15,000 Public Records
Property tax history
+1.1%/yrLatest (2025): $151 · +0.0% YoY. Source: county tax records.
Cash-flow waterfall
monthlySold comps — $/sqft
last 12 mo · ≤1 miLoading sold comps…