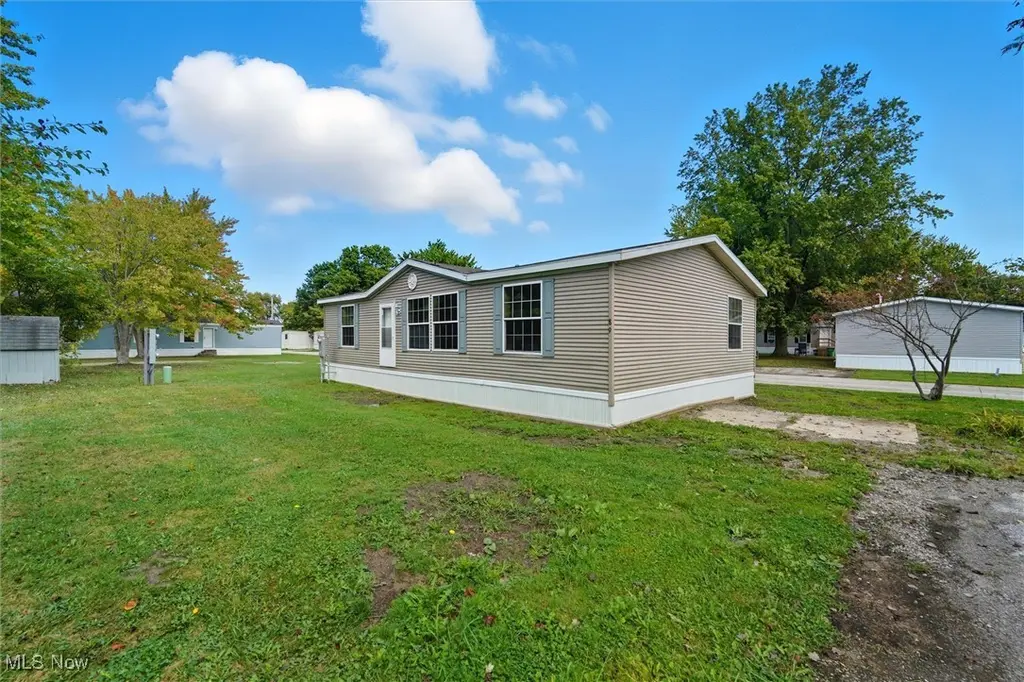
3583 Austin Rd #89 · Geneva, OH
Flood risk 4/10 · Minor
- FEMA flood zone
- X (unshaded)
- Chance of flooding over 30 yrs
- 0.24%
- Est. flood insurance / yr
- $473 – $860
Fire risk 1/10 · Minimal
- Est. fire insurance / yr
- $713 – $1,323
Heat risk 3/10 · Minor
- Hot days now (above 94°F)
- 7 days/yr
- Hot days in 30 yrs
- 18 days/yr
Wind risk 1/10 · Minimal
- Chance of severe wind over 30 yrs
- —
Air-quality risk 3/10 · Minor
- Unhealthy air days now
- 2 days/yr
- Unhealthy air days in 30 yrs
- 5 days/yr
Risk factors via First Street. Map © Google.
Why this score? — see what drove the C+ grade
The composite is a weighted blend of 9 inputs, each scored 0–100. Each bar is that input's sub-score; the figure is the points it added to the 100-point composite (weight × sub-score).
- Cash flow +30.0/30.0
- 1% rule +10.0/10.0
- DSCR +10.0/10.0
- Schools +4.7/10.0
- Condition / age +3.8/5.0
- Livability +3.7/5.0
- Rent growth +2.5/5.0
- ARV discount +0.0/15.0
- Appreciation +0.0/10.0
$65,230
🖨 Deal sheet 📄 Offer letter ✓ Due diligence
Listing remarks MLS
This mobile home has been fully updated throughout the interior, offering a fresh and modern living space at an affordable price. The home features an open living area, updated flooring, and fresh paint. The kitchen has been remodeled with new cabinetry, countertops, and appliances. The bathroom has been updated with new fixtures and finishes. Bedrooms are bright and comfortable with ample natural light. Austin Woods Community has undergone a transformation, come check it out!
Key facts
- Fresh paint
- Remodeled kitchen
- Open living area
Tags
Neighborhood map
What this means for you Summary
Snapshot
- This is a 3-bed/2.0-bath single-family listed at $65k. Condition is rated good.
Deal economics
- At list price, monthly cash flow is $773 ($9k/yr) — positive.
- The deal already cash-flows at list — no discount required.
- Meets the 1% rule at list price ($2k rent vs $65k).
- Recommended offer: $57k (12.0% below list) — sets the bar for market timing.
- Cap rate 20.5% vs local median 4.6% in Geneva — top-decile yield for the area; either an underpriced asset or a hidden risk that comps aren't pricing in. Stress-test before assuming the spread holds.
Location & tenants
- Location reads 74/100 on livability (#291 in OH, #4,770 nationally) — a middle-class / working-renter tenant base. Strengths: cost of living A+, housing A+, health & safety A+; Watch: commute F, employment F.
- Geneva Area City (town): math 52% / reading 60% proficiency, ranked #362 of 656 in OH (top 55%) — acceptable for families but not a draw, mixed tenant base, ~2y average lease.
- Market conditions: 86 active listings in the ZIP; 1 comparable units currently listed for rent nearby; 155 units permitted in Ashtabula County in 2024 (0 in 5+ unit buildings).
- This rent runs 32% of the median local income ($58k/yr) — at the standard rent-burdened threshold; future hikes will face affordability resistance.
Forward outlook
- Local home prices are declining (-3.0%/yr); year-one equity from $450 of loan paydown is wiped out by about $2k of value loss. Plan a longer hold.
- Ashtabula County population projected at -22% by 2050 — secular population decline; favor cash flow + early exit over multi-decade hold.
- At projected returns (-3.0% appreciation + 3.0% rent growth), your $18k cash investment doubles in ~3 years — after that, you're playing with house money.
Negotiation context
- It's been on market 211 days — a 12% lower offer ($57k) is reasonable based on typical stale-listing flexibility.
- 2 sale attempts with the ask held roughly flat each time — persistent listings suggest the price (not the market) is what's stuck; bring a comps-based counter.
Questions for the listing agent
- It's been on market 211 days. Have you received any prior offers? Is the seller open to a 12% concession, seller financing, or rate buy-down credit?
- Why hasn't it sold? Are there any deal-killer items the seller is aware of (foundation, flood, title, zoning, code violations)?
- Is there a deadline driving the sale (1031 exchange, divorce, estate, relocation)? That informs how much negotiation room exists.
- What's the average days-on-market for RENTAL listings here right now (not sales)? A rising rental-DOM trend means longer vacancies and softer asking-rent achievability than the comps imply.
- What's the recent tenant-quality profile in this submarket — average credit score on applications, eviction rate, late-payment / NSF rate, and stable-employment percentage? A property-management company in the area should have these aggregated.
- How much new for-sale + rental construction is in the pipeline within 1–3 miles? Heavy new supply typically softens prices + rents 12–24 months out; constrained supply supports both.
Investment metrics
- 1% rule
- 2.37% ✓
- Cap rate
- 20.51%
- Cash-on-cash
- 50.78%
- DSCR
- 3.26
- GRM
- 3.5
CMA / ARV
- ARV (median comp)
- $52,780
- List price
- $65,230
- Delta
- 23.59%
- Verdict
- OVERPRICED
- Comps
- 20 within 1.0 mi
Show comp detail 12 sales within ~0.75 mi
| Address | Dist | Beds/Ba | Sqft | Sold | Price | $/sf | Match |
|---|---|---|---|---|---|---|---|
| 3651 Austin Dr Unit N7 | 0.12mi | 3/2.0 | 1,216 (+0%) | 11mo | $59,400 | $49 | 85 |
| 3583 Austin Rd #131 | 0.00mi | 3/2.0 | 1,064 (-12%) | 4mo | $49,830 | $47 | 76 |
| 3583 Austin Rd #67 | 0.00mi | 3/2.0 | 1,064 (-12%) | 4mo | $67,225 | $63 | 76 |
| 3583 Austin Rd #24 | 0.12mi | 3/2.0 | 1,344 (+11%) | 4mo | $69,560 | $52 | 74 |
| 3583 Austin Rd #97 | 0.12mi | 3/2.0 | 1,296 (+7%) | 13mo | $69,900 | $54 | 73 |
| 3600 N Broadway | 0.29mi | 3/1.5 | 1,255 (+3%) | 11mo | $175,000 | $139 | 70 |
| 3583 Austin Dr #94 | 0.12mi | 3/2.0 | 1,056 (-13%) | 4mo | $47,500 | $45 | 70 |
| 3583 Austin Rd #68 | 0.12mi | 3/2.0 | 1,078 (-11%) | 10mo | $49,600 | $46 | 67 |
| 3583 Austin Rd #130 | 0.12mi | 3/2.0 | 1,038 (-15%) | 8mo | $69,000 | $66 | 63 |
| 830 Millwood Dr | 0.66mi | 3/2.0 | 1,200 (-1%) | 8mo | $204,000 | $170 | 60 |
| 3572 N Broadway | 0.27mi | 2/1.0 (-1) | 1,144 (-6%) | 14mo | $87,500 | $76 | 57 |
| 3669 N Broadway | 0.40mi | 3/1.0 | 1,356 (+12%) | 5mo | $157,250 | $116 | 54 |
Match score weights: distance 35% · size 25% · config 20% · recency 20%. Top-matched comps best support the ARV.
Projected returns pro-forma
-3.0% appreciation · 3.0% rent growth · sell at horizon
- IRR
- 48.6%
- Equity multiple
- 3.12×
- Total profit
- $38,681
- Equity at exit
- $9,726
- IRR
- 54.2%
- Equity multiple
- 6.32×
- Total profit
- $97,166
- Equity at exit
- $5,640
Cash invested: $18,264 (down + closing). Projections, not guarantees.
Landlord ↔ Tenant lean methodology
- Overall (STATE)
- 73 Landlord-Friendly
- State Ohio
- 73 Landlord-Friendly · R+6
- County
- — inherits STATE
- City
- — inherits STATE
ZIP-level market 44041
- Home prices YoY
- -31.3%
- Active inventory
- 86
- Price-to-rent
- 3.5×
Monthly cashflow live
- Estimated rent
- $1,549 medium interval (Pro) →
- Mortgage (P&I)
- −$342
- Tax est. 1.5%
- −$82 /mo · $978/yr
- Insurance
- −$27
- HOA
- −$0
- Vacancy / Maint / Mgmt
- −$325
- Net cashflow
- $773
Break-even live
UW: 25.0% down · 7.5% · 30yr · 1.5% tax · 5.0% vac · 8.0% maint · 8.0% mgmt
Financing live
Cash to close
- Down payment
- $16,308
- Closing costs
- $1,957
- Reserves months
- —
- Total cash needed
- —
Loan-product check · same deal, 3 products live
Conventional
25% down · 7.5% · 30yr
- Down + closing
- —
- Monthly P&I
- —
- Monthly cashflow
- —
- DSCR
- —
- Eligible?
- —
Personal DTI + credit; lowest rate.
DSCR
20% down · 8.5% · 30yr
- Down + closing
- —
- Monthly P&I
- —
- Monthly cashflow
- —
- DSCR
- —
- Eligible?
- —
No personal income docs; deal must DSCR.
Hard money
10% down · 12.0% · 12mo
- Down + closing
- —
- Monthly P&I
- —
- Monthly cashflow
- —
- DSCR
- —
- Eligible?
- —
Short-term bridge; refi at stabilization.
Rent comps 1 comps
| Address | Beds | Baths | Sqft | Rent | $/sqft | DOM | Units | Dist |
|---|---|---|---|---|---|---|---|---|
| 430 Garfield St Geneva, OH | 4.0 | 1.0 | 1248 | $1,549 | $1.24 | 43d | 1 | 1.34mi |
Listing history 4 events
-
2026-05-06status Pending 481-char remark
Show marketing remark (481 chars)
This mobile home has been fully updated throughout the interior, offering a fresh and modern living space at an affordable price. The home features an open living area, updated flooring, and fresh paint. The kitchen has been remodeled with new cabinetry, countertops, and appliances. The bathroom has been updated with new fixtures and finishes. Bedrooms are bright and comfortable with ample natural light. Austin Woods Community has undergone a transformation, come check it out!
-
2026-05-01status Active 481-char remark
Show marketing remark (481 chars)
This mobile home has been fully updated throughout the interior, offering a fresh and modern living space at an affordable price. The home features an open living area, updated flooring, and fresh paint. The kitchen has been remodeled with new cabinetry, countertops, and appliances. The bathroom has been updated with new fixtures and finishes. Bedrooms are bright and comfortable with ample natural light. Austin Woods Community has undergone a transformation, come check it out!
-
2025-10-23historical Contingent 481-char remark
Show marketing remark (481 chars)
This mobile home has been fully updated throughout the interior, offering a fresh and modern living space at an affordable price. The home features an open living area, updated flooring, and fresh paint. The kitchen has been remodeled with new cabinetry, countertops, and appliances. The bathroom has been updated with new fixtures and finishes. Bedrooms are bright and comfortable with ample natural light. Austin Woods Community has undergone a transformation, come check it out!
-
2025-10-02$65,230 Active 481-char remark
Show marketing remark (481 chars)
This mobile home has been fully updated throughout the interior, offering a fresh and modern living space at an affordable price. The home features an open living area, updated flooring, and fresh paint. The kitchen has been remodeled with new cabinetry, countertops, and appliances. The bathroom has been updated with new fixtures and finishes. Bedrooms are bright and comfortable with ample natural light. Austin Woods Community has undergone a transformation, come check it out!
ⓘ Source: listings_history table (triggers on properties + properties_extension) + one-shot
backfill from property_details.listing_events for pre-trigger history.
Climate risk First Street
- Flood 4/10 Moderate FEMA zone X (unshaded) · 24% chance over 30 yrs
- Wildfire 1/10 Low
- Heat 3/10 Moderate 7 d/yr ≥94°F today · 18 d/yr by 30 yrs out
- Wind 1/10 Low
- Air quality 3/10 Moderate 2 unhealthy d/yr today · 5 by 30 yrs out
Nearby sold comps map
Loading sold comps map…
Walkable amenities ~0.75 mi
Loading nearby amenities…
Taxation est. · year 1
- Rental income
- $18,588
- − Mortgage interest
- −$3,654
- − Property taxes
- −$978
- − Insurance
- −$326
- − Repairs & maintenance
- −$1,487
- − Management
- −$1,487
- − Depreciation
- −$1,898
- Taxable income
- $8,758
- Est. tax owed @ 24.0%
- −$2,102
- After-tax cash flow
- $7,173/yr
For passive investors: Depreciation is non-cash, so a rental often shows a tax loss while cash-flowing — sheltering income. Rental losses are passive: they offset passive income freely, and up to $25,000/yr can offset ordinary (W-2) income if you actively participate and your MAGI is under $100k (phasing out to $0 by $150k); unused losses carry forward. On sale, claimed depreciation is recaptured at up to 25%, and gains may owe capital-gains tax (a 1031 exchange can defer both). Figures are a year-1 estimate at your 24.0% rate — not tax advice; consult a CPA.
Condition & rehab AI · 12 photos
This fully updated mobile home in Austin Woods Community offers a modern and fresh living space with good curb appeal and minimal repairs needed. It is ready for immediate move-in.
Value-add opportunities
- Both Painting exterior siding — Enhances curb appeal and value.
- Both Landscaping improvements — Enhances curb appeal and value.
- Both New roof — Extends the life of the home and improves value.
- Both New HVAC system — Improves comfort and energy efficiency, increasing value.
- Resale Kitchen backsplash — Enhances the kitchen's aesthetic and functionality.
- Resale Bathroom vanity — Enhances the bathroom's aesthetic and functionality.
Renovation cost estimate screening
Value-add ROI direction
- Both Painting exterior siding — Enhances curb appeal and value. ↑
- Both Landscaping improvements — Enhances curb appeal and value. ↑
- Both New roof — Extends the life of the home and improves value. ↑
- Both New HVAC system — Improves comfort and energy efficiency, increasing value. ↑
- Resale Kitchen backsplash — Enhances the kitchen's aesthetic and functionality. ↑
- Resale Bathroom vanity — Enhances the bathroom's aesthetic and functionality. ↑
ⓘ Cost ranges are severity-bucket heuristics (US national rule-of-thumb). Get contractor quotes + a written scope before underwriting a rehab budget.
Schools (NCES district)
- District
- Geneva Area City
- NCES district ID
- 3904405
- Math proficiency
- 52% ▼ -16.00%
- Reading proficiency
- 60% ▼ -2.00%
- Median HH income
- $43,525
- Composite
- 47.12/100
- National rank
- #2328
- State rank
- #362 of 656 in OH
Livability — Geneva
- Score
- 74/100
- State rank
- #291
- US rank
- #4770
Category grades
Schools grade is shown separately in the Schools card above.
Census & demographics
- County
- Ashtabula · 97,617 people
- Metro
- Cleveland, OH
- Population (ZIP)
- 13,992
- Household income
- $58,438
- Rent vs Own
- Severe rent burden
- 12.5
Population outlook (Ashtabula County) Hauer SSP2
- Today (2025)
- 92,950 people
- By 2030
- 89,146 · -4.1%
- By 2040
- 80,715 · -13.2%
- By 2050
- 72,270 · -22.2%
- By 2075
- 55,780 · -40.0%
- By 2100
- 40,928 · -56.0%
Race, ethnicity, and origin ACS 2023
- Neighborhood character
- Predominantly White (85%)
- Race & ethnicity
- White 85% Hispanic / Latino 7% Two or more races 6% Black 4%
- Hispanic origin (detail)
- Mexican 1% Puerto Rican 4%
- Common ancestry
- Romanian 3% Slovak 2% Lithuanian 2%
- Foreign-born
- 1% · Canada
- Languages at home
- 96% English-only · Spanish 4%
Political lean MEDSL · Ashtabula
- 2024 margin
- Strong R (+28.4) · D 35.4% · R 63.8%
- 2008→2024 swing
- -41.9pp toward R · 2008: 13.5pp · 2024: -28.4pp
- All cycles
- 2024: R+28.4 2020: R+23.5 2016: R+19.0 2012: D+12.1 2008: D+13.5
Not yet ingested
- Civics
- —
Market trends
- HPI YoY
- ▼ -105.04%
- Current HPI
- 230.8747
- Rent YoY
- —
- Metro
- —
- State GDP YoY
- ▲ 1.98%
- F500 in state
- 48
Industry mix (Fortune 500 HQ in OH)
| Industry | F500 HQs | Revenue |
|---|---|---|
| Insurance | 3 | $145B |
|
||
| Industrial Machinery | 3 | $49B |
|
||
| Financial Services | 3 | $24B |
|
||
| Consumer Goods | 2 | $93B |
|
||
| Aerospace / Defense | 2 | $47B |
|
||
| Utilities | 2 | $33B |
|
||
Price history
4 events — show timeline
- 2026-05-06 Pending — MLSNOW
- 2026-05-01 Relisted — MLSNOW
- 2025-10-23 Contingent — MLSNOW
- 2025-10-02 Listed $65,230 MLSNOW
Cash-flow waterfall
monthlySold comps — $/sqft
last 12 mo · ≤1 miLoading sold comps…