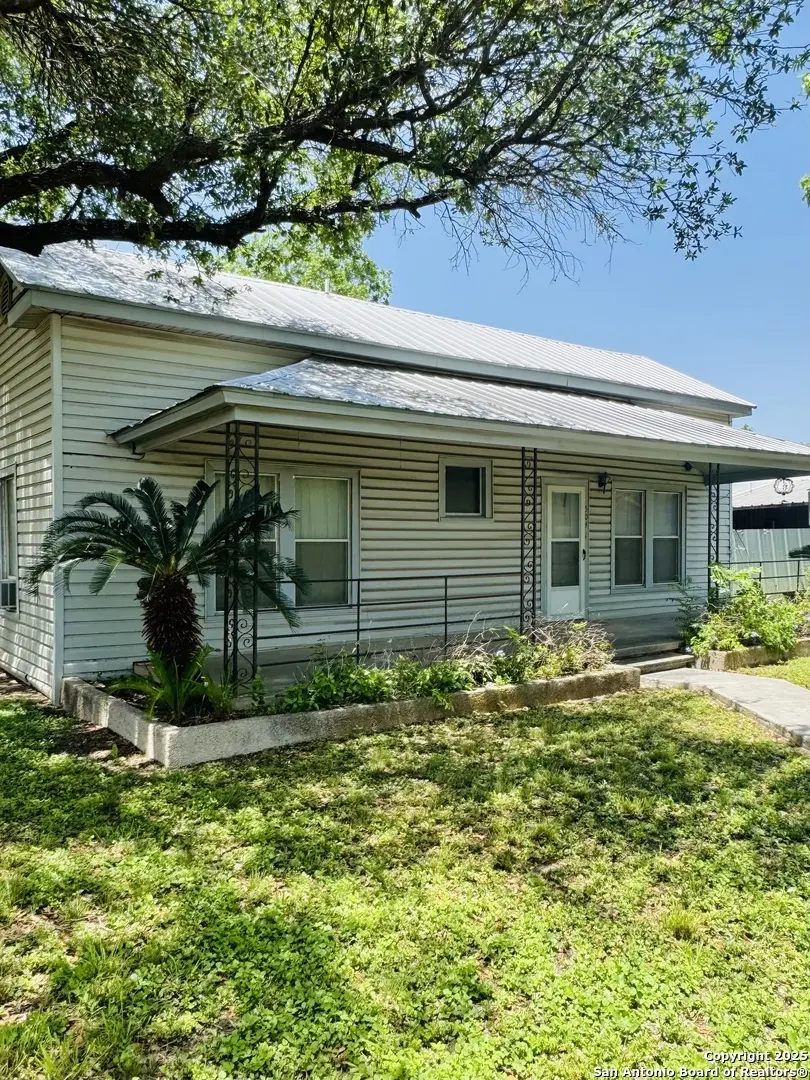
000 Fannin St · Uvalde, TX
Flood risk No data
- FEMA flood zone
- —
- Chance of flooding over 30 yrs
- —
- Est. flood insurance / yr
- —
Fire risk No data
- Est. fire insurance / yr
- —
Heat risk No data
- Hot days now (above threshold)
- —
- Hot days in 30 yrs
- —
Wind risk No data
- Chance of severe wind over 30 yrs
- —
Air-quality risk No data
- Unhealthy air days now
- —
- Unhealthy air days in 30 yrs
- —
Risk factors via First Street. Map © Google.
Why this score? — see what drove the D+ grade
The composite is a weighted blend of 9 inputs, each scored 0–100. Each bar is that input's sub-score; the figure is the points it added to the 100-point composite (weight × sub-score).
- Cash flow +16.5/30.0
- ARV discount +12.1/15.0
- DSCR +5.1/10.0
- 1% rule +4.5/10.0
- Livability +3.7/5.0
- Rent growth +2.5/5.0
- Condition / age +2.2/5.0
- Schools +1.9/10.0
- Appreciation +0.0/10.0
$158,000
🖨 Deal sheet 📄 Offer letter ✓ Due diligence
Key facts
- 0.3 acre lot
- 2 garage spots
- Built 1978
Neighborhood map
What this means for you Summary
Snapshot
- This is a 3-bed/2.0-bath single-family listed at $158k. Condition is rated fair.
Deal economics
- At list price, monthly cash flow is $93 ($1k/yr) — positive.
- The deal already cash-flows at list — no discount required.
- To meet the 1% rule (rent ≥ 1% of price), the offer needs to be $150k (5.1% below list).
- Recommended offer: $139k (12.0% below list) — sets the bar for market timing.
- Cap rate 7.0% vs local median 3.0% in Uvalde — top-decile yield for the area; either an underpriced asset or a hidden risk that comps aren't pricing in. Stress-test before assuming the spread holds.
Location & tenants
- Location reads 74/100 on livability (#187 in TX, #4,844 nationally) — a middle-class / working-renter tenant base. Strengths: cost of living A+, housing A+, health & safety A+; Watch: crime D+, employment D, schools F.
- Uvalde CISD (town): math 19% / reading 26% proficiency, ranked #760 of 826 in TX (top 92%) — low school quality limits family demand, transient renter base, plan for 1-2y turnover; 71% free/reduced lunch — lower-income household profile, screen leases tightly.
- Market conditions: 224 active listings in the ZIP; 1 comparable units currently listed for rent nearby; 17 units permitted in Uvalde County in 2024 (0 in 5+ unit buildings).
Forward outlook
- Local home prices are declining (-3.0%/yr); year-one equity from $1k of loan paydown is wiped out by about $5k of value loss. Plan a longer hold.
- Uvalde County population projected at +14% by 2050 — modest demand growth; plan on rents tracking national, not racing it.
Negotiation context
- It's been on market 350 days — a 12% lower offer ($139k) is reasonable based on typical stale-listing flexibility.
- 2 sale attempts with the ask held roughly flat each time — persistent listings suggest the price (not the market) is what's stuck; bring a comps-based counter.
Questions for the listing agent
- It's been on market 350 days. Have you received any prior offers? Is the seller open to a 12% concession, seller financing, or rate buy-down credit?
- Have any recent inspections been done? Can we get a copy of the seller's disclosures and any deferred-maintenance estimates?
- Built in 1978 — when were the roof, HVAC, electrical panel, plumbing, and water heater last replaced?
- Why hasn't it sold? Are there any deal-killer items the seller is aware of (foundation, flood, title, zoning, code violations)?
- Is there a deadline driving the sale (1031 exchange, divorce, estate, relocation)? That informs how much negotiation room exists.
- Schools are F-rated, which usually means shorter tenancies and higher turnover. Who's the typical renter profile here, and what's been the actual vacancy rate?
- Crime grade is D in this area — have there been break-ins, vandalism, or insurance claims at this property in the last 3 years? What carrier currently insures it and at what premium?
- The area grade is low — what's the realistic commute time and amenity access for the typical tenant pool here? Any planned neighborhood developments (good or bad) we should know about?
- What's the average days-on-market for RENTAL listings here right now (not sales)? A rising rental-DOM trend means longer vacancies and softer asking-rent achievability than the comps imply.
- What's the recent tenant-quality profile in this submarket — average credit score on applications, eviction rate, late-payment / NSF rate, and stable-employment percentage? A property-management company in the area should have these aggregated.
- How much new for-sale + rental construction is in the pipeline within 1–3 miles? Heavy new supply typically softens prices + rents 12–24 months out; constrained supply supports both.
Investment metrics
- 1% rule
- 0.95% ✗
- Cap rate
- 7.00%
- Cash-on-cash
- 2.53%
- DSCR
- 1.11
- GRM
- 8.8
CMA / ARV
- ARV (median comp)
- $175,894
- List price
- $158,000
- Delta
- -10.17%
- Verdict
- UNDERPRICED
- Comps
- 20 within 1.0 mi
Show comp detail 12 sales within ~0.75 mi
| Address | Dist | Beds/Ba | Sqft | Sold | Price | $/sf | Match |
|---|---|---|---|---|---|---|---|
| 208 W Sabinal | 0.32mi | 3/2.0 | 1,318 (-1%) | 2mo | $240,000 | $182 | 81 |
| 214 W Frio | 0.27mi | 3/2.0 | 1,308 (-2%) | 5mo | $179,000 | $137 | 80 |
| 1502 N Park | 0.24mi | 3/1.5 | 1,200 (-10%) | 5mo | $159,000 | $133 | 66 |
| 200 W Pecos St | 0.36mi | 3/1.5 | 1,269 (-5%) | 14mo | $205,000 | $162 | 61 |
| 120 W Brazos | 0.52mi | 3/2.0 | 1,280 (-4%) | 10mo | $249,000 | $195 | 60 |
| 413 Guajillo | 0.60mi | 3/2.0 | 1,420 (+6%) | 6mo | $253,000 | $178 | 57 |
| 448 Melody Ln | 0.67mi | 4/2.0 (+1) | 1,376 (+3%) | 3mo | $239,000 | $174 | 56 |
| 465 Melody | 0.66mi | 3/2.0 | 1,230 (-8%) | 8mo | $160,000 | $130 | 49 |
| 110 Rio Grande St | 0.61mi | 3/2.0 | 1,452 (+9%) | 22mo | $329,999 | $227 | 39 |
| 304 W Sabinal St | 0.37mi | 4/1.0 (+1) | 1,160 (-13%) | 17mo | $169,000 | $146 | 38 |
| 128 Barry St | 0.60mi | 3/1.5 | 1,176 (-12%) | 18mo | $187,500 | $159 | 35 |
| 122 Fenley St | 0.58mi | 3/1.0 | 1,188 (-11%) | 24mo | $129,000 | $109 | 31 |
Match score weights: distance 35% · size 25% · config 20% · recency 20%. Top-matched comps best support the ARV.
Projected returns pro-forma
-3.0% appreciation · 3.0% rent growth · sell at horizon
- IRR
- -12.3%
- Equity multiple
- 0.56×
- Total profit
- $-19,651
- Equity at exit
- $23,558
- IRR
- -3.2%
- Equity multiple
- 0.79×
- Total profit
- $-9,384
- Equity at exit
- $13,661
Cash invested: $44,240 (down + closing). Projections, not guarantees.
Landlord ↔ Tenant lean methodology
- Overall (STATE)
- 87 Strongly Landlord-Friendly
- State Texas
- 87 Strongly Landlord-Friendly · R+5
- County
- — inherits STATE
- City
- — inherits STATE
ZIP-level market 78801
- Active inventory
- 224
- Price-to-rent
- 8.8×
Monthly cashflow live
- Estimated rent
- $1,500 medium interval (Pro) →
- Mortgage (P&I)
- −$829
- Tax est. 1.5%
- −$198 /mo · $2,370/yr
- Insurance
- −$66
- HOA
- −$0
- Vacancy / Maint / Mgmt
- −$315
- Net cashflow
- $93
Break-even live
UW: 25.0% down · 7.5% · 30yr · 1.5% tax · 5.0% vac · 8.0% maint · 8.0% mgmt
Financing live
Cash to close
- Down payment
- $39,500
- Closing costs
- $4,740
- Reserves months
- —
- Total cash needed
- —
Loan-product check · same deal, 3 products live
Conventional
25% down · 7.5% · 30yr
- Down + closing
- —
- Monthly P&I
- —
- Monthly cashflow
- —
- DSCR
- —
- Eligible?
- —
Personal DTI + credit; lowest rate.
DSCR
20% down · 8.5% · 30yr
- Down + closing
- —
- Monthly P&I
- —
- Monthly cashflow
- —
- DSCR
- —
- Eligible?
- —
No personal income docs; deal must DSCR.
Hard money
10% down · 12.0% · 12mo
- Down + closing
- —
- Monthly P&I
- —
- Monthly cashflow
- —
- DSCR
- —
- Eligible?
- —
Short-term bridge; refi at stabilization.
Rent comps 1 comps
| Address | Beds | Baths | Sqft | Rent | $/sqft | DOM | Units | Dist |
|---|---|---|---|---|---|---|---|---|
| 410 Bohme St Uvalde, TX | 2.0 | 2.0 | 1348 | $1,500 | $1.11 | 43d | 1 | 0.99mi |
Listing history 6 events
-
2026-05-31days on market $158,000 Active 350 DOM
-
2026-05-11price $158,000
-
2026-01-14price $160,000
-
2025-09-23status Back on Market
-
2025-08-11status Pending
-
2025-05-03$163,000 New
ⓘ Source: listings_history table (triggers on properties + properties_extension) + one-shot
backfill from property_details.listing_events for pre-trigger history.
Nearby sold comps map
Loading sold comps map…
Walkable amenities ~0.75 mi
Loading nearby amenities…
Taxation est. · year 1
- Rental income
- $18,000
- − Mortgage interest
- −$8,850
- − Property taxes
- −$2,370
- − Insurance
- −$790
- − Repairs & maintenance
- −$1,440
- − Management
- −$1,440
- − Depreciation
- −$4,596
- Taxable loss
- −$1,487
- Est. tax savings @ 24.0%
- +$357
- After-tax cash flow
- $1,474/yr
For passive investors: Depreciation is non-cash, so a rental often shows a tax loss while cash-flowing — sheltering income. Rental losses are passive: they offset passive income freely, and up to $25,000/yr can offset ordinary (W-2) income if you actively participate and your MAGI is under $100k (phasing out to $0 by $150k); unused losses carry forward. On sale, claimed depreciation is recaptured at up to 25%, and gains may owe capital-gains tax (a 1031 exchange can defer both). Figures are a year-1 estimate at your 24.0% rate — not tax advice; consult a CPA.
Condition & rehab AI · 12 photos
The home requires moderate repairs and maintenance, with fresh paint and new siding being the highest-ROI updates for both resale and rental value.
Repairs flagged
- Minor Paint — Painted walls show some wear
- Minor Siding — Weathered siding
- Minor Landscaping — Overgrown vegetation
Value-add opportunities
- Resale Paint interior walls — Fresh paint enhances curb appeal and interior aesthetics
- Resale Replace siding — New siding improves home's appearance and value
- Both Landscaping — Well-maintained landscaping enhances curb appeal and property value
Renovation cost estimate screening
| Repair item | Severity | Est. cost |
|---|---|---|
| Paint · Painted walls show some wear | Minor | $500–3,000 |
| Siding · Weathered siding | Minor | $500–3,000 |
| Landscaping · Overgrown vegetation | Minor | $500–3,000 |
| Total estimated repair cost · 3 items | $1,500–9,000 |
Value-add ROI direction
- Resale Paint interior walls — Fresh paint enhances curb appeal and interior aesthetics ↑
- Resale Replace siding — New siding improves home's appearance and value ↑
- Both Landscaping — Well-maintained landscaping enhances curb appeal and property value ↑
ⓘ Cost ranges are severity-bucket heuristics (US national rule-of-thumb). Get contractor quotes + a written scope before underwriting a rehab budget.
Schools (NCES district)
- District
- Uvalde CISD
- NCES district ID
- 4843720
- Math proficiency
- 19% ▼ -9.00%
- Reading proficiency
- 26% ▼ -3.00%
- Median HH income
- $36,054
- Composite
- 18.63/100
- National rank
- #8897
- State rank
- #760 of 826 in TX
Livability — Uvalde
- Score
- 74/100
- State rank
- #187
- US rank
- #4844
Category grades
Schools grade is shown separately in the Schools card above.
Census & demographics
- Census place
- Uvalde, TX
- Population (ZIP)
- 21,487
Population outlook (Uvalde County) Hauer SSP2
- Today (2025)
- 28,865 people
- By 2030
- 29,675 · +2.8%
- By 2040
- 31,256 · +8.3%
- By 2050
- 32,790 · +13.6%
- By 2075
- 37,013 · +28.2%
- By 2100
- 37,306 · +29.2%
Race, ethnicity, and origin ACS 2023
- Neighborhood character
- Predominantly Hispanic (76%)
- Race & ethnicity
- Hispanic / Latino 76% White 20% Two or more races 18% Native American 1% Asian 1%
- Hispanic origin (detail)
- Mexican 69% Puerto Rican 1%
- Common ancestry
- Lithuanian 2% Serbian 1% Slovak 1%
- Foreign-born
- 11% · Canada
- Languages at home
- 48% English-only · Spanish 51% Other Asian/Pacific 1%
Political lean MEDSL · Uvalde
- 2024 margin
- Solid R (+33.4) · D 32.9% · R 66.3%
- 2008→2024 swing
- -28.1pp toward R · 2008: -5.3pp · 2024: -33.4pp
- All cycles
- 2024: R+33.4 2020: R+20.3 2016: R+10.8 2012: R+8.3 2008: R+5.3
Not yet ingested
- Civics
- —
Market trends
- HPI YoY
- ▼ -113.65%
- Current HPI
- 152.7777
- Rent YoY
- —
- Metro
- —
- State GDP YoY
- ▲ 3.95%
- F500 in state
- 110
Industry mix (Fortune 500 HQ in TX)
| Industry | F500 HQs | Revenue |
|---|---|---|
| Energy | 16 | $1,198B |
|
||
| Technology | 5 | $198B |
|
||
| Engineering / Construction | 4 | $72B |
|
||
| Energy Services | 3 | $60B |
|
||
| Utilities | 3 | $41B |
|
||
| Healthcare | 2 | $330B |
|
||
Price history
-3.1% since first listed5 events — show timeline
- 2026-05-11 Price Changed $158,000 LERA
- 2026-01-14 Price Changed $160,000 LERA
- 2025-09-23 Relisted — LERA
- 2025-08-11 Pending — LERA
- 2025-05-03 Listed $163,000 LERA
Cash-flow waterfall
monthlySold comps — $/sqft
last 12 mo · ≤1 miLoading sold comps…