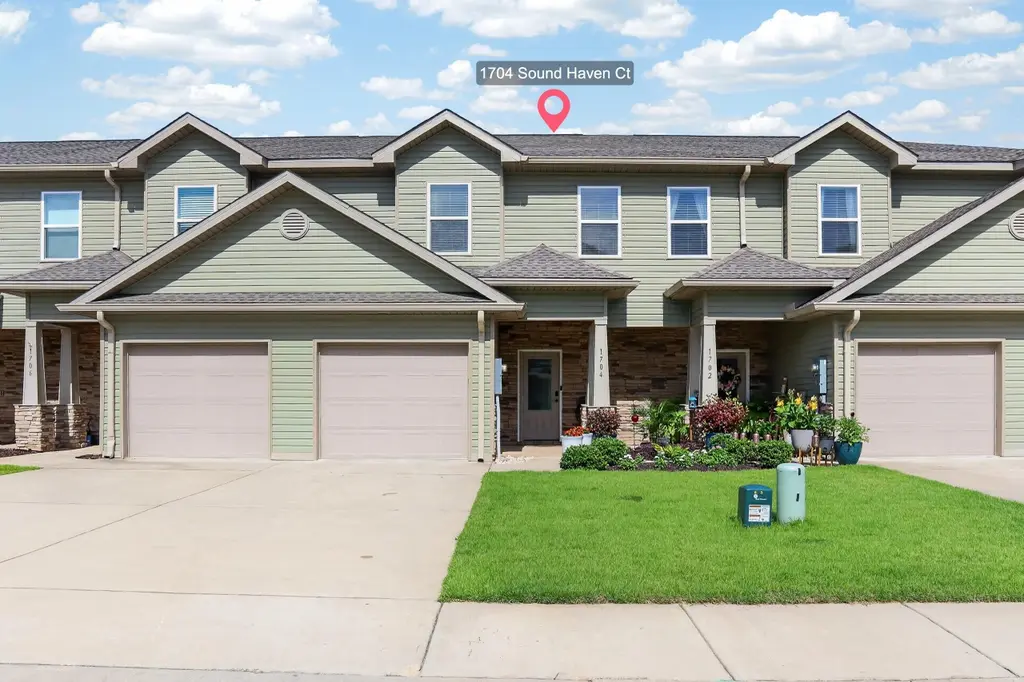
1704 Sound Haven Ct · Navarre, FL
Flood risk 6/10 · Moderate
- FEMA flood zone
- X (shaded)
- Chance of flooding over 30 yrs
- 0.7%
- Est. flood insurance / yr
- $507 – $1,088
Fire risk 3/10 · Minor
- Est. fire insurance / yr
- $947 – $1,759
Heat risk 10/10 · Severe
- Hot days now (above 104°F)
- 7 days/yr
- Hot days in 30 yrs
- 23 days/yr
Wind risk 9/10 · Severe
- Chance of severe wind over 30 yrs
- 99.0%
Air-quality risk 2/10 · Minimal
- Unhealthy air days now
- 1 days/yr
- Unhealthy air days in 30 yrs
- 1 days/yr
Risk factors via First Street. Map © Google.
Why this score? — see what drove the D- grade
The composite is a weighted blend of 9 inputs, each scored 0–100. Each bar is that input's sub-score; the figure is the points it added to the 100-point composite (weight × sub-score).
- Cash flow +12.3/30.0
- Schools +5.3/10.0
- ARV discount +4.9/15.0
- DSCR +3.7/10.0
- Livability +3.5/5.0
- Rent growth +3.2/5.0
- 1% rule +2.7/10.0
- Condition / age +2.5/5.0
- Appreciation +0.0/10.0
$299,000
🖨 Deal sheet (PDF) 📄 Offer letter ✓ Due diligence
Listing remarks MLS
NEW CONSTRUCTION!! THE LAST BUILDING SOLD OUT BEFORE COMPLETION RESERVE YOURS NOW!!. Luxury Craftsman townhome built to the latest building and energy codes. The location is central to both Hurlburt as well as Gulf Breeze and beyond. The home features 3 bedrooms and 2 full bathrooms with a powder room. Luxury vinyl plank flooring throughout for ease of maintenance. The main floor is an open floorplan with the kitchen overlooking the dining area as well as the Great Room are. The kitchen features granite counters as well as stainless steel stove, dishwasher and microwave. On the upper level the Master bedroom is to the back of the home with a private master bathroom featuring a double sink vanity as well as spacious walk in closet. the remaining bedrooms share a full bathroom as well.
Key facts
- Community pool
- Granite countertops
- Open-concept layout
Tags
Property features AI
Finance
- Other: Building area recorded as 1605 (source: County PA Records)
- Financial info: No investor or income/expense details provided
- HOA & community: Community amenities include a pool; Pets allowed
Exterior
- Parking: Attached garage (1 car)
- Security: No security details provided
- Utilities: Electric service; Phone available; Public water; TV cable
- Home design: Attached single unit (townhome/attached); Residential property; Construction complete; Private road frontage; Zoned residential multi-family
- Construction: Built in 2022; Frame construction with vinyl trim; Pitched roof
- Exterior features: Sprinkler system; Curb and gutter; Sidewalk; Storm sewer; Easements; Survey available; Within 1/2 mile to water
Interior
- Kitchen: Dishwasher; Microwave; Self-cleaning oven; Electric stove/oven; Refrigerator
- Bedrooms: 3 bedrooms
- Flooring: No flooring details provided
- Bathrooms: 2 full bathrooms and 1 half bathroom (3 total)
- Heating & cooling: Heat pump (air-to-air) heating; Central cooling
- Interior features: Two stories; Smoke detector; Self-cleaning oven
- Laundry & utility: No laundry details provided
Neighborhood map
What this means for you Summary
Snapshot
- This is a 3-bed/3.0-bath townhouse listed at $299k.
Deal economics
- At list price, monthly cash flow is $-54 ($-643/yr) — negative.
- To cash-flow at today's rent, offer at most $290k (3.2% below list).
- To meet the 1% rule (rent ≥ 1% of price), the offer needs to be $230k (23.1% below list).
- Recommended offer: $230k (23.1% below list) — sets the bar for 1% rule.
- Cap rate 6.1% vs local median 4.1% in Navarre — top-decile yield for the area; either an underpriced asset or a hidden risk that comps aren't pricing in. Stress-test before assuming the spread holds.
Location & tenants
- Location reads 70/100 on livability (#435 in FL) — a middle-class / working-renter tenant base. Strengths: housing A+, employment A, crime A-; Watch: health & safety C-, amenities F, commute F.
- Santa Rosa (suburban): math 63% / reading 60% proficiency, ranked #8 of 73 in FL (top 11%) — acceptable for families but not a draw, mixed tenant base, ~2y average lease.
- Zoned schools: Holley-Navarre Primary (771 students, 41% FRL); Holley-Navarre Middle School (math 71% / reading 63%, grade A-, #80 of 571 statewide, top 14%, 830 students, 42% FRL); Navarre High School (math 49% / reading 58%, grade C-, #146 of 667 statewide, top 22%, 2,406 students, 30% FRL) — zoned schools at 38% FRL track the district average.
- Market conditions: Rents rising (+2.7%/yr); 769 active listings in the ZIP; 12 comparable units currently listed for rent nearby; rentals at typical pace (median 26d on market — plan ~3-4 weeks tenant-placement turnaround); solid renter incomes; 1,983 units permitted in Santa Rosa County in 2024 (128 in 5+ unit buildings).
Forward outlook
- Local home prices are declining (-3.0%/yr); year-one equity from $2k of loan paydown is wiped out by about $9k of value loss. Plan a longer hold.
- Santa Rosa County population projected at +31% by 2050 — long-run rental-demand tailwind backs the buy-and-hold thesis.
Negotiation context
- It's been on market 22 days — a 2% lower offer ($295k) is reasonable based on typical stale-listing flexibility.
- 2 sale attempts since 5y ago with the ask held roughly flat each time — persistent listings suggest the price (not the market) is what's stuck; bring a comps-based counter.
Risks & watch-outs
- Climate carrying-cost: major flood risk; severe wind risk, 99% chance of damaging wind over 30y; extreme-heat days projected 7→23/yr by 2055 (HVAC capex compounding) — expect insurance premiums to compound above CPI over the hold.
Questions for the listing agent
- What do current leases actually rent for vs. the listed asking? Can we see a recent rent roll and the last 12 months of T-12 income?
- Is there a deadline driving the sale (1031 exchange, divorce, estate, relocation)? That informs how much negotiation room exists.
- Schools are A-rated — typically a magnet for longer-tenancy family renters. What's the average tenant stay here, and is there a school-zone premium baked into asking?
- The area grade is low — what's the realistic commute time and amenity access for the typical tenant pool here? Any planned neighborhood developments (good or bad) we should know about?
- What's the average days-on-market for RENTAL listings here right now (not sales)? A rising rental-DOM trend means longer vacancies and softer asking-rent achievability than the comps imply.
- What's the recent tenant-quality profile in this submarket — average credit score on applications, eviction rate, late-payment / NSF rate, and stable-employment percentage? A property-management company in the area should have these aggregated.
- How much new for-sale + rental construction is in the pipeline within 1–3 miles? Heavy new supply typically softens prices + rents 12–24 months out; constrained supply supports both.
Investment metrics
- 1% rule
- 0.77% ✗
- Cap rate
- 6.08%
- Cash-on-cash
- -0.77%
- DSCR
- 0.97
- GRM
- 10.8
CMA / ARV
- ARV (on-the-fly)
- $282,480
- Comps found
- 8
Show comp detail 8 sales within ~0.75 mi
| Address | Dist | Beds/Ba | Sqft | Sold | Price | $/sf | Match |
|---|---|---|---|---|---|---|---|
| 1714 Sound Haven Ct | 0.02mi | 3/2.5 | 1,613 (+0%) | 20mo | $322,500 | $200 | 79 |
| 1823 Sound Haven Ct | 0.26mi | 3/2.5 | 1,614 (+1%) | 11mo | $284,000 | $176 | 76 |
| 1826 Sound Haven Ct | 0.26mi | 3/2.5 | 1,614 (+1%) | 14mo | $297,500 | $184 | 73 |
| 1827 Sound Haven Ct | 0.27mi | 3/2.5 | 1,614 (+1%) | 18mo | $280,000 | $173 | 70 |
| 1825 Sound Haven Ct | 0.26mi | 3/2.5 | 1,614 (+1%) | 19mo | $277,000 | $172 | 69 |
| 1762 Sound Haven Ct | 0.11mi | 4/2.5 (+1) | 1,841 (+15%) | 7mo | $285,000 | $155 | 57 |
| 1740 Sound Haven Ct #1740 | 0.07mi | 4/2.5 (+1) | 1,841 (+15%) | 23mo | $336,000 | $183 | 46 |
| 1768 Soundhaven Ct | 0.13mi | 4/2.5 (+1) | 1,841 (+15%) | 21mo | $320,000 | $174 | 45 |
Match score weights: distance 35% · size 25% · config 20% · recency 20%. Top-matched comps best support the ARV.
Projected returns pro-forma
-3.0% appreciation · 2.74% rent growth · sell at horizon
- IRR
- -17.9%
- Equity multiple
- 0.37×
- Total profit
- $-52,551
- Equity at exit
- $44,582
- IRR
- -10.6%
- Equity multiple
- 0.37×
- Total profit
- $-52,953
- Equity at exit
- $25,852
Cash invested: $83,720 (down + closing). Projections, not guarantees.
Landlord ↔ Tenant lean methodology
- Overall (STATE)
- 87 Strongly Landlord-Friendly
- State Florida
- 87 Strongly Landlord-Friendly · R+3
- County
- — inherits STATE
- City
- — inherits STATE
ZIP-level market 32566
- Home prices YoY
- -26.2%
- Rents YoY
- 2.7%
- Active inventory
- 769
- Price-to-rent
- 10.8×
Monthly cashflow live
- Estimated rent
- $2,301 high interval (Pro) →
- Mortgage (P&I)
- −$1,568
- Tax from tax record
- −$178 /mo · $2,142/yr
- Insurance
- −$125
- HOA
- −$0
- Vacancy / Maint / Mgmt
- −$483
- Net cashflow
- $-54
Break-even live
Sensitivity live
| Price | -10% $116 | -5% $31 | +0% $-54 | +5% $-138 | +10% $-223 |
|---|---|---|---|---|---|
| Rent | -10% $-235 | -5% $-144 | +0% $-54 | +5% $37 | +10% $128 |
| Rate | -1.0pp $97 | -0.5pp $22 | base $-54 | +0.5pp $-131 | +1.0pp $-210 |
UW: 25.0% down · 7.5% · 30yr · 1.5% tax · 5.0% vac · 8.0% maint · 8.0% mgmt
Financing live
Cash to close
- Down payment
- $74,750
- Closing costs
- $8,970
- Reserves months
- —
- Total cash needed
- —
Loan-product check · same deal, 3 products live
Conventional
25% down · 7.5% · 30yr
- Down + closing
- —
- Monthly P&I
- —
- Monthly cashflow
- —
- DSCR
- —
- Eligible?
- —
Personal DTI + credit; lowest rate.
DSCR
20% down · 8.5% · 30yr
- Down + closing
- —
- Monthly P&I
- —
- Monthly cashflow
- —
- DSCR
- —
- Eligible?
- —
No personal income docs; deal must DSCR.
Hard money
10% down · 12.0% · 12mo
- Down + closing
- —
- Monthly P&I
- —
- Monthly cashflow
- —
- DSCR
- —
- Eligible?
- —
Short-term bridge; refi at stabilization.
Rent comps 12 comps
| Address | Beds | Baths | Sqft | Rent | $/sqft | DOM | Units | Dist |
|---|---|---|---|---|---|---|---|---|
| 1717 Sound Haven Ct Navarre, FL | 3.0 | 3.0 | 1396 | $2,050 | $1.47 | 15d | 1 | 0.07mi |
| 1855 Lindsey Magnolia Ct Navarre, FL | 3.0 | 2.0 | 2124 | $2,695 | $1.27 | 16d | 1 | 0.30mi |
| 7160 Blue Jack Dr Navarre, FL | 3.0 | 2.0 | 2171 | $2,595 | $1.20 | 25d | 1 | 0.34mi |
| 7381 Navarre Pkwy Navarre, FL | 1.0–3.0 | 1.0–2.0 | 986 | $2,199 | $2.23 | 15d | 24 | 0.38mi |
| 7459 Harvest Village Ct Navarre, FL | 2.0 | 2.0 | 1102 | $1,650 | $1.50 | 25d | 1 | 0.67mi |
| 7481 Harvest Village Ct Navarre, FL | 3.0 | 2.0 | 1382 | $1,950 | $1.41 | 25d | 1 | 0.74mi |
| 7481 Harvest Village Ct Navarre, FL | 3.0 | 2.0 | 1382 | $1,900 | $1.37 | 16d | 1 | 0.74mi |
| 6952 Cotton Boll Ln Navarre, FL | 4.0 | 2.0 | 1898 | $2,195 | $1.16 | 25d | 1 | 0.92mi |
| 1837 Sunrise Dr Navarre, FL | 3.0 | 2.0 | 1939 | $2,250 | $1.16 | 25d | 1 | 1.12mi |
| 1837 Sunrise Dr Navarre, FL | 3.0 | 2.0 | 1939 | $2,200 | $1.13 | 16d | 1 | 1.12mi |
| 7730 Navarre Pkwy Navarre, FL | 1.0–2.0 | 1.0–2.0 | 950 | $1,850 | $1.95 | 16d | 15 | 1.25mi |
| 2081 Seagrape Dr Navarre, FL | 3.0 | 2.0 | 1932 | $2,400 | $1.24 | 25d | 1 | 1.48mi |
Listing history 16 events
-
2026-06-22days on market $299,000 Active 22 DOM
-
2026-06-18days on market $299,000 Active 19 DOM
-
2026-06-17days on market $299,000 Active 18 DOM
-
2026-06-16days on market $299,000 Active 17 DOM
-
2026-06-15days on market $299,000 Active 16 DOM
-
2026-06-14days on market $299,000 Active 14 DOM
-
2026-06-10days on market $299,000 Active 11 DOM
-
2026-06-09days on market $299,000 Active 10 DOM
-
2026-06-08days on market $299,000 Active 9 DOM
-
2026-06-07days on market $299,000 Active 8 DOM
-
2026-06-05days on market $299,000 Active 5 DOM
-
2026-06-03days on market $299,000 Active 4 DOM
-
2026-06-02days on market $299,000 Active 3 DOM
-
2026-06-01days on market $299,000 Active 2 DOM
-
2026-05-31remarks 699-char remark
-
2026-05-31$299,000 Active 1 DOM
ⓘ Source: listings_history table (triggers on properties + properties_extension) + one-shot
backfill from property_details.listing_events for pre-trigger history.
Tax reassessment forecast FL · Resets to sale price
- Current annual tax
- $2,142 · $178/mo
- Projected year-2 tax
- $2,482 · $207/mo
- Expected delta
- +$340/yr (+$28/mo · 15.9%)
ⓘ Screening estimate from a state-policy table — verify with the county assessor before closing.
Climate risk First Street
- Flood 6/10 Major FEMA zone X (shaded) · 70% chance over 30 yrs
- Wildfire 3/10 Moderate
- Heat 10/10 Extreme 7 d/yr ≥104°F today · 23 d/yr by 30 yrs out
- Wind 9/10 Extreme 99% chance of damaging wind over 30 yrs
- Air quality 2/10 Low 1 unhealthy d/yr today · 1 by 30 yrs out
Nearby sold comps map
Loading sold comps map…
Walkable amenities ~0.75 mi
Loading nearby amenities…
Taxation est. · year 1
- Rental income
- $27,607
- − Mortgage interest
- −$16,749
- − Property taxes
- −$2,142
- − Insurance
- −$1,495
- − Repairs & maintenance
- −$2,209
- − Management
- −$2,209
- − Depreciation
- −$8,698
- Taxable loss
- −$5,894
- Est. tax savings @ 24.0%
- +$1,415
- After-tax cash flow
- $771/yr
For passive investors: Depreciation is non-cash, so a rental often shows a tax loss while cash-flowing — sheltering income. Rental losses are passive: they offset passive income freely, and up to $25,000/yr can offset ordinary (W-2) income if you actively participate and your MAGI is under $100k (phasing out to $0 by $150k); unused losses carry forward. On sale, claimed depreciation is recaptured at up to 25%, and gains may owe capital-gains tax (a 1031 exchange can defer both). Figures are a year-1 estimate at your 24.0% rate — not tax advice; consult a CPA.
Schools (NCES district)
- District
- Santa Rosa
- NCES district ID
- 1201650
- Math proficiency
- 63% ▼ -6.00%
- Reading proficiency
- 60% ▼ -5.00%
- Median HH income
- $58,161
- Composite
- 53.12/100
- National rank
- #1511
- State rank
- #8 of 73 in FL
Livability — Navarre
- Score
- 70/100
- State rank
- #435
- US rank
- #7790
Category grades
Schools grade is shown separately in the Schools card above.
Census & demographics
- Census place
- Navarre, FL
- County
- Santa Rosa County · 194,764 people
- City population
- 43,883
- Metro
- Pensacola-Ferry Pass-Brent, FL
- Population (ZIP)
- 43,883
- Household income
- $105,551
- Rent vs Own
- Severe rent burden
- 608.0
Population outlook (Santa Rosa County) Hauer SSP2
- Today (2025)
- 195,978 people
- By 2030
- 209,782 · +7.0%
- By 2040
- 235,293 · +20.1%
- By 2050
- 256,408 · +30.8%
- By 2075
- 298,074 · +52.1%
- By 2100
- 303,216 · +54.7%
Race, ethnicity, and origin ACS 2023
- Neighborhood character
- Predominantly White (75%)
- Race & ethnicity
- White 75% Two or more races 9% Hispanic / Latino 9% Black 6% Asian 3%
- Hispanic origin (detail)
- Mexican 3% Puerto Rican 2%
- Common ancestry
- Scotch-Irish 3% Lithuanian 3% Romanian 2%
- Foreign-born
- 6% · Canada, Jamaica, Vietnam
- Languages at home
- 92% English-only · Spanish 4% German/W. Germanic 1% Tagalog/Filipino 1%
Political lean MEDSL · Santa Rosa
- 2024 margin
- Solid R (+51.0) · D 24.1% · R 75.0%
- 2008→2024 swing
- -3.0pp toward R · 2008: -47.9pp · 2024: -51.0pp
- All cycles
- 2024: R+51.0 2020: R+46.5 2016: R+53.5 2012: R+52.6 2008: R+47.9
Not yet ingested
- Civics
- —
Market trends
- HPI YoY
- ▼ -105.87%
- Current HPI
- 298.6821
- Rent YoY
- ▲ 2.74%
- Metro
- Pensacola-Ferry Pass-Brent, FL
- State GDP YoY
- ▲ 3.28%
- F500 in state
- 36
Industry mix (Fortune 500 HQ in FL)
| Industry | F500 HQs | Revenue |
|---|---|---|
| Industrial Technology | 2 | $29B |
|
||
| Insurance | 2 | $17B |
|
||
| Retail | 1 | $60B |
|
||
| Technology Distribution | 1 | $58B |
|
||
| Homebuilding | 1 | $35B |
|
||
| Technology Manufacturing | 1 | $35B |
|
||
Price history
+496.8% since first listed5 events — show timeline
- 2026-05-29 Listed $299,000 NAMLS
- 2022-02-23 Sold (MLS) $269,900 ECAR
- 2021-05-07 Pending — ECAR
- 2021-04-19 Listed $269,900 ECAR
- 2020-02-05 Sold (Public Records) $50,100 Public Records
Property tax history
+24.1%/yrLatest (2025): $2,142 · -0.2% YoY. Source: county tax records.
Cash-flow waterfall
monthlySold comps — $/sqft
last 12 mo · ≤1 miLoading sold comps…