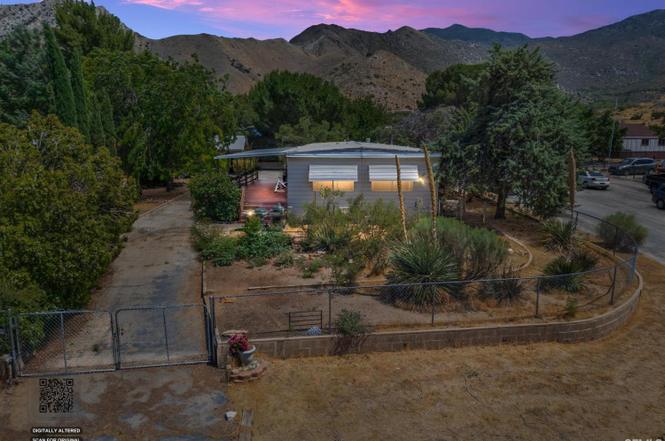
3708 Pepperwood Dr · Weldon, CA
Flood risk 6/10 · Moderate
- FEMA flood zone
- X (unshaded)
- Chance of flooding over 30 yrs
- 0.73%
- Est. flood insurance / yr
- $507 – $1,088
Fire risk 8/10 · Major
- Est. fire insurance / yr
- $659 – $1,223
Heat risk 7/10 · Major
- Hot days now (above 94°F)
- 7 days/yr
- Hot days in 30 yrs
- 18 days/yr
Wind risk 1/10 · Minimal
- Chance of severe wind over 30 yrs
- —
Air-quality risk 9/10 · Severe
- Unhealthy air days now
- 19 days/yr
- Unhealthy air days in 30 yrs
- 21 days/yr
Risk factors via First Street. Map © Google.
Why this score? — see what drove the A- grade
The composite is a weighted blend of 9 inputs, each scored 0–100. Each bar is that input's sub-score; the figure is the points it added to the 100-point composite (weight × sub-score).
- Cash flow +30.0/30.0
- ARV discount +15.0/15.0
- 1% rule +10.0/10.0
- DSCR +10.0/10.0
- Appreciation +7.8/10.0
- Schools +2.9/10.0
- Rent growth +2.5/5.0
- Condition / age +2.5/5.0
- Livability +2.4/5.0
$99,500
🖨 Deal sheet 📄 Offer letter ✓ Due diligence
Listing remarks MLS
A must See, a very well maintained 2 Bedroom Manufactured Home with a Two Car Detached Garage. This great home has large Rooms, Great Master Bath, with a Tile Shower. The Home has two covered patio's it is all fenced, with a circular driveway. The Seller is leaving the Refrigerator and the Washer and Dryer, there are Hunter Ceiling Fans throughout the home, Call for you appointment, great retirement home, just move it.
Key facts
- Ample parking
- Spacious corner lot
- Covered patio
Tags
Property features AI
Exterior
- Parking: 2-car garage
- Utilities: Public water; Sewer
- Home design: Owned property
- Construction: Roof: Other (see remarks); Reserved items include 5-gallon gas tanks and window AC units
- Exterior features: Covered patio; Has RV space
Interior
- Kitchen: Range/Oven; Dishwasher; Disposal
- Bathrooms: 2 full bathrooms
- Heating & cooling: Floor/wall heating
- Interior features: Formal living room; Formal dining room; Breakfast area; Range/Oven; Dishwasher; Disposal; Floor/wall heater
Neighborhood map
What this means for you Summary
Snapshot
- This is a 2-bed/2.0-bath manufactured listed at $100k.
Deal economics
- At list price, monthly cash flow is $643 ($8k/yr) — positive.
- The deal already cash-flows at list — no discount required.
- Meets the 1% rule at list price ($2k rent vs $100k).
- Cap rate 14.1% vs local median 5.0% in Weldon — top-decile yield for the area; either an underpriced asset or a hidden risk that comps aren't pricing in. Stress-test before assuming the spread holds.
Location & tenants
- Location reads 48/100 on livability (#1,218 in CA) — a working-class tenant base; expect higher turnover. Strengths: cost of living A-, housing B+; Watch: schools F, amenities F, commute F.
- South Fork Union (rural): math 25% / reading 40% proficiency, ranked #1,016 of 1,400 in CA (top 73%) — families likely to look elsewhere, expect single-tenant / working-renter base with shorter leases; 67% free/reduced lunch — lower-income household profile, screen leases tightly.
- Market conditions: 135 active listings in the ZIP; 3,244 units permitted in Kern County in 2024 (73 in 5+ unit buildings).
Forward outlook
- In year one you build about $6k of equity ($688 loan paydown + $6k appreciation (5.5% local appreciation)).
- Kern County population projected at +17% by 2050 — long-run rental-demand tailwind backs the buy-and-hold thesis.
- At projected returns (5.5% appreciation + 3.0% rent growth), your $28k cash investment doubles in ~2 years — after that, you're playing with house money.
- By year 6, paydown + projected appreciation supports a ~$34k cash-out refi (75% LTV) — recoverable capital for the next deal without selling this one.
Negotiation context
- Only 2 days on market — expect competitive offers; lowballing is unlikely to land.
- 2 sale attempts since 8y ago; this cycle's ask has dropped $10k (9%) from the opening price — seller is motivated, your offer sets the floor, not the list.
- Current owner paid $78k; 27% above their basis — modest negotiation headroom, anchor on the comps not their cost.
Risks & watch-outs
- Climate carrying-cost: major flood risk; severe wildfire risk; extreme-heat days projected 7→18/yr by 2055 (HVAC capex compounding) — expect insurance premiums to compound above CPI over the hold.
Questions for the listing agent
- Built in 1972 — when were the roof, HVAC, electrical panel, plumbing, and water heater last replaced?
- Is there a deadline driving the sale (1031 exchange, divorce, estate, relocation)? That informs how much negotiation room exists.
- Schools are F-rated, which usually means shorter tenancies and higher turnover. Who's the typical renter profile here, and what's been the actual vacancy rate?
- What's the average days-on-market for RENTAL listings here right now (not sales)? A rising rental-DOM trend means longer vacancies and softer asking-rent achievability than the comps imply.
- What's the recent tenant-quality profile in this submarket — average credit score on applications, eviction rate, late-payment / NSF rate, and stable-employment percentage? A property-management company in the area should have these aggregated.
- How much new for-sale + rental construction is in the pipeline within 1–3 miles? Heavy new supply typically softens prices + rents 12–24 months out; constrained supply supports both.
Investment metrics
- 1% rule
- 1.71% ✓
- Cap rate
- 14.05%
- Cash-on-cash
- 27.71%
- DSCR
- 2.23
- GRM
- 4.9
CMA / ARV
- ARV (on-the-fly)
- $191,520
- Comps found
- 3
Show comp detail 3 sales within ~0.75 mi
| Address | Dist | Beds/Ba | Sqft | Sold | Price | $/sf | Match |
|---|---|---|---|---|---|---|---|
| 8305 Wildmint Dr | 0.28mi | 2/2.0 | 1,404 (-2%) | 13mo | $195,000 | $139 | 72 |
| 3712 Goat Ranch Rd | 0.08mi | 2/2.0 | 1,344 (-7%) | 23mo | $178,500 | $133 | 66 |
| 8601 Deerbrush Ave | 0.44mi | 2/2.0 | 1,248 (-13%) | 9mo | $125,000 | $100 | 50 |
Match score weights: distance 35% · size 25% · config 20% · recency 20%. Top-matched comps best support the ARV.
Projected returns pro-forma
5.55% appreciation · 3.0% rent growth · sell at horizon
- IRR
- 38.1%
- Equity multiple
- 3.41×
- Total profit
- $67,099
- Equity at exit
- $59,743
- IRR
- 35.8%
- Equity multiple
- 6.96×
- Total profit
- $166,121
- Equity at exit
- $105,998
Cash invested: $27,860 (down + closing). Projections, not guarantees.
Landlord ↔ Tenant lean methodology
- Overall (STATE)
- 18 Strongly Tenant-Friendly
- State California
- 18 Strongly Tenant-Friendly · D+13
- County
- — inherits STATE
- City
- — inherits STATE
ZIP-level market 93240
- Home prices YoY
- 1.6%
- Active inventory
- 135
- Price-to-rent
- 4.9×
Monthly cashflow live
- Estimated rent
- $1,702 medium interval (Pro) →
- Mortgage (P&I)
- −$522
- Tax from tax record
- −$138 /mo · $1,653/yr
- Insurance
- −$41
- HOA
- −$0
- Vacancy / Maint / Mgmt
- −$357
- Net cashflow
- $643
Break-even live
UW: 25.0% down · 7.5% · 30yr · 1.5% tax · 5.0% vac · 8.0% maint · 8.0% mgmt
Financing live
Cash to close
- Down payment
- $24,875
- Closing costs
- $2,985
- Reserves months
- —
- Total cash needed
- —
Loan-product check · same deal, 3 products live
Conventional
25% down · 7.5% · 30yr
- Down + closing
- —
- Monthly P&I
- —
- Monthly cashflow
- —
- DSCR
- —
- Eligible?
- —
Personal DTI + credit; lowest rate.
DSCR
20% down · 8.5% · 30yr
- Down + closing
- —
- Monthly P&I
- —
- Monthly cashflow
- —
- DSCR
- —
- Eligible?
- —
No personal income docs; deal must DSCR.
Hard money
10% down · 12.0% · 12mo
- Down + closing
- —
- Monthly P&I
- —
- Monthly cashflow
- —
- DSCR
- —
- Eligible?
- —
Short-term bridge; refi at stabilization.
Listing history 4 events
-
2026-06-19days on market $99,500 Active 2 DOM
-
2026-06-17price $99,500 Active 1 DOM
-
2026-06-17remarks 699-char remark
-
2026-06-17$109,500 Active 1 DOM
ⓘ Source: listings_history table (triggers on properties + properties_extension) + one-shot
backfill from property_details.listing_events for pre-trigger history.
Tax reassessment forecast CA · Resets to sale price
- Current annual tax
- $1,653 · $138/mo
- Projected year-2 tax
- $1,653 · $138/mo
- Expected delta
- $0/yr ($0/mo · -0.0%)
ⓘ Screening estimate from a state-policy table — verify with the county assessor before closing.
Climate risk First Street
- Flood 6/10 Major FEMA zone X (unshaded) · 73% chance over 30 yrs
- Wildfire 8/10 Severe
- Heat 7/10 Severe 7 d/yr ≥94°F today · 18 d/yr by 30 yrs out
- Wind 1/10 Low
- Air quality 9/10 Extreme 19 unhealthy d/yr today · 21 by 30 yrs out
Nearby sold comps map
Loading sold comps map…
Walkable amenities ~0.75 mi
Loading nearby amenities…
Taxation est. · year 1
- Rental income
- $20,421
- − Mortgage interest
- −$5,574
- − Property taxes
- −$1,653
- − Insurance
- −$498
- − Repairs & maintenance
- −$1,634
- − Management
- −$1,634
- − Depreciation
- −$2,895
- Taxable income
- $6,535
- Est. tax owed @ 24.0%
- −$1,568
- After-tax cash flow
- $6,152/yr
For passive investors: Depreciation is non-cash, so a rental often shows a tax loss while cash-flowing — sheltering income. Rental losses are passive: they offset passive income freely, and up to $25,000/yr can offset ordinary (W-2) income if you actively participate and your MAGI is under $100k (phasing out to $0 by $150k); unused losses carry forward. On sale, claimed depreciation is recaptured at up to 25%, and gains may owe capital-gains tax (a 1031 exchange can defer both). Figures are a year-1 estimate at your 24.0% rate — not tax advice; consult a CPA.
Schools (NCES district)
- District
- South Fork Union
- NCES district ID
- 0637470
- Math proficiency
- 25% ▲ 5.00%
- Reading proficiency
- 40% ▲ 5.00%
- Median HH income
- $32,532
- Composite
- 29.31/100
- National rank
- #11836
- State rank
- #1016 of 1400 in CA
Livability — Weldon
- Score
- 48/100
- State rank
- #1218
- US rank
- #26156
Category grades
Schools grade is shown separately in the Schools card above.
Census & demographics
- Census place
- Weldon, CA
- Population (ZIP)
- 5,622
Population outlook (Kern County) Hauer SSP2
- Today (2025)
- 947,286 people
- By 2030
- 978,984 · +3.3%
- By 2040
- 1,045,018 · +10.3%
- By 2050
- 1,105,232 · +16.7%
- By 2075
- 1,229,538 · +29.8%
- By 2100
- 1,238,059 · +30.7%
Race, ethnicity, and origin ACS 2023
- Neighborhood character
- Predominantly White (78%)
- Race & ethnicity
- White 78% Hispanic / Latino 13% Two or more races 5% Asian 2% Native American 1%
- Hispanic origin (detail)
- Mexican 11%
- Common ancestry
- Italian 3% Portuguese 2% Iranian 2%
- Foreign-born
- 5% · Canada, South Korea
- Languages at home
- 93% English-only · Spanish 4% Korean 1% Other Asian/Pacific 1%
Political lean MEDSL · Kern
- 2024 margin
- Strong R (+21.1) · D 38.2% · R 59.3% · Other 2.5%
- 2008→2024 swing
- -3.3pp toward R · 2008: -17.8pp · 2024: -21.1pp
- All cycles
- 2024: R+21.1 2020: R+10.2 2016: R+15.0 2012: R+20.9 2008: R+17.8
Not yet ingested
- Civics
- —
Market trends
- HPI YoY
- ▲ 5.55%
- Current HPI
- 341.2481
- Rent YoY
- —
- Metro
- —
- State GDP YoY
- ▲ 3.21%
- F500 in state
- 116
Industry mix (Fortune 500 HQ in CA)
| Industry | F500 HQs | Revenue |
|---|---|---|
| Technology | 27 | $1,492B |
|
||
| Financial Services | 3 | $174B |
|
||
| Retail | 3 | $44B |
|
||
| Insurance | 3 | $26B |
|
||
| Media / Entertainment | 2 | $115B |
|
||
| Pharmaceuticals / Biotech | 2 | $62B |
|
||
Price history
+17.1% since first listed5 events — show timeline
- 2026-06-17 Price Changed $99,500 GEMLS
- 2026-06-17 Listed $109,500 GEMLS
- 2018-06-28 Sold (Public Records) $78,500 Public Records
- 2018-06-28 Sold (MLS) $78,500 SSMLS
- 2018-05-21 Listed $85,000 SSMLS
Property tax history
+19.8%/yrLatest (2025): $1,653 · +46.1% YoY. Source: county tax records.
Cash-flow waterfall
monthlySold comps — $/sqft
last 12 mo · ≤1 miLoading sold comps…