2524 Tierra Oriente · Tierra Grande, TX
Flood risk 1/10 · Minimal
- FEMA flood zone
- X (unshaded)
- Chance of flooding over 30 yrs
- 0.0%
- Est. flood insurance / yr
- $507 – $1,088
Fire risk 5/10 · Moderate
- Est. fire insurance / yr
- $1,222 – $2,270
Heat risk 9/10 · Severe
- Hot days now (above 110°F)
- 6 days/yr
- Hot days in 30 yrs
- 20 days/yr
Wind risk 9/10 · Severe
- Chance of severe wind over 30 yrs
- 99.0%
Air-quality risk 1/10 · Minimal
- Unhealthy air days now
- 0 days/yr
- Unhealthy air days in 30 yrs
- 0 days/yr
Risk factors via First Street. Map © Google.
Why this score? — see what drove the C- grade
The composite is a weighted blend of 9 inputs, each scored 0–100. Each bar is that input's sub-score; the figure is the points it added to the 100-point composite (weight × sub-score).
- Cash flow +16.3/30.0
- ARV discount +15.0/15.0
- 1% rule +5.6/10.0
- DSCR +5.1/10.0
- Rent growth +3.1/5.0
- Schools +3.1/10.0
- Livability +2.6/5.0
- Condition / age +2.5/5.0
- Appreciation +0.0/10.0
$154,900
🖨 Deal sheet 📄 Offer letter ✓ Due diligence
Listing remarks MLS
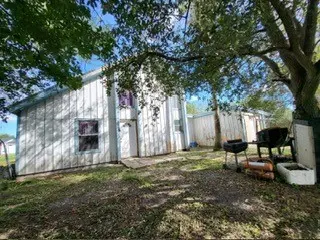
Country residence featuring 3 bedrooms and 2 bathrooms, situated near the London area on a 1.24-acre lot. While it requires some modernization, it presents an excellent opportunity to personalize the space. There is ample room available for pets.
Key facts
- 1.24 acre lot
- Garage
- Built 1983
Neighborhood map
What this means for you Summary
Snapshot
- This is a 3-bed/2.0-bath single-family listed at $155k.
Deal economics
- At list price, monthly cash flow is $85 ($1k/yr) — positive.
- The deal already cash-flows at list — no discount required.
- Meets the 1% rule at list price ($2k rent vs $155k).
- Recommended offer: $136k (12.0% below list) — sets the bar for market timing.
Location & tenants
- Location reads 52/100 on livability (#1,462 in TX) — a working-class tenant base; expect higher turnover. Strengths: cost of living A+, crime A, housing B; Watch: health & safety C-, schools F, amenities F.
- Bishop CISD (town): math 31% / reading 42% proficiency, ranked #486 of 826 in TX (top 59%) — families likely to look elsewhere, expect single-tenant / working-renter base with shorter leases.
- Market conditions: Rents rising (+2.3%/yr); 417 active listings in the ZIP; 1,397 units permitted in Nueces County in 2024 (47 in 5+ unit buildings).
- This rent runs 36% of the median local income ($55k/yr) — at the standard rent-burdened threshold; future hikes will face affordability resistance.
Forward outlook
- Local home prices are declining (-3.0%/yr); year-one equity from $1k of loan paydown is wiped out by about $5k of value loss. Plan a longer hold.
- Nueces County population projected at +36% by 2050 — long-run rental-demand tailwind backs the buy-and-hold thesis.
Negotiation context
- It's been on market 524 days — a 12% lower offer ($136k) is reasonable based on typical stale-listing flexibility.
- 6 sale attempts since 23y ago with the ask held roughly flat each time — persistent listings suggest the price (not the market) is what's stuck; bring a comps-based counter.
- Current owner paid $76k; list at $155k implies a 102% gain — meaningful room to come down on a strong offer.
Risks & watch-outs
- Watch-outs: property tax is 2.6% of price.
- Climate carrying-cost: severe wind risk, 99% chance of damaging wind over 30y; moderate wildfire risk; extreme-heat days projected 6→20/yr by 2055 (HVAC capex compounding) — expect insurance premiums to compound above CPI over the hold.
Questions for the listing agent
- It's been on market 524 days. Have you received any prior offers? Is the seller open to a 12% concession, seller financing, or rate buy-down credit?
- Property tax is high relative to price — has the assessment been appealed recently, and will the sale trigger a re-assessment?
- Why hasn't it sold? Are there any deal-killer items the seller is aware of (foundation, flood, title, zoning, code violations)?
- Is there a deadline driving the sale (1031 exchange, divorce, estate, relocation)? That informs how much negotiation room exists.
- Schools are F-rated, which usually means shorter tenancies and higher turnover. Who's the typical renter profile here, and what's been the actual vacancy rate?
- What's the average days-on-market for RENTAL listings here right now (not sales)? A rising rental-DOM trend means longer vacancies and softer asking-rent achievability than the comps imply.
- What's the recent tenant-quality profile in this submarket — average credit score on applications, eviction rate, late-payment / NSF rate, and stable-employment percentage? A property-management company in the area should have these aggregated.
- How much new for-sale + rental construction is in the pipeline within 1–3 miles? Heavy new supply typically softens prices + rents 12–24 months out; constrained supply supports both.
Investment metrics
- 1% rule
- 1.06% ✓
- Cap rate
- 6.95%
- Cash-on-cash
- 2.36%
- DSCR
- 1.11
- GRM
- 7.8
CMA / ARV
- ARV (median comp)
- $274,898
- List price
- $154,900
- Delta
- -43.65%
- Verdict
- UNDERPRICED
- Comps
- 3 within 1.0 mi
Projected returns pro-forma
-3.0% appreciation · 2.32% rent growth · sell at horizon
- IRR
- -13.3%
- Equity multiple
- 0.52×
- Total profit
- $-20,672
- Equity at exit
- $23,096
- IRR
- -5.5%
- Equity multiple
- 0.65×
- Total profit
- $-15,071
- Equity at exit
- $13,393
Cash invested: $43,372 (down + closing). Projections, not guarantees.
Landlord ↔ Tenant lean methodology
- Overall (STATE)
- 87 Strongly Landlord-Friendly
- State Texas
- 87 Strongly Landlord-Friendly · R+5
- County
- — inherits STATE
- City
- — inherits STATE
ZIP-level market 78415
- Rents YoY
- 2.3%
- Active inventory
- 417
- Price-to-rent
- 7.8×
Monthly cashflow live
- Estimated rent
- $1,646 medium interval (Pro) →
- Mortgage (P&I)
- −$812
- Tax from tax record
- −$338 /mo · $4,058/yr
- Insurance
- −$65
- HOA
- −$0
- Vacancy / Maint / Mgmt
- −$346
- Net cashflow
- $85
Break-even live
UW: 25.0% down · 7.5% · 30yr · 1.5% tax · 5.0% vac · 8.0% maint · 8.0% mgmt
Financing live
Cash to close
- Down payment
- $38,725
- Closing costs
- $4,647
- Reserves months
- —
- Total cash needed
- —
Loan-product check · same deal, 3 products live
Conventional
25% down · 7.5% · 30yr
- Down + closing
- —
- Monthly P&I
- —
- Monthly cashflow
- —
- DSCR
- —
- Eligible?
- —
Personal DTI + credit; lowest rate.
DSCR
20% down · 8.5% · 30yr
- Down + closing
- —
- Monthly P&I
- —
- Monthly cashflow
- —
- DSCR
- —
- Eligible?
- —
No personal income docs; deal must DSCR.
Hard money
10% down · 12.0% · 12mo
- Down + closing
- —
- Monthly P&I
- —
- Monthly cashflow
- —
- DSCR
- —
- Eligible?
- —
Short-term bridge; refi at stabilization.
Listing history 36 events
-
2026-06-18days on market $154,900 Active 524 DOM
-
2026-06-17days on market $154,900 Active 523 DOM
-
2026-06-16days on market $154,900 Active 522 DOM
-
2026-06-15days on market $154,900 Active 521 DOM
-
2026-06-14days on market $154,900 Active 519 DOM
-
2026-06-13days on market $154,900 Active 518 DOM
-
2026-06-10days on market $154,900 Active 516 DOM
-
2026-06-09days on market $154,900 Active 515 DOM
-
2026-06-08days on market $154,900 Active 514 DOM
-
2026-06-07days on market $154,900 Active 513 DOM
-
2026-06-03days on market $154,900 Active 509 DOM
-
2026-06-02days on market $154,900 Active 508 DOM
-
2026-06-01days on market $154,900 Active 507 DOM
-
2026-05-31days on market $154,900 Active 506 DOM
-
2026-05-30days on market $154,900 Active 505 DOM
-
2025-07-09price $154,900 246-char remark
Show marketing remark (246 chars)
Country residence featuring 3 bedrooms and 2 bathrooms, situated near the London area on a 1.24-acre lot. While it requires some modernization, it presents an excellent opportunity to personalize the space. There is ample room available for pets.
-
2025-01-10$159,900 Active 246-char remark
Show marketing remark (246 chars)
Country residence featuring 3 bedrooms and 2 bathrooms, situated near the London area on a 1.24-acre lot. While it requires some modernization, it presents an excellent opportunity to personalize the space. There is ample room available for pets.
-
2024-06-07soldstatus
-
2024-06-04soldstatus Closed
-
2024-05-17status Pending
-
2024-05-16historical Active Under Contract
-
2024-03-01price $274,500
-
2023-12-04$159,900 Active
-
2023-08-23price $284,500
-
2023-08-23soldstatus
-
2023-07-25price $289,000
-
2023-05-24$109,990 Active
-
2023-05-08$295,000 Active
-
2022-10-17soldstatus
-
2022-08-02soldstatus
-
2022-07-27soldstatus
-
2011-12-14soldstatus
-
2009-03-03$125,000
-
2004-02-13soldstatus
-
2004-02-13soldstatus $76,500
-
2003-07-16$89,900
ⓘ Source: listings_history table (triggers on properties + properties_extension) + one-shot
backfill from property_details.listing_events for pre-trigger history.
Tax reassessment forecast TX · Resets to sale price
- Current annual tax
- $4,058 · $338/mo
- Projected year-2 tax
- $4,058 · $338/mo
- Expected delta
- $0/yr ($0/mo · 0.0%)
ⓘ Screening estimate from a state-policy table — verify with the county assessor before closing.
Climate risk First Street
- Flood 1/10 Low FEMA zone X (unshaded) · 0% chance over 30 yrs
- Wildfire 5/10 Major
- Heat 9/10 Extreme 6 d/yr ≥110°F today · 20 d/yr by 30 yrs out
- Wind 9/10 Extreme 99% chance of damaging wind over 30 yrs
- Air quality 1/10 Low 0 unhealthy d/yr today · 0 by 30 yrs out
Nearby sold comps map
Loading sold comps map…
Walkable amenities ~0.75 mi
Loading nearby amenities…
Taxation est. · year 1
- Rental income
- $19,752
- − Mortgage interest
- −$8,677
- − Property taxes
- −$4,058
- − Insurance
- −$774
- − Repairs & maintenance
- −$1,580
- − Management
- −$1,580
- − Depreciation
- −$4,506
- Taxable loss
- −$1,424
- Est. tax savings @ 24.0%
- +$342
- After-tax cash flow
- $1,365/yr
For passive investors: Depreciation is non-cash, so a rental often shows a tax loss while cash-flowing — sheltering income. Rental losses are passive: they offset passive income freely, and up to $25,000/yr can offset ordinary (W-2) income if you actively participate and your MAGI is under $100k (phasing out to $0 by $150k); unused losses carry forward. On sale, claimed depreciation is recaptured at up to 25%, and gains may owe capital-gains tax (a 1031 exchange can defer both). Figures are a year-1 estimate at your 24.0% rate — not tax advice; consult a CPA.
Schools (NCES district)
- District
- Bishop CISD
- NCES district ID
- 4810260
- Math proficiency
- 31% ▼ -33.00%
- Reading proficiency
- 42% ▼ -12.00%
- Median HH income
- $46,296
- Composite
- 31.2/100
- National rank
- #6044
- State rank
- #486 of 826 in TX
Livability — Tierra Grande
- Score
- 52/100
- State rank
- #1462
- US rank
- #25063
Category grades
Schools grade is shown separately in the Schools card above.
Census & demographics
- Census place
- Tierra Grande, TX
- County
- Nueces County · 296,836 people
- Metro
- Corpus Christi, TX
- Population (ZIP)
- 43,080
- Household income
- $54,990
- Rent vs Own
- Severe rent burden
- 1730.0
Population outlook (Nueces County) Hauer SSP2
- Today (2025)
- 418,037 people
- By 2030
- 447,123 · +7.0%
- By 2040
- 505,911 · +21.0%
- By 2050
- 567,522 · +35.8%
- By 2075
- 729,686 · +74.6%
- By 2100
- 847,087 · +102.6%
Race, ethnicity, and origin ACS 2023
- Neighborhood character
- Predominantly Hispanic (83%)
- Race & ethnicity
- Hispanic / Latino 83% Two or more races 41% White 12% Black 3%
- Hispanic origin (detail)
- Mexican 75%
- Foreign-born
- 9% · Canada
- Languages at home
- 59% English-only · Spanish 40%
Political lean MEDSL · Nueces
- 2024 margin
- R (+11.5) · D 43.8% · R 55.3%
- 2008→2024 swing
- -7.1pp toward R · 2008: -4.4pp · 2024: -11.5pp
- All cycles
- 2024: R+11.5 2020: R+2.9 2016: R+1.5 2012: R+3.2 2008: R+4.4
Not yet ingested
- Civics
- —
Market trends
- HPI YoY
- ▼ -173.20%
- Current HPI
- 158.011
- Rent YoY
- ▲ 2.32%
- Metro
- Corpus Christi, TX
- State GDP YoY
- ▲ 3.95%
- F500 in state
- 110
Industry mix (Fortune 500 HQ in TX)
| Industry | F500 HQs | Revenue |
|---|---|---|
| Energy | 16 | $1,198B |
|
||
| Technology | 5 | $198B |
|
||
| Engineering / Construction | 4 | $72B |
|
||
| Energy Services | 3 | $60B |
|
||
| Utilities | 3 | $41B |
|
||
| Healthcare | 2 | $330B |
|
||
Price history
+72.3% since first listed21 events — show timeline
- 2025-07-09 Price Changed $154,900 CBMLS
- 2025-01-10 Listed $159,900 CBMLS
- 2024-06-07 Sold (Public Records) — Public Records
- 2024-06-04 Sold (MLS) — CBMLS
- 2024-05-17 Pending — CBMLS
- 2024-05-16 Contingent — CBMLS
- 2024-03-01 Price Changed $274,500 CBMLS
- 2023-12-04 Listed $159,900 CBMLS
- 2023-08-23 Price Changed $284,500 CBMLS
- 2023-08-23 Sold (Public Records) — Public Records
- 2023-07-25 Price Changed $289,000 CBMLS
- 2023-05-24 Listed $109,990 CBMLS
- 2023-05-08 Listed $295,000 CBMLS
- 2022-10-17 Sold (Public Records) — Public Records
- 2022-08-02 Sold (Public Records) — Public Records
- 2022-07-27 Sold (Public Records) — Public Records
- 2011-12-14 Sold (Public Records) — Public Records
- 2009-03-03 Listed $125,000 CBMLS
- 2004-02-13 Sold (Public Records) $76,500 Public Records
- 2004-02-13 Sold (MLS) — CBMLS
- 2003-07-16 Listed $89,900 CBMLS
Property tax history
+7.5%/yrLatest (2025): $4,058 · +60.1% YoY. Source: county tax records.
Cash-flow waterfall
monthlySold comps — $/sqft
last 12 mo · ≤1 miLoading sold comps…