315 W Main St · Sheldon, IL
Flood risk 1/10 · Minimal
- FEMA flood zone
- X (unshaded)
- Chance of flooding over 30 yrs
- 0.0%
- Est. flood insurance / yr
- $473 – $860
Fire risk 1/10 · Minimal
- Est. fire insurance / yr
- $804 – $1,492
Heat risk 3/10 · Minor
- Hot days now (above 103°F)
- 7 days/yr
- Hot days in 30 yrs
- 17 days/yr
Wind risk 2/10 · Minimal
- Chance of severe wind over 30 yrs
- 0.0%
Air-quality risk 2/10 · Minimal
- Unhealthy air days now
- 2 days/yr
- Unhealthy air days in 30 yrs
- 2 days/yr
Risk factors via First Street. Map © Google.
Why this score? — see what drove the D+ grade
The composite is a weighted blend of 9 inputs, each scored 0–100. Each bar is that input's sub-score; the figure is the points it added to the 100-point composite (weight × sub-score).
- Cash flow +15.0/30.0
- ARV discount +7.5/15.0
- 1% rule +5.0/10.0
- DSCR +5.0/10.0
- Appreciation +5.0/10.0
- Livability +3.0/5.0
- Rent growth +2.5/5.0
- Condition / age +2.5/5.0
- Schools +2.4/10.0
$21,000
🖨 Deal sheet (PDF) 📄 Offer letter ✓ Due diligence
Listing remarks MLS
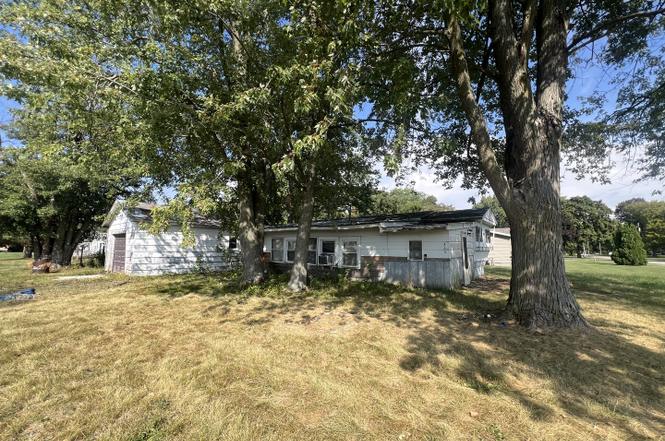
Mobile home on its own corner lot with plenty of shade trees plus large room addition & attached 1 car garage. Gas F/A in Mobile home & Electric heat in Addition. Several newer Replacement Windows. Also includes frame vinyl sided storage shed w/ concrete floor. Could use a little TLC but very affordable living. BEING SOLD AS IS
Key facts
- 0.35 acre lot
- Garage
- Built 1979
Property features AI
Finance
- Other: Fee simple ownership
- HOA & community: No master association fee required
Exterior
- Parking: Attached garage (owned) — 1 garage space, 1 total parking space
- Utilities: Public water; Public sewer
- Home design: Manufactured detached single-family home; Single-story living (main level rooms listed)
- Construction: Wood siding; Approximately 41–50 years old; Unfinished basement (456 sq ft)
- Exterior features: Lot dimensions approximately 85 x 180; Lot smaller than 0.25 acre
Interior
- Kitchen: Range; Refrigerator
- Bedrooms: Master bedroom on main level (16 x 9); Second bedroom on main level (9 x 10); Two additional bedrooms listed
- Flooring: Carpet in living room and some bedrooms; Vinyl flooring in master bedroom; Wood laminate in kitchen and dining room
- Bathrooms: 1 full bathroom
- Heating & cooling: Forced air heating; Central air conditioning
- Interior features: 5 total rooms; Unfinished basement (partial crawl space)
- Laundry & utility: Laundry room
Neighborhood map
What this means for you Summary
Snapshot
- This is a 2-bed/1.0-bath single-family listed at $21k.
Deal economics
- At list price, monthly cash flow is $609 ($7k/yr) — positive.
- The deal already cash-flows at list — no discount required.
- Meets the 1% rule at list price ($954 rent vs $21k).
- Recommended offer: $18k (12.0% below list) — sets the bar for market timing.
Location & tenants
- Location reads 60/100 on livability (#946 in IL) — a middle-class / working-renter tenant base. Strengths: cost of living A+, housing A+, crime A; Watch: amenities F, commute F, employment F.
- Milford Area PSD 124 (rural): math 30% / reading 26% proficiency, ranked #278 of 620 in IL (top 45%) — low school quality limits family demand, transient renter base, plan for 1-2y turnover.
- Zoned schools: Milford Grade School West Campus (math 32% / reading 22%, grade F, #749 of 2,056 statewide, top 40%, 356 students, 0% FRL); Milford High School Campus (math 34% / reading 34%, grade F, #126 of 693 statewide, top 21%, 163 students, 0% FRL) — zoned schools average 0% FRL vs 47% district-wide (47 pts lower); this property's tenant base skews higher-income than the district average.
- Market conditions: 14 active listings in the ZIP; 14 units permitted in Iroquois County in 2024 (0 in 5+ unit buildings).
Forward outlook
- In year one you build about $775 of equity ($145 loan paydown + $630 appreciation (3.0% local appreciation)).
- Iroquois County population projected at -20% by 2050 — secular population decline; favor cash flow + early exit over multi-decade hold.
- At projected returns (3.0% appreciation + 3.0% rent growth), your $6k cash investment doubles in ~1 year — after that, you're playing with house money.
Negotiation context
- It's been on market 229 days — a 12% lower offer ($18k) is reasonable based on typical stale-listing flexibility.
- 3 sale attempts since 19y ago; this cycle's ask has dropped $21k (50%) from the opening price — seller is motivated, your offer sets the floor, not the list.
- Current owner paid $11k; list at $21k implies a 91% gain — meaningful room to come down on a strong offer.
Questions for the listing agent
- It's been on market 229 days. Have you received any prior offers? Is the seller open to a 12% concession, seller financing, or rate buy-down credit?
- Built in 1979 — when were the roof, HVAC, electrical panel, plumbing, and water heater last replaced?
- Why hasn't it sold? Are there any deal-killer items the seller is aware of (foundation, flood, title, zoning, code violations)?
- Is there a deadline driving the sale (1031 exchange, divorce, estate, relocation)? That informs how much negotiation room exists.
- Schools are F-rated, which usually means shorter tenancies and higher turnover. Who's the typical renter profile here, and what's been the actual vacancy rate?
- The area grade is low — what's the realistic commute time and amenity access for the typical tenant pool here? Any planned neighborhood developments (good or bad) we should know about?
- What's the average days-on-market for RENTAL listings here right now (not sales)? A rising rental-DOM trend means longer vacancies and softer asking-rent achievability than the comps imply.
- What's the recent tenant-quality profile in this submarket — average credit score on applications, eviction rate, late-payment / NSF rate, and stable-employment percentage? A property-management company in the area should have these aggregated.
- How much new for-sale + rental construction is in the pipeline within 1–3 miles? Heavy new supply typically softens prices + rents 12–24 months out; constrained supply supports both.
Investment metrics
- 1% rule
- 4.54% ✓
- Cap rate
- 41.07%
- Cash-on-cash
- 124.21%
- DSCR
- 6.53
- GRM
- 1.8
CMA / ARV
- ARV (on-the-fly)
- $103,488
- Comps found
- 2
Show comp detail 2 sales within ~0.75 mi
| Address | Dist | Beds/Ba | Sqft | Sold | Price | $/sf | Match |
|---|---|---|---|---|---|---|---|
| 315 W Main St | 0.00mi | 2/1.0 | 1,056 (0%) | 1mo | $15,000 | $14 | 99 |
| 285 E Center St | 0.38mi | 3/1.0 (+1) | 1,056 (0%) | 10mo | $103,000 | $98 | 68 |
Match score weights: distance 35% · size 25% · config 20% · recency 20%. Top-matched comps best support the ARV.
Projected returns pro-forma
3.0% appreciation · 3.0% rent growth · sell at horizon
- IRR
- —
- Equity multiple
- 8.03×
- Total profit
- $41,308
- Equity at exit
- $9,443
- IRR
- —
- Equity multiple
- 16.77×
- Total profit
- $92,748
- Equity at exit
- $14,552
Cash invested: $5,880 (down + closing). Projections, not guarantees.
Landlord ↔ Tenant lean methodology
- Overall (STATE)
- 43 Moderately Tenant-Leaning
- State Illinois
- 43 Moderately Tenant-Leaning · D+7
- County
- — inherits STATE
- City
- — inherits STATE
ZIP-level market 60966
- Active inventory
- 14
- Price-to-rent
- 1.8×
Monthly cashflow live
- Estimated rent
- $954 medium interval (Pro) →
- Mortgage (P&I)
- −$110
- Tax est. 1.5%
- −$26 /mo · $315/yr
- Insurance
- −$9
- HOA
- −$0
- Lot rent
- −$0
- Vacancy / Maint / Mgmt
- −$200
- Net cashflow
- $609
Break-even live
Sensitivity live
| Price | -10% $623 | -5% $616 | +0% $609 | +5% $601 | +10% $594 |
|---|---|---|---|---|---|
| Rent | -10% $533 | -5% $571 | +0% $609 | +5% $646 | +10% $684 |
| Rate | -1.0pp $619 | -0.5pp $614 | base $609 | +0.5pp $603 | +1.0pp $598 |
UW: 25.0% down · 7.5% · 30yr · 1.5% tax · 5.0% vac · 8.0% maint · 8.0% mgmt
Financing live
Cash to close
- Down payment
- $5,250
- Closing costs
- $630
- Reserves months
- —
- Total cash needed
- —
Loan-product check · same deal, 3 products live
Conventional
25% down · 7.5% · 30yr
- Down + closing
- —
- Monthly P&I
- —
- Monthly cashflow
- —
- DSCR
- —
- Eligible?
- —
Personal DTI + credit; lowest rate.
DSCR
20% down · 8.5% · 30yr
- Down + closing
- —
- Monthly P&I
- —
- Monthly cashflow
- —
- DSCR
- —
- Eligible?
- —
No personal income docs; deal must DSCR.
Hard money
10% down · 12.0% · 12mo
- Down + closing
- —
- Monthly P&I
- —
- Monthly cashflow
- —
- DSCR
- —
- Eligible?
- —
Short-term bridge; refi at stabilization.
Listing history 16 events
-
2026-05-12status Pending
-
2026-03-23price $21,000
-
2026-01-26price $22,500
-
2025-12-27price $28,000
-
2025-11-13price $29,900
-
2025-10-31price $36,500
-
2025-10-13price $39,600
-
2025-09-25$42,000 Active
-
2009-08-07soldstatus $11,000 338-char remark
Show marketing remark (338 chars)
Mobile home on its own corner lot with plenty of shade trees plus large room addition & attached 1 car garage. Gas F/A in Mobile home & Electric heat in Addition. Several newer Replacement Windows. Also includes frame vinyl sided storage shed w/ concrete floor. Could use a little TLC but very affordable living. BEING SOLD AS IS
-
2009-08-01soldstatus $11,000
-
2009-07-27historical 338-char remark
Show marketing remark (338 chars)
Mobile home on its own corner lot with plenty of shade trees plus large room addition & attached 1 car garage. Gas F/A in Mobile home & Electric heat in Addition. Several newer Replacement Windows. Also includes frame vinyl sided storage shed w/ concrete floor. Could use a little TLC but very affordable living. BEING SOLD AS IS
-
2009-07-22$14,900 338-char remark
Show marketing remark (338 chars)
Mobile home on its own corner lot with plenty of shade trees plus large room addition & attached 1 car garage. Gas F/A in Mobile home & Electric heat in Addition. Several newer Replacement Windows. Also includes frame vinyl sided storage shed w/ concrete floor. Could use a little TLC but very affordable living. BEING SOLD AS IS
-
2007-12-07soldstatus $13,000 321-char remark
Show marketing remark (321 chars)
Mobile home on its own corner lot with plenty of shade trees plus large room addition & attached 1 car garage. Gas F/A in Mobile home & Electric heat in Addition. Several newer Replacement Windows. Also includes frame vinyl sided storage shed w/ concrete floor. Could use a little TLC but very affordable living.
-
2007-12-01soldstatus $13,000
-
2007-11-19historical 321-char remark
Show marketing remark (321 chars)
Mobile home on its own corner lot with plenty of shade trees plus large room addition & attached 1 car garage. Gas F/A in Mobile home & Electric heat in Addition. Several newer Replacement Windows. Also includes frame vinyl sided storage shed w/ concrete floor. Could use a little TLC but very affordable living.
-
2007-11-01$17,000 321-char remark
Show marketing remark (321 chars)
Mobile home on its own corner lot with plenty of shade trees plus large room addition & attached 1 car garage. Gas F/A in Mobile home & Electric heat in Addition. Several newer Replacement Windows. Also includes frame vinyl sided storage shed w/ concrete floor. Could use a little TLC but very affordable living.
ⓘ Source: listings_history table (triggers on properties + properties_extension) + one-shot
backfill from property_details.listing_events for pre-trigger history.
Climate risk First Street
- Flood 1/10 Low FEMA zone X (unshaded) · 0% chance over 30 yrs
- Wildfire 1/10 Low
- Heat 3/10 Moderate 7 d/yr ≥103°F today · 17 d/yr by 30 yrs out
- Wind 2/10 Low 0% chance of damaging wind over 30 yrs
- Air quality 2/10 Low 2 unhealthy d/yr today · 2 by 30 yrs out
Nearby sold comps map
Loading sold comps map…
Walkable amenities ~0.75 mi
Loading nearby amenities…
Taxation est. · year 1
- Rental income
- $11,449
- − Mortgage interest
- −$1,176
- − Property taxes
- −$315
- − Insurance
- −$105
- − Repairs & maintenance
- −$916
- − Management
- −$916
- − Depreciation
- −$611
- Taxable income
- $7,410
- Est. tax owed @ 24.0%
- −$1,778
- After-tax cash flow
- $5,525/yr
For passive investors: Depreciation is non-cash, so a rental often shows a tax loss while cash-flowing — sheltering income. Rental losses are passive: they offset passive income freely, and up to $25,000/yr can offset ordinary (W-2) income if you actively participate and your MAGI is under $100k (phasing out to $0 by $150k); unused losses carry forward. On sale, claimed depreciation is recaptured at up to 25%, and gains may owe capital-gains tax (a 1031 exchange can defer both). Figures are a year-1 estimate at your 24.0% rate — not tax advice; consult a CPA.
Schools (NCES district)
- District
- Milford Area PSD 124
- NCES district ID
- 1701416
- Math proficiency
- 30% ▲ 2.00%
- Reading proficiency
- 26% ▼ -11.00%
- Median HH income
- $44,333
- Composite
- 24.03/100
- National rank
- #7767
- State rank
- #278 of 620 in IL
Livability — Sheldon
- Score
- 60/100
- State rank
- #946
- US rank
- #18538
Category grades
Schools grade is shown separately in the Schools card above.
Census & demographics
- Census place
- Sheldon, IL
- Population (ZIP)
- 1,554
Population outlook (Iroquois County) Hauer SSP2
- Today (2025)
- 26,826 people
- By 2030
- 25,771 · -3.9%
- By 2040
- 23,589 · -12.1%
- By 2050
- 21,523 · -19.8%
- By 2075
- 17,998 · -32.9%
- By 2100
- 14,979 · -44.2%
Race, ethnicity, and origin ACS 2023
- Neighborhood character
- Predominantly White (95%)
- Race & ethnicity
- White 95% Two or more races 3% Hispanic / Latino 2%
- Common ancestry
- Lithuanian 9% Slovak 5% Romanian 3%
- Foreign-born
- 1% · Canada
- Languages at home
- 98% English-only · Spanish 2%
Political lean MEDSL · Iroquois
- 2024 margin
- Solid R (+57.3) · D 20.6% · R 78.0% · Other 1.4%
- 2008→2024 swing
- -27.5pp toward R · 2008: -29.8pp · 2024: -57.3pp
- All cycles
- 2024: R+57.3 2020: R+56.7 2016: R+56.0 2012: R+44.7 2008: R+29.8
Not yet ingested
- Civics
- —
Market trends
- HPI YoY
- —
- Current HPI
- —
- Rent YoY
- —
- Metro
- —
- State GDP YoY
- ▲ 1.59%
- F500 in state
- 60
Industry mix (Fortune 500 HQ in IL)
| Industry | F500 HQs | Revenue |
|---|---|---|
| Insurance | 4 | $201B |
|
||
| Consumer Goods | 4 | $87B |
|
||
| Industrial Machinery | 3 | $64B |
|
||
| Healthcare | 2 | $55B |
|
||
| Retail / Pharmacy | 1 | $148B |
|
||
| Agriculture / Food | 1 | $86B |
|
||
Price history
+23.5% since first listed16 events — show timeline
- 2026-05-12 Pending — MRED as Distributed by MLS Grid
- 2026-03-23 Price Changed $21,000 MRED as Distributed by MLS Grid
- 2026-01-26 Price Changed $22,500 MRED as Distributed by MLS Grid
- 2025-12-27 Price Changed $28,000 MRED as Distributed by MLS Grid
- 2025-11-13 Price Changed $29,900 MRED as Distributed by MLS Grid
- 2025-10-31 Price Changed $36,500 MRED as Distributed by MLS Grid
- 2025-10-13 Price Changed $39,600 MRED as Distributed by MLS Grid
- 2025-09-25 Listed $42,000 MRED as Distributed by MLS Grid
- 2009-08-07 Sold (MLS) $11,000 MRED as Distributed by MLS Grid
- 2009-08-01 Sold (Public Records) $11,000 Public Records
- 2009-07-27 Listing Removed — MRED as Distributed by MLS Grid
- 2009-07-22 Listed $14,900 MRED as Distributed by MLS Grid
- 2007-12-07 Sold (MLS) $13,000 MRED as Distributed by MLS Grid
- 2007-12-01 Sold (Public Records) $13,000 Public Records
- 2007-11-19 Listing Removed — MRED as Distributed by MLS Grid
- 2007-11-01 Listed $17,000 MRED as Distributed by MLS Grid
Property tax history
-25.2%/yrLatest (2024): $12 · -96.8% YoY. Source: county tax records.
Cash-flow waterfall
monthlySold comps — $/sqft
last 12 mo · ≤1 miLoading sold comps…