4759 Lobelia Rd · Vass, NC
Flood risk 1/10 · Minimal
- FEMA flood zone
- X (unshaded)
- Chance of flooding over 30 yrs
- 0.0%
- Est. flood insurance / yr
- $507 – $1,088
Fire risk 4/10 · Minor
- Est. fire insurance / yr
- $906 – $1,684
Heat risk 8/10 · Major
- Hot days now (above 106°F)
- 7 days/yr
- Hot days in 30 yrs
- 17 days/yr
Wind risk 6/10 · Moderate
- Chance of severe wind over 30 yrs
- 69.0%
Air-quality risk 1/10 · Minimal
- Unhealthy air days now
- 0 days/yr
- Unhealthy air days in 30 yrs
- 0 days/yr
Risk factors via First Street. Map © Google.
Why this score? — see what drove the D grade
The composite is a weighted blend of 9 inputs, each scored 0–100. Each bar is that input's sub-score; the figure is the points it added to the 100-point composite (weight × sub-score).
- Cash flow +14.8/30.0
- ARV discount +7.5/15.0
- DSCR +4.5/10.0
- Schools +4.4/10.0
- Livability +2.9/5.0
- 1% rule +2.8/10.0
- Rent growth +2.5/5.0
- Condition / age +2.5/5.0
- Appreciation +0.0/10.0
$240,000
🖨 Deal sheet 📄 Offer letter ✓ Due diligence
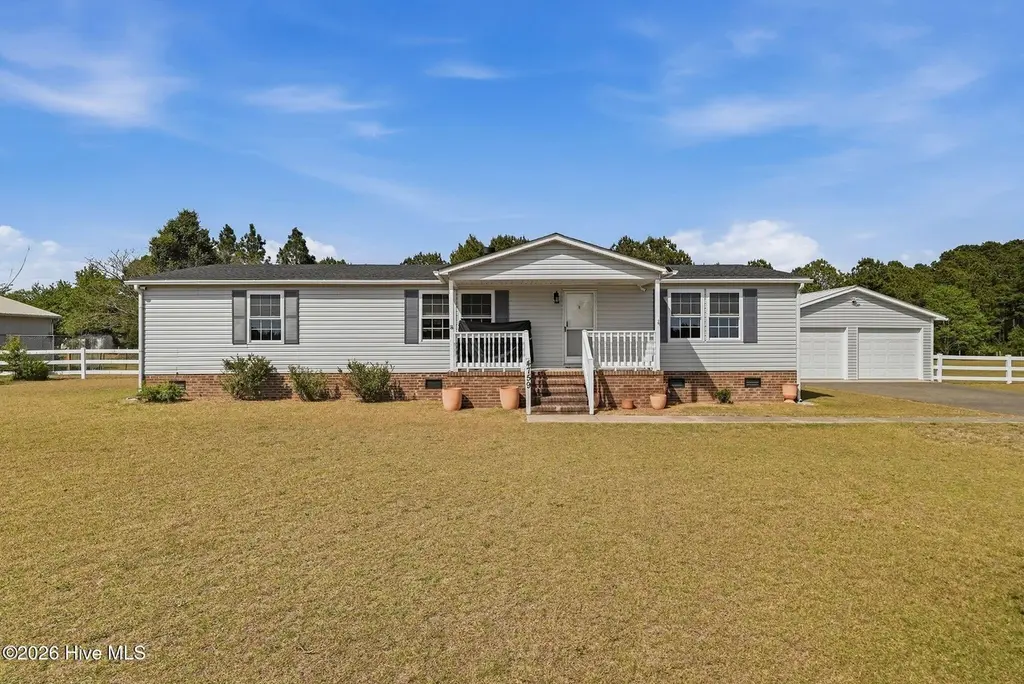
Listing remarks
Welcome home to 4759 Lobelia Road! This home has been completely renovated inside, making it the perfect move-in ready home for you! There is luxury vinyl plank flooring throughout the entire home, with a beautifully updated kitchen and updated primary en suite bathroom! Situated on almost an acre, the expansive back deck makes entertaining effortless. There is plenty of extra storage in the detached 2-car garage! This home has been meticulously cared for and is clean, inviting, and waiting for you to fall in love!
Key facts
- Extra storage
- Updated kitchen
- Completely renovated
Tags
Property features AI
Finance
- Other: Lot about 0.89 acres; Road frontage: city street and state road; Zoning: RI
Exterior
- Parking: 2 total parking spaces; 2-car garage
- Utilities: Public water; Sewer connected; Water connected
- Home design: Manufactured home; One level; Entry level: 1
- Construction: Vinyl siding; Frame construction
- Exterior features: Deck; Shingle roof; Has a view; No fencing
Interior
- Kitchen: Electric oven; Refrigerator; Dishwasher
- Bedrooms: Total rooms: 7
- Bathrooms: 2 full bathrooms
- Heating & cooling: Heat pump heating; Electric heating; Central air conditioning
- Interior features: Ceiling fan(s); Crawl space basement
- Laundry & utility: Washer; Dryer; Washer hookup
Neighborhood map
What this means for you Summary
Snapshot
- This is a 2-bed/2.0-bath single-family listed at $240k.
Deal economics
- At list price, monthly cash flow is $67 ($807/yr) — positive.
- The deal already cash-flows at list — no discount required.
- To meet the 1% rule (rent ≥ 1% of price), the offer needs to be $186k (22.3% below list).
- Recommended offer: $186k (22.3% below list) — sets the bar for 1% rule.
- Cap rate 6.6% vs local median 4.0% in Vass — top-decile yield for the area; either an underpriced asset or a hidden risk that comps aren't pricing in. Stress-test before assuming the spread holds.
Location & tenants
- Location reads 57/100 on livability (#593 in NC) — a working-class tenant base; expect higher turnover. Strengths: cost of living A+, housing A; Watch: health & safety C-, crime D, amenities F.
- Moore County Schools (rural): math 48% / reading 54% proficiency, ranked #58 of 178 in NC (top 33%) — acceptable for families but not a draw, mixed tenant base, ~2y average lease.
- Zoned schools: Vass-Lakeview Elementary (math 57% / reading 51%, grade C, #328 of 1,410 statewide, top 24%, 460 students, 42% FRL); Crain'S Creek Middle (math 37% / reading 47%, grade D-, #199 of 475 statewide, top 43%, 592 students, 51% FRL); Union Pines High (math 63% / reading 70%, grade B, #150 of 535 statewide, top 28%, 1,438 students, 34% FRL) — zoned schools at 42% FRL track the district average.
- Market conditions: 225 active listings in the ZIP; solid renter incomes; 941 units permitted in Moore County in 2024 (0 in 5+ unit buildings).
Forward outlook
- Local home prices are declining (-3.0%/yr); year-one equity from $2k of loan paydown is wiped out by about $7k of value loss. Plan a longer hold.
- Moore County population projected at +29% by 2050 — long-run rental-demand tailwind backs the buy-and-hold thesis.
Negotiation context
- It's been on market 24 days — a 2% lower offer ($236k) is reasonable based on typical stale-listing flexibility.
Risks & watch-outs
- Climate carrying-cost: major wind risk, 69% chance of damaging wind over 30y; extreme-heat days projected 7→17/yr by 2055 (HVAC capex compounding) — expect insurance premiums to compound above CPI over the hold.
Questions for the listing agent
- Is there a deadline driving the sale (1031 exchange, divorce, estate, relocation)? That informs how much negotiation room exists.
- Schools are D-rated, which usually means shorter tenancies and higher turnover. Who's the typical renter profile here, and what's been the actual vacancy rate?
- Crime grade is D in this area — have there been break-ins, vandalism, or insurance claims at this property in the last 3 years? What carrier currently insures it and at what premium?
- The area grade is low — what's the realistic commute time and amenity access for the typical tenant pool here? Any planned neighborhood developments (good or bad) we should know about?
- What's the average days-on-market for RENTAL listings here right now (not sales)? A rising rental-DOM trend means longer vacancies and softer asking-rent achievability than the comps imply.
- What's the recent tenant-quality profile in this submarket — average credit score on applications, eviction rate, late-payment / NSF rate, and stable-employment percentage? A property-management company in the area should have these aggregated.
- How much new for-sale + rental construction is in the pipeline within 1–3 miles? Heavy new supply typically softens prices + rents 12–24 months out; constrained supply supports both.
Investment metrics
- 1% rule
- 0.78% ✗
- Cap rate
- 6.63%
- Cash-on-cash
- 1.20%
- DSCR
- 1.05
- GRM
- 10.7
CMA / ARV
No comps found within radius.
Projected returns pro-forma
-3.0% appreciation · 3.0% rent growth · sell at horizon
- IRR
- -14.5%
- Equity multiple
- 0.48×
- Total profit
- $-34,734
- Equity at exit
- $35,785
- IRR
- -5.8%
- Equity multiple
- 0.62×
- Total profit
- $-25,247
- Equity at exit
- $20,751
Cash invested: $67,200 (down + closing). Projections, not guarantees.
Landlord ↔ Tenant lean methodology
- Overall (STATE)
- 85 Strongly Landlord-Friendly
- State North Carolina
- 85 Strongly Landlord-Friendly · R+3
- County
- — inherits STATE
- City
- — inherits STATE
ZIP-level market 28394
- Active inventory
- 225
- Price-to-rent
- 10.7×
Monthly cashflow live
- Estimated rent
- $1,864 medium interval (Pro) →
- Mortgage (P&I)
- −$1,259
- Tax from tax record
- −$47 /mo · $561/yr
- Insurance
- −$100
- HOA
- −$0
- Vacancy / Maint / Mgmt
- −$391
- Net cashflow
- $67
Break-even live
UW: 25.0% down · 7.5% · 30yr · 1.5% tax · 5.0% vac · 8.0% maint · 8.0% mgmt
Financing live
Cash to close
- Down payment
- $60,000
- Closing costs
- $7,200
- Reserves months
- —
- Total cash needed
- —
Loan-product check · same deal, 3 products live
Conventional
25% down · 7.5% · 30yr
- Down + closing
- —
- Monthly P&I
- —
- Monthly cashflow
- —
- DSCR
- —
- Eligible?
- —
Personal DTI + credit; lowest rate.
DSCR
20% down · 8.5% · 30yr
- Down + closing
- —
- Monthly P&I
- —
- Monthly cashflow
- —
- DSCR
- —
- Eligible?
- —
No personal income docs; deal must DSCR.
Hard money
10% down · 12.0% · 12mo
- Down + closing
- —
- Monthly P&I
- —
- Monthly cashflow
- —
- DSCR
- —
- Eligible?
- —
Short-term bridge; refi at stabilization.
Listing history 3 events
-
2026-05-14status Pending
-
2026-04-26historical Active Under Contract
-
2026-04-18$240,000 Active
ⓘ Source: listings_history table (triggers on properties + properties_extension) + one-shot
backfill from property_details.listing_events for pre-trigger history.
Tax reassessment forecast NC · Resets to sale price
- Current annual tax
- $561 · $47/mo
- Projected year-2 tax
- $1,968 · $164/mo
- Expected delta
- +$1,407/yr (+$117/mo · 250.7%)
ⓘ Screening estimate from a state-policy table — verify with the county assessor before closing.
Climate risk First Street
- Flood 1/10 Low FEMA zone X (unshaded) · 0% chance over 30 yrs
- Wildfire 4/10 Moderate
- Heat 8/10 Severe 7 d/yr ≥106°F today · 17 d/yr by 30 yrs out
- Wind 6/10 Major 69% chance of damaging wind over 30 yrs
- Air quality 1/10 Low 0 unhealthy d/yr today · 0 by 30 yrs out
Nearby sold comps map
Loading sold comps map…
Walkable amenities ~0.75 mi
Loading nearby amenities…
Taxation est. · year 1
- Rental income
- $22,369
- − Mortgage interest
- −$13,444
- − Property taxes
- −$561
- − Insurance
- −$1,200
- − Repairs & maintenance
- −$1,790
- − Management
- −$1,790
- − Depreciation
- −$6,982
- Taxable loss
- −$3,397
- Est. tax savings @ 24.0%
- +$815
- After-tax cash flow
- $1,622/yr
For passive investors: Depreciation is non-cash, so a rental often shows a tax loss while cash-flowing — sheltering income. Rental losses are passive: they offset passive income freely, and up to $25,000/yr can offset ordinary (W-2) income if you actively participate and your MAGI is under $100k (phasing out to $0 by $150k); unused losses carry forward. On sale, claimed depreciation is recaptured at up to 25%, and gains may owe capital-gains tax (a 1031 exchange can defer both). Figures are a year-1 estimate at your 24.0% rate — not tax advice; consult a CPA.
Schools (NCES district)
- District
- Moore County Schools
- NCES district ID
- 3703090
- Math proficiency
- 48% ▲ 5.00%
- Reading proficiency
- 54% ▲ 5.00%
- Median HH income
- $50,333
- Composite
- 43.63/100
- National rank
- #2967
- State rank
- #58 of 178 in NC
Livability — Vass
- Score
- 57/100
- State rank
- #593
- US rank
- #21646
Category grades
Schools grade is shown separately in the Schools card above.
Census & demographics
- County
- Moore County · 75,247 people
- City population
- 5,936
- Metro
- Pinehurst-Southern Pines, NC
- Population (ZIP)
- 5,936
- Household income
- $79,643
- Rent vs Own
- Severe rent burden
- 109.0
Population outlook (Moore County) Hauer SSP2
- Today (2025)
- 106,902 people
- By 2030
- 113,134 · +5.8%
- By 2040
- 125,682 · +17.6%
- By 2050
- 137,811 · +28.9%
- By 2075
- 164,387 · +53.8%
- By 2100
- 175,595 · +64.3%
Race, ethnicity, and origin ACS 2023
- Neighborhood character
- Predominantly White (74%)
- Race & ethnicity
- White 74% Two or more races 10% Black 9% Hispanic / Latino 8%
- Hispanic origin (detail)
- Mexican 2%
- Common ancestry
- Slovak 6% Italian 2% Romanian 1%
- Foreign-born
- 6% · Canada, Jamaica
- Languages at home
- 91% English-only · Spanish 6% Arabic 2%
Political lean MEDSL · Moore
- 2024 margin
- Strong R (+29.5) · D 34.8% · R 64.3%
- 2008→2024 swing
- -8.1pp toward R · 2008: -21.4pp · 2024: -29.5pp
- All cycles
- 2024: R+29.5 2020: R+27.4 2016: R+29.6 2012: R+28.1 2008: R+21.4
Not yet ingested
- Civics
- —
Market trends
- HPI YoY
- ▼ -106.99%
- Current HPI
- 160.0419
- Rent YoY
- —
- Metro
- Pinehurst-Southern Pines, NC
- State GDP YoY
- ▲ 3.28%
- F500 in state
- 26
Industry mix (Fortune 500 HQ in NC)
| Industry | F500 HQs | Revenue |
|---|---|---|
| Financial Services | 2 | $213B |
|
||
| Retail | 2 | $95B |
|
||
| Industrial Conglomerate | 1 | $38B |
|
||
| Metals / Steel | 1 | $35B |
|
||
| Utilities | 1 | $30B |
|
||
| Industrial Machinery | 1 | $19B |
|
||
Price history
3 events — show timeline
- 2026-05-14 Pending — Hive MLS
- 2026-04-26 Contingent — Hive MLS
- 2026-04-18 Listed $240,000 Hive MLS
Property tax history
+0.6%/yrLatest (2024): $561 · -4.4% YoY. Source: county tax records.
Cash-flow waterfall
monthlySold comps — $/sqft
last 12 mo · ≤1 miLoading sold comps…