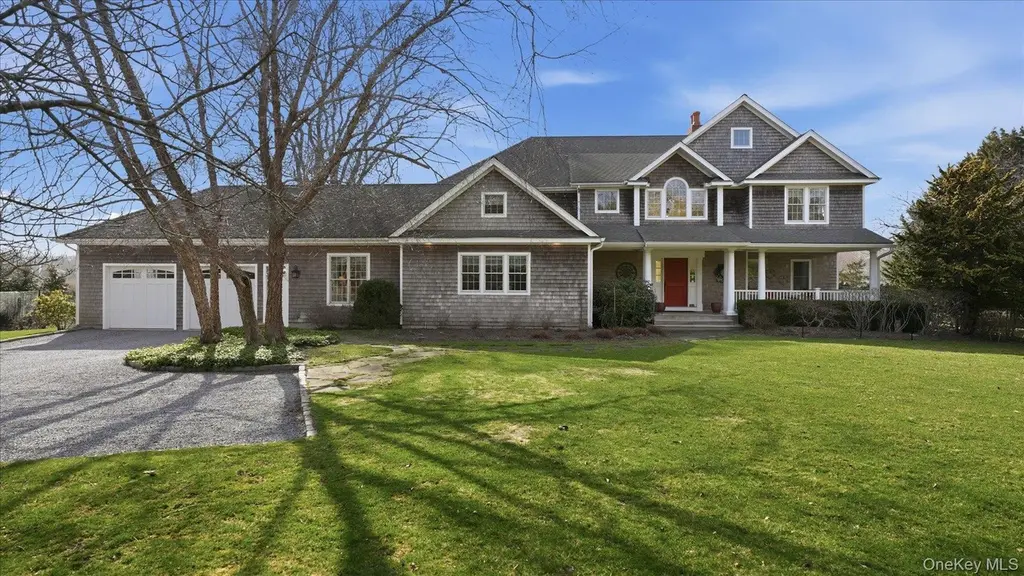
15A Brushy Neck Ln · Westhampton, NY
Flood risk 5/10 · Moderate
- FEMA flood zone
- X (unshaded)
- Chance of flooding over 30 yrs
- 0.47%
- Est. flood insurance / yr
- $473 – $860
Fire risk 1/10 · Minimal
- Est. fire insurance / yr
- $691 – $1,283
Heat risk 4/10 · Minor
- Hot days now (above 90°F)
- 7 days/yr
- Hot days in 30 yrs
- 19 days/yr
Wind risk 8/10 · Major
- Chance of severe wind over 30 yrs
- 80.0%
Air-quality risk 4/10 · Minor
- Unhealthy air days now
- 4 days/yr
- Unhealthy air days in 30 yrs
- 5 days/yr
Risk factors via First Street. Map © Google.
Why this score? — see what drove the C- grade
The composite is a weighted blend of 9 inputs, each scored 0–100. Each bar is that input's sub-score; the figure is the points it added to the 100-point composite (weight × sub-score).
- Cash flow +13.4/30.0
- Appreciation +9.4/10.0
- ARV discount +6.6/15.0
- Schools +6.6/10.0
- DSCR +4.0/10.0
- Livability +3.0/5.0
- 1% rule +2.8/10.0
- Rent growth +2.5/5.0
- Condition / age +2.5/5.0
$2,825,000
🖨 Deal sheet 📄 Offer letter ✓ Due diligence
Listing remarks MLS
Experience the ultimate in Hamptons waterfront living in this expansive Westhampton retreat. Tucked away on a private 2 acre flag lot on the Speonk River, this exceptional property offers a rare sense of seclusion while just moments from the Village of Westhampton Beach and local ocean beaches. Designed to capture a breathtaking western exposure, the home is perfectly positioned for unforgettable sunsets. Generous living spaces are filled with natural light, seamlessly blending indoor comfort with the beauty of the surrounding landscape. Ideal for both relaxed living and entertaining, the residence features spacious bedrooms, multiple gathering areas, and a screened-in porch overlooking your own fishpond. Constructed in 2002, a conversion of the original garage was made to living space along with the addition of a 2 car garage in 2005; Bringing the square footage of the residence to 4100+ square feet. Additional spaces include a main floor bedroom/bathroom, den/tv room, 2 living rooms, and screened-in porch. There is room for a pool on the "water side" creating a rare opportunity to own a private waterfront sanctuary in one of the Hamptons’ most sought-after locations.
Key facts
- Private flag lot
- Screened in porch
- Fishpond
Tags
Neighborhood map
What this means for you Summary
Snapshot
- This is a 4-bed/3.0-bath single-family listed at $2.83M.
Deal economics
- At list price, monthly cash flow is $46 ($555/yr) — positive.
- The deal already cash-flows at list — no discount required.
- To meet the 1% rule (rent ≥ 1% of price), the offer needs to be $2.20M (22.2% below list).
- Recommended offer: $2.20M (22.2% below list) — sets the bar for 1% rule.
- Cap rate 6.3% vs local median 9.1% in Westhampton — below-typical yield; the buyer is paying a premium for something (appreciation thesis, condition, location) that the cap rate doesn't capture.
Location & tenants
- Location reads 60/100 on livability (#969 in NY) — a middle-class / working-renter tenant base. Strengths: crime A+, employment A+; Watch: housing C-, schools D+, amenities F.
- Westhampton Beach Union Free School District (suburban): math 72% / reading 75% proficiency, ranked #81 of 590 in NY (top 14%) — strong family-tenant draw, lease renewals of 3-5y typical.
- Market conditions: 63 active listings in the ZIP; 4 comparable units currently listed for rent nearby; rentals at typical pace (median 22d on market — plan ~3-4 weeks tenant-placement turnaround); high-income renter base; 1,366 units permitted in Suffolk County in 2024 (216 in 5+ unit buildings).
- At $21,975/mo this rent would consume 174% of the median local household income ($151k/yr) — very limited rent-growth headroom before tenants either downsize or default.
Forward outlook
- In year one you build about $269k of equity ($20k loan paydown + $249k appreciation (8.8% local appreciation)).
- Suffolk County population projected to shrink 5% by 2050 — rents likely to lag national; underwrite the cash flow, not the appreciation.
- At projected returns (8.8% appreciation + 3.0% rent growth), your $791k cash investment doubles in ~3 years — after that, you're playing with house money.
- By year 2, paydown + projected appreciation supports a ~$431k cash-out refi (75% LTV) — recoverable capital for the next deal without selling this one.
Negotiation context
- It's been on market 72 days — a 6% lower offer ($2.66M) is reasonable based on typical stale-listing flexibility.
- Current owner paid $225k; list at $2.83M implies a 1156% gain — meaningful room to come down on a strong offer.
Risks & watch-outs
- Climate carrying-cost: moderate flood risk; severe wind risk, 80% chance of damaging wind over 30y — expect insurance premiums to compound above CPI over the hold.
Questions for the listing agent
- It's been on market 72 days. Have you received any prior offers? Is the seller open to a 22% concession, seller financing, or rate buy-down credit?
- Why hasn't it sold? Are there any deal-killer items the seller is aware of (foundation, flood, title, zoning, code violations)?
- Is there a deadline driving the sale (1031 exchange, divorce, estate, relocation)? That informs how much negotiation room exists.
- Schools are D-rated, which usually means shorter tenancies and higher turnover. Who's the typical renter profile here, and what's been the actual vacancy rate?
- What's the average days-on-market for RENTAL listings here right now (not sales)? A rising rental-DOM trend means longer vacancies and softer asking-rent achievability than the comps imply.
- What's the recent tenant-quality profile in this submarket — average credit score on applications, eviction rate, late-payment / NSF rate, and stable-employment percentage? A property-management company in the area should have these aggregated.
- How much new for-sale + rental construction is in the pipeline within 1–3 miles? Heavy new supply typically softens prices + rents 12–24 months out; constrained supply supports both.
Investment metrics
- 1% rule
- 0.78% ✗
- Cap rate
- 6.31%
- Cash-on-cash
- 0.07%
- DSCR
- 1.00
- GRM
- 10.7
CMA / ARV
- ARV (median comp)
- $2,769,803
- List price
- $2,825,000
- Delta
- 1.99%
- Verdict
- FAIR
- Comps
- 20 within 1.0 mi
Show comp detail 7 sales within ~0.75 mi
| Address | Dist | Beds/Ba | Sqft | Sold | Price | $/sf | Match |
|---|---|---|---|---|---|---|---|
| 27c Brushy Neck Ln | 0.25mi | 4/4.0 | 4,000 (-3%) | 19mo | $2,700,000 | $675 | 64 |
| 11 Pine Grove Ct | 0.36mi | 4/4.5 | 4,000 (-3%) | 13mo | $2,025,000 | $506 | 61 |
| 11A Brushy Neck Ln | 0.07mi | 5/5.0 (+1) | 3,643 (-12%) | 15mo | $3,101,000 | $851 | 52 |
| 11 Brushy Neck Ln | 0.08mi | 4/4.5 | 3,614 (-12%) | 24mo | $1,700,000 | $470 | 50 |
| 44 Bridle Path | 0.46mi | 4/6.5 | 4,220 (+2%) | 24mo | $1,750,000 | $415 | 40 |
| 34 Jagger Ln | 0.33mi | 5/7.5 (+1) | 4,600 (+12%) | 13mo | $3,930,000 | $854 | 34 |
| 108 S Country Rd | 0.70mi | 4/5.5 | 4,667 (+13%) | 10mo | $2,750,000 | $589 | 27 |
Match score weights: distance 35% · size 25% · config 20% · recency 20%. Top-matched comps best support the ARV.
Projected returns pro-forma
8.82% appreciation · 3.0% rent growth · sell at horizon
- IRR
- 21.8%
- Equity multiple
- 2.66×
- Total profit
- $1,316,625
- Equity at exit
- $2,306,828
- IRR
- 19.8%
- Equity multiple
- 5.84×
- Total profit
- $3,829,929
- Equity at exit
- $4,741,326
Cash invested: $791,000 (down + closing). Projections, not guarantees.
Landlord ↔ Tenant lean methodology
- Overall (STATE)
- 15 Strongly Tenant-Friendly
- State New York
- 15 Strongly Tenant-Friendly · D+10
- County
- — inherits STATE
- City
- — inherits STATE
ZIP-level market 11977
- Home prices YoY
- 2.3%
- Active inventory
- 63
- Price-to-rent
- 10.7×
Monthly cashflow live
- Estimated rent
- $21,975 medium interval (Pro) →
- Mortgage (P&I)
- −$14,815
- Tax from tax record
- −$1,322 /mo · $15,864/yr
- Insurance
- −$1,177
- HOA
- −$0
- Vacancy / Maint / Mgmt
- −$4,615
- Net cashflow
- $46
Break-even live
UW: 25.0% down · 7.5% · 30yr · 1.5% tax · 5.0% vac · 8.0% maint · 8.0% mgmt
Financing live
Cash to close
- Down payment
- $706,250
- Closing costs
- $84,750
- Reserves months
- —
- Total cash needed
- —
Loan-product check · same deal, 3 products live
Conventional
25% down · 7.5% · 30yr
- Down + closing
- —
- Monthly P&I
- —
- Monthly cashflow
- —
- DSCR
- —
- Eligible?
- —
Personal DTI + credit; lowest rate.
DSCR
20% down · 8.5% · 30yr
- Down + closing
- —
- Monthly P&I
- —
- Monthly cashflow
- —
- DSCR
- —
- Eligible?
- —
No personal income docs; deal must DSCR.
Hard money
10% down · 12.0% · 12mo
- Down + closing
- —
- Monthly P&I
- —
- Monthly cashflow
- —
- DSCR
- —
- Eligible?
- —
Short-term bridge; refi at stabilization.
Rent comps 4 comps
| Address | Beds | Baths | Sqft | Rent | $/sqft | DOM | Units | Dist |
|---|---|---|---|---|---|---|---|---|
| 3 Pine Grove Ct Westhampton, NY | 4.0 | 3.5 | 3500 | $35,000 | $10.00 | 22d | 1 | 0.26mi |
| 8 Sweetgrass Rd Westhampton, NY | 5.0 | 4.5 | 4050 | $13,000 | $3.21 | 1d | 1 | 0.57mi |
| 13 Buttercup Ln Westhampton, NY | 3.0 | 4.5 | 3278 | $25,000 | $7.63 | 5d | 1 | 0.57mi |
| 9 Plume Grass Way Westhampton, NY | 4.0 | 5.5 | 4405 | $40,000 | $9.08 | 43d | 1 | 1.18mi |
Listing history 15 events
-
2026-06-18days on market $2,825,000 Active 72 DOM
-
2026-06-17days on market $2,825,000 Active 71 DOM
-
2026-06-16days on market $2,825,000 Active 70 DOM
-
2026-06-15days on market $2,825,000 Active 69 DOM
-
2026-06-13days on market $2,825,000 Active 67 DOM
-
2026-06-09days on market $2,825,000 Active 63 DOM
-
2026-06-08days on market $2,825,000 Active 62 DOM
-
2026-06-07days on market $2,825,000 Active 61 DOM
-
2026-06-04days on market $2,825,000 Active 58 DOM
-
2026-06-03days on market $2,825,000 Active 57 DOM
-
2026-06-02days on market $2,825,000 Active 56 DOM
-
2026-06-01days on market $2,825,000 Active 55 DOM
-
2026-05-31days on market $2,825,000 Active 54 DOM
-
2026-04-07$2,975,000 Active 1204-char remark
Show marketing remark (1204 chars)
Experience the ultimate in Hamptons waterfront living in this expansive Westhampton retreat. Tucked away on a private 2 acre flag lot on the Speonk River, this exceptional property offers a rare sense of seclusion while just moments from the Village of Westhampton Beach and local ocean beaches. Designed to capture a breathtaking western exposure, the home is perfectly positioned for unforgettable sunsets. Generous living spaces are filled with natural light, seamlessly blending indoor comfort with the beauty of the surrounding landscape. Ideal for both relaxed living and entertaining, the residence features spacious bedrooms, multiple gathering areas, and a screened-in porch overlooking your own fishpond. Constructed in 2002, a conversion of the original garage was made to living space along with the addition of a 2 car garage in 2005; Bringing the square footage of the residence to 4100+ square feet. Additional spaces include a main floor bedroom/bathroom, den/tv room, 2 living rooms, and screened-in porch. There is room for a pool on the "water side" creating a rare opportunity to own a private waterfront sanctuary in one of the Hamptons’ most sought-after locations.
-
1999-09-29soldstatus $225,000
ⓘ Source: listings_history table (triggers on properties + properties_extension) + one-shot
backfill from property_details.listing_events for pre-trigger history.
Tax reassessment forecast NY · Partial reset (capped growth)
- Current annual tax
- $15,864 · $1,322/mo
- Projected year-2 tax
- $31,803 · $2,650/mo
- Expected delta
- +$15,939/yr (+$1,328/mo · 100.5%)
ⓘ Screening estimate from a state-policy table — verify with the county assessor before closing.
Climate risk First Street
- Flood 5/10 Major FEMA zone X (unshaded) · 47% chance over 30 yrs
- Wildfire 1/10 Low
- Heat 4/10 Moderate 7 d/yr ≥90°F today · 19 d/yr by 30 yrs out
- Wind 8/10 Severe 80% chance of damaging wind over 30 yrs
- Air quality 4/10 Moderate 4 unhealthy d/yr today · 5 by 30 yrs out
Nearby sold comps map
Loading sold comps map…
Walkable amenities ~0.75 mi
Loading nearby amenities…
Taxation est. · year 1
- Rental income
- $263,696
- − Mortgage interest
- −$158,244
- − Property taxes
- −$15,864
- − Insurance
- −$14,125
- − Repairs & maintenance
- −$21,096
- − Management
- −$21,096
- − Depreciation
- −$82,182
- Taxable loss
- −$48,910
- Est. tax savings @ 24.0%
- +$11,738
- After-tax cash flow
- $12,294/yr
For passive investors: Depreciation is non-cash, so a rental often shows a tax loss while cash-flowing — sheltering income. Rental losses are passive: they offset passive income freely, and up to $25,000/yr can offset ordinary (W-2) income if you actively participate and your MAGI is under $100k (phasing out to $0 by $150k); unused losses carry forward. On sale, claimed depreciation is recaptured at up to 25%, and gains may owe capital-gains tax (a 1031 exchange can defer both). Figures are a year-1 estimate at your 24.0% rate — not tax advice; consult a CPA.
Schools (NCES district)
- District
- Westhampton Beach Union Free School District
- NCES district ID
- 3631020
- Math proficiency
- 72% ▼ -5.00%
- Reading proficiency
- 75% ▲ 3.00%
- Median HH income
- $88,137
- Composite
- 65.91/100
- National rank
- #444
- State rank
- #81 of 590 in NY
Livability — Westhampton
- Score
- 60/100
- State rank
- #969
- US rank
- #18972
Category grades
Schools grade is shown separately in the Schools card above.
Census & demographics
- Census place
- Westhampton, NY
- County
- Suffolk County · 679,920 people
- City population
- 2,843
- Metro
- New York-Newark-Jersey City, NY-NJ-PA
- Population (ZIP)
- 2,843
- Household income
- $151,375
- Rent vs Own
- Severe rent burden
- 14.0
Population outlook (Suffolk County) Hauer SSP2
- Today (2025)
- 1,505,262 people
- By 2030
- 1,498,318 · -0.5%
- By 2040
- 1,471,101 · -2.3%
- By 2050
- 1,424,848 · -5.3%
- By 2075
- 1,337,157 · -11.2%
- By 2100
- 1,217,720 · -19.1%
Race, ethnicity, and origin ACS 2023
- Neighborhood character
- Predominantly White (89%)
- Race & ethnicity
- White 89% Hispanic / Latino 5% Asian 3% Two or more races 2%
- Hispanic origin (detail)
- Common ancestry
- Scotch-Irish 3% Romanian 3% Subsaharan African 1%
- Foreign-born
- 11% · Canada, South Korea
- Languages at home
- 89% English-only · Spanish 5% Other Indo-European 4% Korean 2%
Political lean MEDSL · Suffolk
- 2024 margin
- Lean R (+10.0) · D 45.0% · R 55.0%
- 2008→2024 swing
- -16.0pp toward R · 2008: 6.0pp · 2024: -10.0pp
- All cycles
- 2024: R+10.0 2020: R+0.0 2016: R+8.2 2012: D+2.9 2008: D+6.0
Not yet ingested
- Civics
- —
Market trends
- HPI YoY
- ▲ 8.82%
- Current HPI
- 391.8868
- Rent YoY
- —
- Metro
- New York-Newark-Jersey City, NY-NJ-PA
- State GDP YoY
- ▲ 2.60%
- F500 in state
- 92
Industry mix (Fortune 500 HQ in NY)
| Industry | F500 HQs | Revenue |
|---|---|---|
| Financial Services | 10 | $950B |
|
||
| Consumer Goods | 9 | $162B |
|
||
| Insurance | 4 | $225B |
|
||
| Telecommunications | 2 | $144B |
|
||
| Pharmaceuticals | 2 | $112B |
|
||
| Media / Entertainment | 2 | $69B |
|
||
Price history
+1222.2% since first listed2 events — show timeline
- 2026-04-07 Listed $2,975,000 OneKey® MLS as Distributed by MLS Grid
- 1999-09-29 Sold (Public Records) $225,000 Public Records
Property tax history
+1.3%/yrLatest (2022): $15,864 · +0.0% YoY. Source: county tax records.
Cash-flow waterfall
monthlySold comps — $/sqft
last 12 mo · ≤1 miLoading sold comps…